YouTubeにあるマーケットチュートリアルビデオをご覧ください
ロボットや指標を購入する
仮想ホスティングで
EAを実行
EAを実行
ロボットや指標を購入前にテストする
マーケットで収入を得る
販売のためにプロダクトをプレゼンテーションする方法
MetaTrader 5のためのエキスパートアドバイザーとインディケータ - 116

Excellent dashboard for market analytics. The panel helps to analyze the values of the Stochastic indicator and its signals.
With this panel you can: watch the current signal from Stochastic on all timeframes; watch the current signal from Stochastic for different symbols; watch the current Stochastic value; several types of signals for analytics.
Values in a table cell: Stochastic - Main line Stochastic - SIgnal line Stochastic - Main line minus signal line
Signal type: Sto
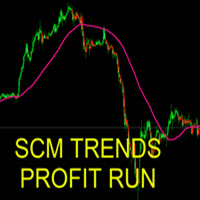
The indicator can be used in several ways. The simplest is to buy when the SCM Trends Profit Run line is painted green and sell when it is red. This indicator that allows you to detect several changes and dynamics in price that many traders can’t estimate or see without an indicator, which highlights its essence and usage.
Accordingly, traders can draw conclusions and make estimates about how the prices will change based on the information they have and then they can modify their strategy fo
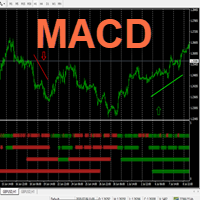
Hello This Indicator will draw Green (Up) and Red (Down) small arrows from Multi TimeFrames based in ( MACD ) to help you to take decision to buy or sell or waiting If there 4 green arrows in same vertical line that's mean (Up) and If there 4 Red arrows in same vertical line that's mean (Down) and the options contain (Alert , Mobile and Mail Notifications). Please watch our video for more details https://youtu.be/MVzDbFYPw1M and these is EA for it https://www.mql5.com/en/market/product/59092 G

It is a Graphical and Trend indicator that brings several advantages. Eliminates noise.
Facilitates the identification of the trends. Can be used as directional force indicator. Identify lateralization: candles with close and open price closer. Identifies high volatility: candles with shadows larger than the body. Attention!!! Works on any asset and any time frame.
Easy setup Symbol: anyone Time frame: anyone Parameters: Indicator Period Recommended Period : betw


Do you already know Display N Bars?
Do you already know the Start tool (from Midas indicators)?
In this indicator, we unified the two tools, allowing you to define which candle will start counting, or use the automatic numbering that was already available in the previous version.
Description of the utility follows:
Display N Bars
The Display N Bars utility is a simple tool that aims to help identify candles.
If a trader tries to share the knowledge with a colleague but it i

O Indicador CoioteChart foi construído pra facilitar desde a leitura de contexto de mercado até a micro estrutura do candle, facilitando ajustes operacionais e tomadas e decisão com alta eficácia.
Possui um controle para habilitar e desabilitar a visualização das pocs, vwap, zonas de máxima e mínima negociação, pode ser utilizado data sources de tempos gráficos para cálculos ou utilizado os ticks de agressão do time and trades, funciona com volume real e volume de ticks.
As colorações são at

This Indicator is based on the high's moving average and the low's moving average for trend following and/or trailing stops.
How does the indicator work? The indicator plots the uptrend dots until there is a close below the moving average of the lows. When this happens, a downtrend begins and is plotted until there is a close above the moving average of the highs. When this happens, another uptrend begins. And so it goes.
How to use it? - Trend following: You can use it as buy signals when

The indicator identifies two most important patterns of technical analysis - Pin Bar and Engulfing. MT4-version: https://www.mql5.com/en/market/product/53591 Settings: Mincandle size for PinBar - The minimum size of the Pin-Bar candlestick; Percentage of candle body on size - The percentage of the candle body in relation to its length; PinBar Alert - Alert when a Pin-Bar is detected; PinBar Mail - Sends an email when a Pin Bar is found; PinBar Notification - Sends a push notificati
This cost averaging Expert advisor (EA) places additional trades in the same direction as the original (manually opened) order when the price goes against you. It can be used as a grid system or as pure martingale system (exponential increasing of lot size) or smoothed martingale (for instance linear increasing of the lot size). Due to the risk involved, this EA is more suitable for intermediate to advanced traders who are well aware of how to handle risk management and trading an already profit

VolumeDeltaScanner is a volume delta monitor for multiple (up to 10) time scopes. It works by online ticks or history ticks. Indicator monitors tick volumes for buys and sells separately, and find their delta on every bar and larger scopes, then displays the volume deltas for all the scopes. Every scope is presented by its own buffer/line. The smallest scope is the current timeframe. It's required. All other scopes should be multiples of it. For example, if placed on a M5 chart, it can calculat

Trade with your MT5 Account on a custom API-Endpoint.
1. Activate API on your Signal Site.
2. Enter your Username.
3. Enter your Account-Password.
4. Enter the API-Endpoint URL to your MT5 Account (Extras -> Options -> Experts -> Allow WebRequest).
Lot Size Settings
Auto Lot = 0 and Fixed Lot = 0 : Copy Lot Size.
Auto Lot : Option to send normalized Lot-Size depends from Free Margin on Trading-Account. Because other Traders will start with different Account Size.
For Example:
MT4: https://www.mql5.com/en/market/product/52715
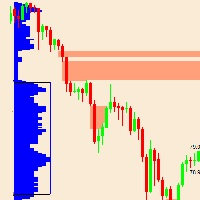
この指標は、マーケットプロファイル理論に基づいています。
シングルエリアとは正確には何ですか?
理論:マーケットプロファイルシングル:
プロファイルのシングルまたはシングルプリントまたはギャップは、上端または下端ではなく、プロファイル構造の内側に配置されます。
それらは、マーケットプロファイルに印刷された単一のTPOで表されます。
シングルは、価格が非常に速く動いた場所(インパルスの動き)に注意を向けます。それらは流動性ギャップのある少量のノードを残し、したがって市場の不均衡を示し、不均衡の領域を示します。シングルは通常、市場が予期しないニュースに反応したときに作成されます。極端な不均衡を引き起こし、買い手と売り手の極端な感情的反応に備えてスポーンを準備することができるのは、これらのレポートです。
市場はこの領域を再検討し、これらの価格レベルがこれらの価格での取引に関心のあるトレーダーではないかどうかを調べたいと思うでしょう。なぜこれらの商人はそこにいるべき

Description
Range Detector is an indicator that identifies ranges in the market and displays their presence on the price chart.
Recommendations
You can use this indicator to determine the flet and, accordingly, to determine the direction of opening a position or closing an opposite position.
Parameters
Maximum History Bars - maximum number of history bars for calculating the indicator. Average True Range Period - ATR indicator period (used to calculate the difference between mov
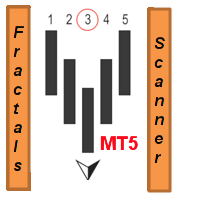
This multi time frame and multi symbol indicator identifies fractals patterns. As a bonus it can also scan for Parabolic SAR (pSAR) trend changes. Combined with your own rules and techniques, this indicator will allow you to create (or enhance) your own powerful system. Features
Can monitor all symbols visible in your Market Watch window at the same time. Apply the indicator to just one chart and instantly monitor the entire market. Can monitor every time frame, from M1 to MN, and sends you a r

This Expert advisor is advanced with Force indicator which detects the momentum change and cuts the position by using its intelligence Where it generates revenue in long term .User can change the lot size based on risk calculation which provided by our team .It differs from other EA where this suits for long term usability with decent returns ,This has to be run on EURUSD 1 hr time frame ,Minimum recommended capital is 500 dollar ,still clients can operate in low capital by changing the lot size

Mercury MT5 it is a Secure Automated Software for trade Forex market and indices.The architecture is a Fully Automatic Autonomous Robot Expert. Mercury MT5 It is an advanced trading system. The system is ideal for consolidated market. You can download the demo and test it yourself.
Very stable growth curve as result of smart averaging techniques.
"Safety first" approach in development. Stress-tests on historical data for multiple pairs. Broker type: Low spread, f
こんにちは.
CatchCandleLimitOrderOneSymbol-フラットexpert Advisorは、中央にチャネルの境界から注文を開くために、固定S/LとT/Pで、カスタムチャネル幅インジケータTMAから、サポートと抵抗レベルから最高の偏差を待ってから、受注buylimitで市場に参入するために常に良いです;selllimit,同様に私たちは、価格の全体的な動きを追跡することは、一般的な傾向から M5操作のための推薦された時間枠。
損益分岐レベルが使用されています–ある程度の利益に達したときに開いているポジションのストップロスがトレーダーによって契約の開始価格に移 損益分岐レベルが使用されています–ある程度の利益に達したときに開いているポジションのストップロスがトレーダーによって契約の開始価格に移 。通信のための連絡先777basil@mail.ru 私たちは、専門家、あなたのタスクのための指標を準備します。 https://youtu.be/WBoduCjpJCM

Excellent dashboard for market analytics. The panel helps to analyze the values of the RSI indicator and its signals.
With this panel you can: watch the current signal from RSI on all timeframes; watch the current signal from RSI by different symbols; watch the current RSI value; several types of signals for analytics.
Values in a table cell: RIS value.
Signal type: RSI crosses level buy out/level sell out (outside); RSI crosses level buy out/level sell out (inside);
RSI is u
This EA trades with the trend using several methods to identify and enter a trade. For example, it uses trendlines, Gator and Stochastic indicators to analyze the market. In addition to trading, it can also display trend lines that it trades based on. It has filters for ADX and MA indicators, as well as a sufficient number of settings to be able to optimize on various currency pairs and timeframes.
The EA sets stop loss and take profit for each trade, does not have risky trading methods. It i

FXC iCorrelatioN MT5 Indicator (Specialized for DAX - DowJones)
The indicator shows the correlation soefficient between two assets. Correlations are useful because they can indicate a predictive relationship that can be exploited in practice. The correlation coefficient shows the relationship between the two symbols. When the correlation is near 1.0, the symbols are moving togerhet in the same direction. When the correlation is near -1.0, the symbols are moving in opposite direction. Main featu

MultiPairs MT5 is a fully automated Expert Advisor. This expert advisor is based on Multi-currency strategy . This system analyzes the market volatility to find trading signals based on trend reversal strategies and is used to evaluate oversold and overbought market conditions. Swing trading is a short-medium speculation based on the buying-selling force in the trading market with an advantage and low risk with a trend reversal pattern. The Expert Advisor does not use martingale, grids, hedg

Horizontal Level indicator - reflects, using a histogram, the horizontal volumes of transactions at a certain price without reference to time. At the same time, the histogram appears directly in the terminal window, and each column of the volume is easily correlated with the quote value of the currency pair. The volume of transactions is of great importance in exchange trading, usually an increase in the number of concluded contracts confirms the trend, and their reduction indicates an imminent

Strategy is based on moving average analysis with the Timeframe H1.
It is a combination of powerful trading techniques.
The trading system is suitable for experienced traders and beginner.
The EA allows you to trade with a fixed lot size.
Recommended :
Recommended timeframe is H1.
Minimum account balance: $200.
Default parameters are for EURUSD.
Features :
The EA is not sensitive to spread or broker, you may chose any broker you trust to; The EA is very easy to setup and use.

EA made using combination of Pending Order and Martingale Strategy. Designed only to work best on Gold Spot M5. EA will put pending orders and on certain condition will create positions with bigger lot. This EA do not use Stop Loss due to the applied strategy. Stop Loss will be replaced using modified Take Profit.
Input Parameters 1. MaxOpenPositions : Define allowed positions can be open by EA, 0 will use default EA Value 2. TotalPendingOrders : Define allowed generated Pending order set, 0

ARSINIUM is brand new Multi Strategy EA where you are able to define your Entry Points like a PRO! Originally it was developed as a Scalper for lower Timeframes, but we saw that the Entry Points, combined with some Filters, and other useful Options, are more than that. It works in many different Conditions and has many different Strategies you can build on your own. Test it for yourself and find out the best Strategy inside the Strategy! We offer this for 99 USD for a limited time to support

EA designed to generate pending orders based on the trend and designated take profit value. This EA designed exclusively to work best on GOLD SPOT M5 especially during up trend. User can freely decide to close the open position from this EA or wait until take profit hit. No parameters need to be set as it already set from the EA itself. This EA do not use Stop Loss due to the applied strategy. Please do fully backtest the EA on the worst condition before use on the real account. Recommended ini

It is very easy to use the Fibrillar indicator, since the simplest is to look at the chart and act according to the indications of the colored arrows. The algorithm takes into account the measurement of prices, and this method also focuses on measuring each of the price drops (H / C, H / O, LC, LO) - which gives more detailed information, but also more averaged.
When calculating this indicator, logarithmic gains are first calculated at the closing price, which allows you to filter out the tre

The fundamental technical indicator Ripple, allows you to assess the current market situation in order to enter the market of the selected currency pair in the trend and with minimal risk. It uses in its basis the process of identifying the rate of change in price growth and allows you to find points of entry and exit from the market.
This indicator was created on the basis of the original indicators of the search for extremes, the indicator is well suited for detecting a reversal or a large

Buy and sell signals based on Joe DiNapoli's shifted 3 period exponential moving average strategy for trend reversals.
Who is he? Joe DiNapoli is a professional trader and author that has been involved in the markets for more than 38 years. He is also a registered Commodity Trading Advisor (C.T.A.) for over 15 years and has taught his techniques in the major financial capitals of Europe, Asia, South Africa, the Middle East, Russia and in the United States.
How does the indicator work? The i
A trending strategy using a combination of two popular indicators Bollinger Bands and RSI provides reliable signals.
The logic of the advisor
Entering a short position is carried out when the price touches the upper Bollinger band, while the RSI indicator should be in the overbought zone, i.e. above level 70. Entering a long position is carried out when the price touches the lower Bollinger band, while the RSI indicator should be in the oversold zone, ie below level 30. It is possible to tr

Buy and sell signals based on the Continuous Point Setup for trend continuation, popularized in Brazil by Stormer and Palex.
How does it work? The indicator activates the buy signal when we have prices above the ascending 21-period Simple Moving Average (SMA21) followed by a pullback and a touch on it.
For a sell signal we need the prices below the descending SMA21 followed by a pullback and a touch on it.
How to use it? One way of using it, as suggested by Stormer, is to enter the

HUBBLE it is a Secure Automated Software for trade Forex market and indices.
The architecture is a Fully Automatic Autonomous Robot Expert capable of
Independently analyzing the market and making trading decisions
HUBBLE It is an advanced trading system. This is a fully automatic Expert Advisor.
HUBBLE It is a 100% automatic system, The system is self-sufficient, performing all the work. Is a revolution in the customization of the trading. You can download the demo and te

Indicator with 3 features
- Clock : Clock independent of the chart, counting continues even when the market is closed.
- Template : After setting up a configuration in any graphic, be it color patterns, indicators, zoom ... The configuration will be copied to all active graphics.
- TimeFrame : Set the TimeFrame on a chart, and with just one click all the active charts will be changed to the same TimeFrame.

Utility for know the performance of your acoount.
From dialog you can filter data in this modes:
- You can include or not include the open positions - You can include or not the closed positions - You can filter the data by date (from, to) - You can filter the data by simbols (multi selection) - You can filter the data by magic number (multi selection)
On bottom of table, are show the total of:
- Number of data - Total size - Total commissions paid - Total swap paids - Total profits - T
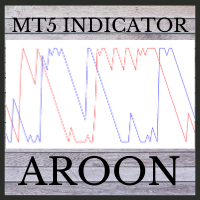
This indicator is powerful for detecting the trend.
The crossing between to line is the entry signal. Buffer 0 is UP line. Buffer 1 is DOWN line. Note: 1. Aroon is great tool for trending detecting. Please try to select the best period for each instrument.
Input AroonPeriod =14- Aroon period
MailAlert =false- Send email when entry signals appeared.
SoundAlert =false- Notify on MT5 platform.

BeST_Keltner Channels Strategies MT5 is an MT5 Indicator based on the original Keltner Channels Indicator and it can display in the Chart all the known Variations of Keltner Channels and also the corresponding 10 totally Strategies. Every such generally consists of a Central Moving Average Line and two Boundary Bands at a distance above and below it and can be traded mainly in a Trending Mode but also in a Ranging ReEntry Mode.
BeST_Keltner Channels Strategies Indicator Draws definite Bu

Description :
Combination EA MT5 is a simple Expert Advisor based on Combination MT5 custom Indicator. The Indicator is incorporated in the EA, therefore you don't need it as a separate tool for the EA to operate. Combination MT5 custom Indicator is based on Stochastic Oscillator and Average True Range (ATR), both are set to their default values. If you wish, you can download Combination MT5 custom Indicator for free from my product page .
The Expert Advisor settings are as follows :
Ma

Introduction to Fibonacci Volatility Indicator Volatility indicator can help you to detect any statistical advantage for your trading. Especially, if you are trading with Price Action and Price Patterns, then we recommend to use the Volatility indicator together with your strategy. Especically, Fibonacci Volatility indicator combines the market volatiltiy with Fibonacci Analysis to provide you more advanced volatiltiy indicator. Main Features Fibonacci Volatility in Z score Configuration Mode Fi

Great dashboard for market analytics. The panel helps to analyze the values of the Envelopes indicator and prices.
Using this panel you can: watch the current signal from Envelopes for all time frames; watch the current signal from Envelopes by different symbols; look at how far Envelopes is from the price; look at how much the value of Envelopes has changed; several types of signals for analytics.
Values in the table cell: Envelopes value upper line; Envelopes value lower line;
"the

Индикатор построен на основе индикаторов VIX и RSI. Комбинация двух указанных индикаторов позволяет обнаруживать зоны крайней перепроданности, где цена с большой долей вероятности изменит направление. Наиболее сильные сигналы дает в периоды слабого тренда. Сигналом индикатора является изменение направления гистограммы (с роста на снижение) выше заданного (сигнального) уровня.
В индикаторе задан широкий спектр параметров, который позволяет оптимизировать индикатор для торговли любыми активами:

ResiSupo (Traders Club)
このインジケータは直近の高値と安値を抜いたときに何ら方法で 知る方法はないかと思い開発されました。
機能: 指定したローソク足の本数で終値をベースに最高値と最安値の ラインを自動で引きます。 最高値と最安値のラインにタッチするとアラートで通知します。 通知はE-mailやSNSにも送信することができます。 最高値と最安値のラインを終値か高値または安値ベースにするかを選択できます。 Indicator Noを変えることによるこのインジケータを複数適用することができます。 これにより過去80本と20本などでの最高値と最安値のラインを引くことが可能になります。 現在のATRの値を画面に表示します。 これにより現在のボラリティーの状況が一目で分かります。 表示されているSLはディフォルトではATR値の1.5倍になっています。 この数値は現時点でのボラリティーの状況からの損切り幅の目安となります。 ATRのレベルにより表示の色が変わります。 ボタンを押すことによりアラートの通知を無効にできます。 ※ネットワークの不安

AKT for MT5 (Traders Club)
機能: MAゴールデンクロスで買いサイン、デットクロスで売りサインを表示します。 MAの期間は短期足と長期足を入力できます。 MAの種類を選択できます。(SMA、EMA、SMMA、LWMA) 適用する価格を選べます。(CLOSE,OPEN,LOW,HIGH,MEDIAN,TYPICAL,WEIGHTED) サインをアラートで通知します。 サイン発生をE-mailやSNSで通知します。 表示するサインを変更することが出来ます。
サインの色を変更することが出来ます。
サインの表示された時間と価格が表示されます。
※価格は終値になります。
Indicator Noを変えることによるこのインジケータを複数適用することができます。
これにより違う MAの期間による ゴールデンクロスと デットクロスのサインを
表示できます。
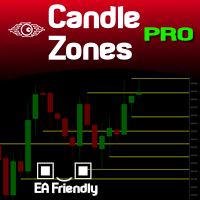
You probably heard about Candlesticks behaviors, which in most of the times could denote and trace Volume behaviors even if you are not watching Volume itself... Well, this indicator will do this. Naked traders love to rely solely on candlesticks patterns and with Candle Zones you can trap special patterns and DRAW THEM on your chart. As simple as that. There are several filters you can tweak in order to achieve the analysis you want. Just give it a try. After several months of testing, we think
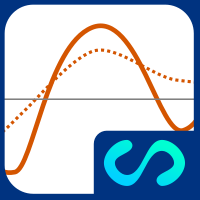
線形回帰の勾配値の表現。スロープ値の変化(価格の加速/減速)を視覚的に判断するための参照プロットがあります。
パラメーター
•Periods:線形回帰を計算する期間の数
•PeriodsReference:メインプロットの値の移動平均を計算するための期間数
•Displacement:水平軸上の変位
•AppliedPrice:計算が行われる価格
•MainPlot:メインプロットの表示
•ReferencePlot:参照プロットの表示
使用のための提案
•現在の価格傾向を簡単に表示できます。 MainPlotがゼロより大きい場合、傾向は正であり、ゼロより小さい場合は負です。
•勾配の変化(価格の加速/減速)を簡単に視覚化できます。 MainPlotがReferencePlotを上回っている場合、価格は加速しており、下回っている場合、価格は減速しています。
•スイング取引または高速取引に最適です。
•取引の主な方向を決定するのに理想的(購入/販売)。
•値領域(

The Metatrader 5 has a hidden jewel called Chart Object, mostly unknown to the common users and hidden in a sub-menu within the platform. Called Mini Chart, this object is a miniature instance of a big/normal chart that could be added/attached to any normal chart, this way the Mini Chart will be bound to the main Chart in a very minimalist way saving a precious amount of real state on your screen. If you don't know the Mini Chart, give it a try - see the video and screenshots below. This is a gr

線形回帰の切片値と切片値に対称的な平均絶対偏差の表現。
パラメーター
•Periods:線形回帰を計算する期間の数
•Amplitude:バンドを定義するための絶対平均偏差の乗数
•Displacement:水平軸上の変位
•AppliedPrice:計算が行われる価格
•MainPlot:メインプロットの表示
•UpperPlot:上部バンドの表示
•LowerPlot:下部バンドの表示
価格が範囲内にある場合、移動平均は線形回帰にすぎないことに注意してください。ここでは、最もよく使用されるインジケーターの1つに対する線形回帰の利点がわかります。これは、価格がトレンドであるときに移動平均ではなく同じように調整されることです。
使用のための提案
•移動平均と比較して超高速なので、MainPlotは価格をより適切に表します
•バンドは、レンジだけでなくトレンドでも価格チャネルをより正確に定義します。これはスイング取引に最適です
•傾向を肉眼で視覚化するために使用できま

Great smart dashboard for market analytics.
Using this dashboard you can: find signals from different indicators from all timeframes ; find signals from the Moving Average from all symbols ;
Include: 9 indicators (10 in Mt5 version); 27 signals (29 in Mt5 version); "Total" page.
Indicators and signals: MOVING AVERAGE MA cross Price - MA crosses Price; MA more/less Price - MA higher/lower Price; BOLLINGER BANDS BB crosses Price (in) - Price crosses Bollinger (upper/lower line

The best time to trade Using this Indicator is when the time reach exactly hour,half,45 minutes,15 minutes and sometimes 5 minutes..
This indicators is helpful to those who trade boom and crash indecies.How to read this indicator first you'll see Blue allow and Red allow all these allows used to indicate or to detect the spike which will happen so the allow happens soon before the spike happen.This indicator works properly only in boom and crash trading thing which you have to consider when

An algorithm to detect a spike instantly with zero lag.. Use default settings for "Crash And Boom" This smart algorithm detects a spike, which can be use to filter out market spikes, give entry signals with exit. Trading:- Booming for Boom and Crashing for Crash
Spike Signal:- The less you decrease the more signals
Multiplier:- This multiplies the Signal
Time Ratio:- For adjusting the Signal
AlertProperties = "====== Alert Properties ======";
SendAlertViaAlertWindow:- if set to true it wil

Old Partridge knew markets which are almost as old as the Earth itself are never wrong. The legend says he knew how to beat a legion of others. This system he will to me. This system I will give to you.
Example [1] = 100 pips, profit boundary [2] = 2.0, take profit [3] = 400, stop loss [4] = 200 You buy EURUSD as 1.1440. SL will be set to 1.1420, TP will be set to 1.1480, when EURUSD = 1.1460 SL will be moved to 1.1450 EA works with the pair it is run on, [5] option allows to escort positions

Currency Strength Meter is the easiest way to identify strong and weak currencies. The indicator shows the relative strength of 8 major currencies: AUD, CAD, CHF, EUR, GBP, JPY, NZD, USD.
By default the strength value is normalised to the range from 0 to 100 for RSI algorithm: The value above 60 means strong currency; The value below 40 means weak currency;
The indicator is created and optimized for using it externally at an Expert Advisors or as a Custom Indicator inside your programs.

MA Jumps Expert (MT4 version https://www.mql5.com/pt/market/product/52250 ) This system uses the overall trend to trade exponential moving averages jumps that at the same time form some pattern (wick formation, engulfing). The system uses 2 exponential moving average to calculate the jumps to trade, based on the market direction. The market direction is determined by the 200 exponential moving average. This system was design to work best for EURUSD and AUDUSD on 1H timeframe and its

This multi symbol indicator has been designed to automatically identify when price reaches major psychological levels. Also known as round numbers, whole numbers or key levels. As a bonus it can also scan for pivot point level on one selected time frame. Combined with your own rules and techniques, this indicator will allow you to create (or enhance) your own powerful system. Features Can write the signals to a file which can be used by an Expert Advisor for auto trading. Can monitor all symbols

RSI Robot Easy kono kanzen ni kōsei kanōna robotto wa, RSI injikētā o bēsu to shite shiyō shite chūmon o jikkō suru koto o mokuteki to shite imasu. Kawa re sugi no ryōiki ni hairu toki, oyobi/ matawa ura re sugi no ryōiki o hanareru toki ni, entori ga hassei suru ka dō ka o sentaku suru koto ga kanōdesu. Ichido ni sutoppurosu to teikupurofitto, oyobi saidai chūmon-sū o settei suru koto ga kanōdesu.

This Expert Advisor is a fully automated trading system on the most popular major currency pairs and is based on Moving Average and Alligator settings optimized to get the maximum return over time. Draw Down is controlled using trailing stop and each currency can have different set files. A Large number of inputs and settings are tested and optimized and embedded in the program hence making inputs options very simple and easy to understand.
SET FILES ARE ADDED TO THE COMMENT #1 OFFER until

SETI is a Break indicator multipair searching SETI is a powerful indicator of for any par and any timeframe. It doesn't requires any additional indicators for the trading setup.The indicator gives clear signals about opening and closing trades. This Indicator is a unique, high quality and affordable trading tool. Can be used in combination with other indicators Perfect For New Traders And Expert Traders Low risk entries. Never repaints signal. Never backpaints signal. Never recalculates
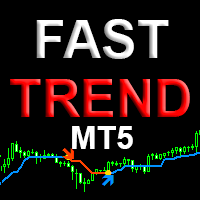
Fast trend - профессиональная версия индикатора определения направления тренда и точек входа. Индикатор с высокой вероятностью определяет направление тренда на любых валютных парах, акциях, криптовалюте без перерисовки результата. Для определения тренда использует Price action и авторский уникальный алгоритм фильтрации. Подходит для всех видов торговли, как для скальпинга так и для долгосрочной торговли. Данная версия индикатора это другая ветка эволюции алгоритма индикатора Simple Trend

MTF-Candlestick (Traders Club)
特徴: このインジケータは上位足のローソク足を表示します。 この上位足のローソク足を表示のインジケータは特に1分足や 5分足トレーダ用に開発されたものになります。
現在のローソク足で上位足のローソク足を作成する部分 と過去の上位足のローソク足を作成する部分を 分けています。また、更新はティックごとではなく 指定した時間ごとになるので急な価格変動があった場合でも チャートがフリーズした状態には非常になりにくいということになります。
陽線や陰線の色を変更出来たり髭の太さを変更できるので非常に 見やすと思います。
各パラメータの説明: Indicator No:インジケータNoを設定します。もし同じチャートに複数適用したい場合には個々の数字を変更してください。 TimeFrame:表示する時間足を設定します。 Bullish candlestick color:陽線のローソク足の色の指定します。 Bearish candlestick color:陰線のローソク足の色の指定します。 Doji c
MTF-MA2 for MT5 特徴: MTF Moving Averageを8本一気に表示してくれるインジケータになります。 8本も必要ない場合にももちろん非表示にできます。
パフォーマンスを考慮しているのでチャートが重くなるようなことは 無いはずになります。どの通貨でも使用可能になります。 それぞれのMTF Moving Averageの色や太さを変更できます。
各パラメータの説明: Method:MAの種類設定をします。 Applied price:MAで使用する価格を設定をします。 TimeFrame M5:使用するMAの時間足を設定します。 Period M5:使用するMAの期間を設定します。 ※ラベルに関係なく8本のMTF MAはどの時間足でも期間設定可能になります。
Limited bar?:表示に使用するバーを制限するかどうかを設定します。 ※ここをFalseにするとすべてのバーを読み込むことになるのでチャートが重く なるかもしれません。ご注意ください。 Max bars:使用するバーの本数を設定します。過去検証をする場合にはここの値を増や

Time Line for MT5
機能: 昨日高値、安値、本日始値、高値、安値の時間から線を引きます。 時間足により表示する時間が変わります。 1分、5分足では1時間ごとの表示 15分、30分足では4時間ごとの表示 1時間、4時間は12時間ごとの表示 日足以降は時間は表示されません。 高値安値は週足より下位足で表示されます。 各ラベルを変更可能になります。 更新頻度を変更できるのでチャート表示が 重くなることはありません。
各パラメータの説明:
Server_Time:6 サーバとの時間差を入力 Yesterday_High_Label:昨日高値 Yesterday_Low_Label:昨日安値 Show_Open:true 始値の線を表示するかどうか Today_Open_Label:本日始値 Today_High_Label:本日高値 Today_Low_Label:本日安値
max_bar:true 使用するバーを制限するかどうか Maxbars:1500 制限を使用した場合に1分では5日分 UpdateFrequency:60 更新頻度、ディフォルトは

このEAを使用することによりワンクリックによる決済、 決済したい通貨のチャートに適用しておけば様々な条件で自動で 決済することが可能になります。 パフォーマンスを考慮しているので動作が非常に軽いです。
新機能:Ver2.3
設定した利益以上になるとSLが建値(BE)に設定
新機能:Ver2.0
資金管理による買いや売りエントリ
トレード毎に自動スクリーンショット取得 詳細な情報はこちらにサイトがあります。
https://toushika.top/tc-panel-for-mt5/
機能:
ワンクリックによる全通貨決済
ワンクリックによる表示上の通貨決済
分かりやすいPips表示 移動可能
全通貨での合計Pips表示
自動利確、損切り設定
設定以上のスプレッドになった場合には画面の色が変化
Break Evenラインの表示
チャート画像の保存
決済の通知機能(Email,SNS)
パネル位置指定
Pips表示消去
他の通貨で設定した水平線で決済
下記に示した条件での利確
条件による決済:

Buy and sell signals based on Larry Williams's exponential moving average strategy 9.4 for failed reversals and trend continuation.
How does it work?
For an uptrend, we need a candle turning the 9 period EMA down and closing below it, followed by a candle turning the 9 period EMA up and closing above it, with a low higher than the previous candle's low. For a downtrend, we need a candle turning the 9 period EMA up and closing above it, followed by a candle turning the 9 period EMA down and
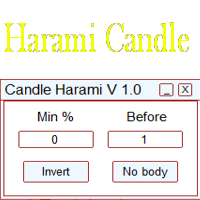
Это простой индикатор, показывающий формирование свечей харами. Входные параметры:
Min % - минимальный процент харами Before - количество свечей до сигнала Invert - инвертировать сигналы No Body - свечи без тела Length - настройка для отображения сигналов В индикаторе есть встроенный фильтр по количеству свечей до сигнала и минимальному проценту харами. Более подробно о настройках индикатора можно прочитать на моем сайте.

Buy and sell signals based on Larry Williams's exponential moving average strategy 9.3 for trend continuation.
Who is he? Larry Williams is an American stock and commodity trader, author of 11 books and creator of indicators such as the "Williams%R" and the "Ultimate Oscillator", with over 60 years of trading experience. Won the 1987 World Cup Championship of Futures Trading, turning $10,000 to over $1,100,000 in 12 months with real money. Ten years later, his daughter Michelle Williams won t

Buy and sell signals based on Larry Williams's exponential moving average strategy Setup 9.2 for trend continuation.
How does it work? The indicator activates the buy signal when a candle closes below the previous low while maintaining the 9 period EMA's upwards. For a sell signal, we need a candle closing above the previous high while maintaining the 9 period EMA's downwards.
How to use it? One way of using it, proposed by Larry Williams, is to enter a trade with a buy stop order one ti
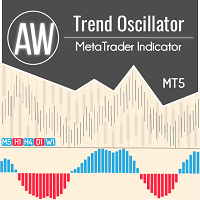
高度なフィルタリング システムを備えたトレンド オシレータ。それはトレンド、その弱体化と強化を決定します。マルチタイムフレームパネルが組み込まれています。 AW トレンド オシレーターは、任意の時間枠および任意のシンボル (通貨、指数、石油、金属、株式) で機能します。 MT4版→ こちら / 問題解決→ こちら 機能と利点:
高度なトレンド フィルタリング ワンクリックでインジケーターの感度を変更 簡単なセットアップ マルチタイムフレーム パネル パネルを移動および最小化する機能 任意のシンボルと任意の時間枠で機能します。 各種お知らせ 入力設定: . 指標の期間 - 指標の期間、値が大きいほど、指標シグナルの感度が低くなります。
. プッシュ通知を送信する - 新しいシグナルの通知をトレーダーの端末のモバイル バージョンに使用します。
. ポップアップ アラートの送信 - アラート時にサウンド通知を使用します。
. 電子メールの送信 - トレーダーの電子メールへのシグナルの出現に関する電子メールの送信を使用します。
. マルチタイムフレーム パネルを表示 -

TrendSentry is a trend following EA, featuring key pre-checks to opening a trade such as: - Triple level exponential moving average trend validation - MACD indicator trend confirmation - Trend reversal trade opening option
Upcoming features: - Martingale - Adjustable risk factor - Money management code Disclaimer: - after adding the upcoming features, the price might increase to meet development costs
EA imput parameters & use instructions: double volume double take_profit double stop_los

This EA works on the basis of channels formed by price. It trades from the boundaries of these channels (for example, when the price breaks through the border of the channel, or when it touches and comes back). It can also display the lines and channels through which it trades. They are built on the highs and lows of prices. The EA has customizable parameters for trading on multiple channels and uses some indicators to improve trading (for example, Stochastic or ADX). It also has parameters for

非インジケーターエキスパートアドバイザーは、インジケーター、注文グリッド、マーチンゲールを使用しません。 1日あたりの取引数は厳しく制限でき、一度に1つの注文のみが市場に出回ることができます。取引はストップロスによって保護されており、リアルまたはバーチャル(ブローカーから隠されている)のいずれかです。穏やかな市場で、アジアのセッション中に動作します。滑りや広がりの拡大に対する保護機能が組み込まれています。月曜日から金曜日に取引を転送せず、金曜日に取引を自動的に閉じる機能があります。
戦略は価格パターンを使用します-これは短期トレンドの方向を決定するための普遍的な方法です。便利なマネーマネジメント、Nバランスごとの固定ロットがあります。チャートには貿易統計が表示され、設定と最適化が簡単です。
デフォルトの作業時間枠はM5、EURUSD記号です。次のペアがアドバイザーに適しています:GBPUSD、USDCAD、EURUSD、USDJPY、USDCHF、AUDUSD、NZDUSD .. ..
オプション:
START_HOUR、START_MINUTES-取引開始の
MetaTraderマーケットは、開発者がトレーディングアプリを販売するシンプルで便利なサイトです。
プロダクトを投稿するのをお手伝いし、マーケットのためにプロダクト記載を準備する方法を説明します。マーケットのすべてのアプリは暗号化によって守られ、購入者のコンピュータでしか動作しません。違法なコピーは不可能です。
取引の機会を逃しています。
- 無料取引アプリ
- 8千を超えるシグナルをコピー
- 金融ニュースで金融マーケットを探索
新規登録
ログイン