YouTubeにあるマーケットチュートリアルビデオをご覧ください
ロボットや指標を購入する
仮想ホスティングで
EAを実行
EAを実行
ロボットや指標を購入前にテストする
マーケットで収入を得る
販売のためにプロダクトをプレゼンテーションする方法
MetaTrader 5のためのエキスパートアドバイザーとインディケータ - 113

The RealCryptoLevels indicator by downloading the order book of crypt exchanges with maximum depth shows horizontal volumes of popular crypto currencies on the chart, so you can see not only the volumes, but also the levels and them strength (see screenshots), which is very important for successful trading in all strategies from scalping to medium-term trading, because you can see the preferences of buyers and sellers at the moment and their mood for the future. The indicator pulls volume data
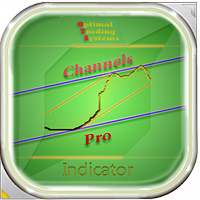
This indicator determines the channels along which prices move on the trading history. There are many trading strategies that rely on channel trading on a channel breakout. This indicator can draw price channels by reading information from several timeframes at once (from the current, from the second and third). You can customize the color and thickness of the lines for each timeframe. Also, you can set a different distance between highs and lows to draw channels or lines. There is also a simple

Las Bandas de Bollinger se encuentran entre los indicadores más utilizados en el análisis técnico, su autor es el estadounidense John Bollinger, analista financiero y gran colaborador en el área. John comenzó a desarrollar esta técnica en la década de 1980 y en 2001 publicó su libro Bollinger on Bollinger Bands.
Las bandas de Bollinger son muy útiles para indicar niveles de precios en los que una acción puede haberse apreciado o devaluado demasiado, además de indicar signos de máximos y fon

The Keltner Channels are powerful tools of technical analysis made specifically to take advantage of the opportunities created by price volatility. The indicator was originally developed by the American Chester W. Keltner, in the 1960s, and is widely used, especially in the American market.
However, despite the high usability in the market, the Keltner Channel suffers from a problem of having only 2 channels, which makes it very difficult to know the right time to enter or leave a position. S

BTFXピボットポイントは、毎日のサポートレベルとレジスタンスレベルを計算するインジケーターです。 この指標を使用することにより、ピボットレベルは目標とする明確な目標を示します。 抵抗レベルは、銀色のピボット線の上に紫色で表示されます。 サポートレベルはオレンジ色で表示され、銀色のピボットラインの下にあります。 このインジケーターは、BTFX夜明けインジケーターと一緒に使用すると非常にうまく機能します。 これらの指標の詳細については、添付のYouTubeビデオをご覧ください。 その他のお問い合わせは、メールまたはお電話にてお問い合わせください。 support@besttradesfx.co.uk 01827 842 418
Best Trades Fxによって作成された夜明けインジケーターは、ロンドン市場のオープン中にブレイクアウトに気付くようにゾーンをマークします。 ゾーンは標準でGMT + 2に設定されています。これをプラットフォームで有効にするには、ブローカーサーバーに応じて、午前12時GMTと一致する開始時間と午前7時GMTと一致する終了時間を選択する必要があります。 このインジケーターは、すべてのシンボルで使用できます。 このインジケーターの詳細については、Youtubeのビデオをご覧ください。 これとBTFXピボットポイントインジケーターは完璧に機能します。 サポートゾーンとレジスタンスゾーンがチャートに自動的にプロットされるため、分析を行う必要がないためです。 指標に関するご質問は、メールまたは電話でお問い合わせください。 support@besttradesfx.co.uk 01827 842 418 www.besttradesfx.co.uk

Provide ideas for trend trading.
Automatic calculation and generation of trend channels.
The channel line, also known as the pipeline line, is to draw a straight line parallel to the trend line in the opposite direction of the trend line, and the straight line crosses the highest or lowest price of the recent period. These two lines run the price in the middle and have obvious pipe or channel shapes. Necessary for traders: tools and indicators Waves automatically calculate indicators, chann
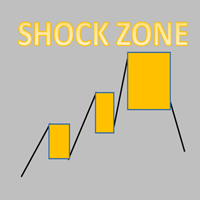
Every trading shock range is a point of gaining momentum!
The stop loss is generally the height of the shock zone.
Take profit depends on personal preference and market position. Generally at least double the height of the shock zone. Being in a good market position, it can have a profit-loss ratio of 5-10
Necessary for traders: tools and indicators Waves automatically calculate indicators, channel trend trading Perfect trend-wave automatic calculation channel calculation , MT4 Perfect

In the battle of Kursk every time a Russian tank fell, another appeared to take its place. This system is replenishing the tickets one after another until the market battle is beaten. The system distributes its trade in the key points of the market, in those places where the market gets stuck and it is easier to start the counterattack. So the system first chooses the battle site. Once started, it places as many troops in the rear as necessary to beat the market. No matter how hard the battle is

Volume Analysis Trader looks at volume using a fixed average of volume. This averaging helps spot when volume is rising or declining. Also I have added volume spikes which are when volume suddenly is above the average. These help spot market reversals.
This will hep a trader look for the following in their trading:
Rising volume during a rally shows trend is strong. Falling volume on a rally shows trend is weakening. As a rule of thumb on daily charts if current volume is higher than yester

In Front of the Wall It is a trading system based on the detection of a resistance point (WALL).
Once detected, the pullback is operated with a virtual trailing.
If the price breaks the wall, a recovery algorithm is started.
In this algorithm you can select if it is produced with a constant lot or it is increased throughout the algorithm. You can download the demo and test it yourself. Very stable growth curve as result of smart averaging techniques.
"Safety first" approach in developme

This indicator significantly expands the capabilities of the usual ZigZag due to the addition of parabolic channels at the earliest stage of their origin. Download the demo version and test it in the tester. All graphics in the tester are working. But the ZigZag algorithm is special here, because it is implemented on a unique author's ultrafast loop-less algorithm for calculating parabolic regression and calculating its standard deviation. The features of this ZigZag are: Fast calculation, rega
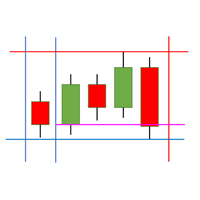
The SessionLines indicator for MT5 shows up the most important time intervalls and price levels in the US- Indices .
The following times get marked: Opening Time US Futures, Opening Time US Kassas, Closing Time US Kassas, Spezial Times,
The following price levels get marked: Daily High/Low, Previous Daily High/Low, Weekly High/Low, Opening and Cloth Levels of Futures Daily (inkl. Previous Day).
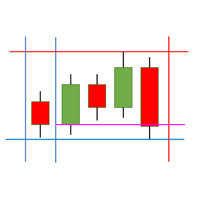
The SessionLines indicator for MT5 shows up the most important time intervalls and price levels in the DAX-Index. The following times get marked: Opening Time DAX Future, Opening Time DAX Kassa, Closing Time DAX Kassa, Closing Time DAX Future, Opening Time US Index Futures, Opening Time US Kassa Markets, Spezial Times, The following price levels get marked: Daily High/Low, Previous Daily High/Low, Weekly High/Low, Opening and Cloth Levels of Future and Kassa Daily (inkl. Previous Day).
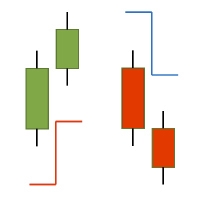
The ATR-StopLoss-Line indicator for MT5 calculates a stoploss line by the Average-True-Range (ATR) - Value of the particular candle. As point of reference you can choose the High/Low or Close of the particular candle. The indicator is suitable for scalping and intraday trading. The indicator does not redraw (recalculate). Signals are generated strictly on the "Close of the bar". It can be used as a standalone tool or together with other indicators. Alerts on Colorchanges are activatable.

TClusterSearch - индикатор для поиска кластеров согласно заданным критериям. Для работы индикатора требуются реальные биржевые обьемы. Основная функциональность
Поиск и визуализация кластеров с обьемом, задаваемым фильтрами (до трех). Для каждого фильтра можно задать свой цвет. Поиск и визуализация кластеров с дельтой большей значения задаваемым фильтром Поиск и визуализация кластеров по бид/аск согласно фильтру Возможность фильтровать кластера в зависимотсти от его положения относительно б

Macd Point, look for the turning points of the MACD to beat the market.
With this system we detect when we have to return the ball and detect that market turn to win the market game.
It is a system that uses the MACD to build around a scalping system.
The system has a stoplost of all its operations and a virtual trailing to beat the market.
This system is suitable for small accounts and can be used with only $ 10 0 .
You can download the demo and test it yourself.
Very stable g

Breakouts Strategy EA is a Secure Automated Software for Generation of Daily Profits for Forex Market. Safe strategy! The architecture is a Fully Automatic Autonomous Robot Expert capable of independently analyzing the market and making trading decisions.
The Trading system is Multi-currency and is able to trade on H1 charts: EURUSD, GBPUSD, USDJPY, SPX500, DAX30, GOLD NOT Martingale! NOT GRID, Averaging and other dangerous strategies are NOT used! Recommend ECN broker

Closes a losing position. Due to the previous continuous, profitable series. SymbolsWork: Currency instruments (pairs) for the EA to work with. There may be variations when setting a pair. If set simply as EURUSD , GBPUSD: or AUDUSD:ALL , the EA opens both buy and sell orders. If a specific order type is set after a colon USDJPY:BUY , then the EA opens only buy orders and in case of eurjpy:sell , it performs only sell orders. The pairs are separated by commas. For example, the following entry "E

Money Printer EA is an Expert Advisor designed specifically for trading Gold and Forex.
It good to combo with Buy Sell Signals to follow Trend and Sellect Buy Only/Sell Only for EA work Semi-Automatic. Recommend ECN broker with LOW SPREAD: IC Market , Exness, NordFX , FXPRIMUS , Alpari , FXTM
First, before attach EA to chart, you need add http://calendar.fxstreet.com/ in the list of allowed url in the tab ' Expert Advisors '
Tool —> Option —> Expert Advisors —> Allow We

Trading the market is as tough as climbing the Tourmalet alone.
To get it up, the help of the group is better.
This ea helps you operate protected from the wind.
Allowing you to overcome any challenge more easily.
This system is suitable for small accounts and can be used with only $ 10 0 .
You can download the demo and test it yourself.
Very stable growth curve as result of smart averaging techniques.
"Safety first" approach in development. Stress-tests on historical data f

The VTC Volatility indicator was written to support a Brazilian stock market strategy in the WDO (USDBRL), but it can be adapted to other strategies and markets.
In the new indicator update, it is now allowed to choose up to 4 levels to determine the range, and thus be more versatile.
The Brazilian stock exchange (B3) has the VTC which is a "Structured Exchange Rate Volatility Transaction" (more information on the B3 website).
At around 10:00 am, the VTC "Call" comes out and Brazilian

The Initial Balance (Initial Balance / Initial Balance) is a concept related to the study of volume (to learn more, study about Market Profile and Auction Market Theory. You can find some videos in English when searching for "Initial Balance Market Profile").
The IB defines a range in which prices were negotiated in the first hour of trading.The amplitude of the range is important and the break in the range defined by the Initial Balance may have occurred due to the movement of several players
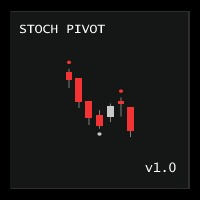
Stochastic Pivot draws a point on the chart at Stochastic overbought or oversold. During overbought periods, this indicator will draw the pivot point at the high of the highest candle and at the low of the lowest candle during oversold periods. NB : All pivots are updated 'on tick' and 'on any chart event' immediately Settings Name Description Upper Limit Set Stochastic Overbought Level
Lower Limit
Set Stochastic Oversold Level %KPeriod Set Stochastic K Period %DPeriod Set Stochastic D Per

O indicador precisa do times and trades (time and salles) para seu correto funcionamento.
O Volume é composto por ordens à mercado compradoras e vendedoras que agrediram o book de ofertas, o Delta é a diferença das ordens a mercado compradoras e vendedoras.
O CoioteDeltaCandle monitora o time and trades e à partir dos dados de agressão forma candles temporais em 4 formatos diferentes, possível selecionar à partir de configurações.
São elas:
Modo com acumulação.
Modo com pavio.
Modo

YOU WANT TO WIN THE DUEL.
Look the market in the eye, feel the trigger on your finger. Take a deep breath and shoot before anyone else.
This system allows you to detect the right moment to attack the market.
The whistles are already sounding in the air. Dare to win the duel at the market.
This system is suitable for small accounts and can be used with only $ 10 0 .
You can download the demo and test it yourself.
Very stable growth curve as result of smart averaging techniques.

Precise trend following strategies
- Forex Miner EA is based on Strong current Trend.
- Built with a mixture of many Trending indicators to get best Results on daily basis.
- As statistics say 95% Traders in this market, unfortunately, lose their hard earned money and the key factor is bad money management taking small profits and huge losses Our Robot is designed to follow the strong current trend so risk is at minimum side and Profits coming out are Big Green Pips.
Highly Adva
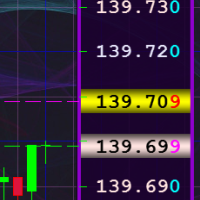
Индикатор предназначен для замены стандартной вертикальной ценовой шкалы, расположенной с правой стороны в окне графика клиентского терминала, на более удобную ценовую шкалу с возможностью детальной настройки параметров отображения этой шкалы. Кроме этого, индикатор позволяет делать фоновую заливку окна графика любым изображением по желанию пользователя и двухцветную сетку с элементами её тонкой настройки. В первую очередь, индикатор будет полезен трейдерам, обладающим не самым лучшим зрением,
ImpliedVolatility MT5
"ImpliedVolatility" is an EA developed to calculate the implied volatility of a stock option. As it is not observable, it is calculated by iteration using the Black & Scholes model. The implied volatility is not the same as historical volatility, also known as realized volatility or statistical volatility. The historical volatility figure will measure past market changes and their actual results.It does not predict the direction in which the price change will proceed. For

Monitoring Signal: https://www.mql5.com/en/signals/947124 NEW VERSION 4.0 - Added New Logic and New Parameter to avoid trading in Ranging Condition Wave Pro EA is based on principle “Trend is your friend”. A trend following EA and based on price action, does not use any indicator and less settings. Wave EA search the market structure and pattern for an entry and follow the price movement. Every trade is protected by Stop Loss in case the market suddenly changes its direction. The EA does not u

The Haos oscillator coded for the MT5!
This oscillator allows to verify overbought / oversold regions in two periods (14 and 96, for example), making it possible to anticipate a reversal. Possibility to activate an audible alert when it reaches a defined level. Possibility to choose the alert sound by placing a .wav song in each asset or timeframe. (save a .wav file to the MQL5 \ Files folder) Possibility to activate / deactivate histogram and levels to make the screen cleaner. Customizable co

This robot enters the market at the opening of London Stock Exchange (LSE). It is based on short-term reversal patterns which use the tendency of FX prices to move toward their average value during the LSE session . The EA does not use indicators, grid, martingale, arbitrage. The trading system is suitable for both experienced traders and beginners. The EA includes protection against high spreads, and allows you to trade with a fixed or automatic lot size. Minimum account balance: $1
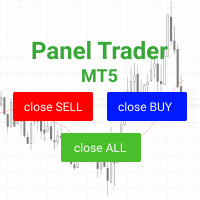
Trading panel for fast and convenient trading. The panel allows you to quickly open and close orders. Separate closing of orders for Sell and Buy positions. It is also possible to close all orders completely.
The trading panel displays information about profit, total volume and number of orders for Sell and Buy positions.
Sometimes some positions may not be closed due to market volatility. In this case, click close the position again.

このEAは、mt5でderiv.comからのレンジブレイクインデックスを取引します
それはすべてのスパイクの後に市場をスカルプし、ストップロスで各注文を取り、利益レベルを取ります。また、損失が発生した場合のオプションのスマート自動ロットサイズ調整も備えています。
楽器
deriv.comのRangeBreak100およびRangeBreak200インデックス
時間枠
m1(1分の時間枠)をお勧めします
設定
ポイント単位のストップロス:ポイント単位のストップロスのサイズ。デフォルト= 1000
テイクプロフィットメソッド:テイクプロフィットサイズを決定する方法。デフォルト=両方
ポイントでの固定テイク利益:ポイントでの固定テイク利益のサイズ。デフォルト= 100
インデックス200の2倍の固定ストップレベル:EAは2倍の固定ストップロスを使用し、インデックス200の利益を得る必要があります。デフォルト= true
テイクプロフィットとしてのブレーク距離のパーセンテージ:EAは、テイクプロフィットとして最後のスパイクの

When you are on the way, the GPS detects wrong points on your way, at that moment you decide if you pay attention to the GPS and turn around if possible. Or continue on your way. This system detects the points where the market has to continue in the trend or initiate the return to the range. It allows the trader to choose the appropriate direction. And as the market moves away from our point, the intensity of our decision increases.
This system is suitable for small accounts and can be used wi

The DYJ CandleShape contains 80 candlestick Patterns, such as MORNING STAR, DOJI STAR, HARAMI CROSS,INVERT HAMMER,ENGULFING..... candlestick is a valid form of market technical analysis. The recommended short stoploss is near the highest price of the first three to five candles The recommended long stoploss is near the lowest price of the first three to five candles Input
InpPeriodSMA =10 -- Period of averaging InpAlert =true -- Enable. alert InpCountBars =

The program is used to calculate the lot to be used given a certain amount of financial risk. It allows the creation of lines that will mark the entry and stop prices. From these two values the lot is calculated and shown in a small panel. The program also allows choosing the risk-return ratio and creating a horizontal line marking the target. The system does not create orders. These must be created manually by the user.

Quickly Helper is a tool to help us deal with multiple orders quickly. It has five function keys. They are: The "清空" button to quickly level out all orders; Quick flat out the long position "平多单" button; Quick flat out the short position "平空单" button; The "买多" button to quickly buy at the current price; The "买空" button to sell quickly at the current price; It has seven display information items. They are: bp: the total income of multiple orders; ( profit of buy/long position ) avgb: avera

This EA Connects Trading-Systems or Terminals on a Windows Server (VPS). You can also use it as a Trade Copier Local or Remote. Fast and stable Solution with 10ms Reaction Time. Make sure you have one of this: It works on VPS which allows to Run it as a Webserver (fixed IP Address and open Port 80 for Incoming Connections). It works on your own Datacenter / Computer with fixed IP or DNS.
Installation Download and Install Visual Studio 2019 on your Windows Server. Choose "ASP.NET and web Deve

If you want to try the Demo Version, please use this one: https://www.mql5.com/en/market/product/58262
Features: easy positioning of stoploss and takeprofit with horizontal Assistance-lines
automatic Volume calculation fixed risk, set by the trader Closing of all trades of one type, with the click of one button (long or short, for this symbol) Creation of pending orders with one click Direct feedback through responsive buttons
Made for all your needs: Forex Indices Crypto Gold, Silver, Pla

About the VWAP Custom Date This indicator can be calculated from a specified date and hour, being not only a Day Trading indicator but also Swing Trading indicator.
What is the VWAP indicator? The volume weighted average price (VWAP) is a trading benchmark used by traders that gives the average price a security has traded at throughout the day, based on both volume and price. It is important because it provides traders with insight into both the trend and value of a security. Large institutio

コアラ・プライスアクション・スキャナー - プライスアクションの力を解き放つ 紹介: 新しいコアラ・プライスアクション・スキャナーを発見してください - 多機能で、多通貨、複数の時間フレームを検出し、直感的なスキャナーテーブルに表示するツール。 要約: このインディケーターは通常を超えており、ユーザーに対して複数の通貨と時間フレームで重要なプライスアクションパターンを識別する能力を提供します。 特徴: 吸収パターン(Engulf Pattern) ピンバーパターン(PinBar Pattern) ドージパターン(Doji Pattern) カスタマイズ可能な設定: 吸収パターン: ローソク足2の最小ボディサイズ:2番目の閉じられたローソク足の最小のボディサイズ(2番目の閉じられたローソク足) ローソク足1の最小ボディサイズ:最新の閉じられたローソク足の最小のボディサイズ ピンバーパターン: 最大ボディの割合:%単位でピンバーの最大ボディの割合を調整します。 ドージパターン: 最大ボディのサイズ:このパラメータを使用して、ユーザーは最大で10ポイントのサイズでパターンを見たい場合にボディ

Com este Expert Advisor tenha a possibilidade de fechar todas as posições de forma automatizada.
Tenha em mãos o recurso de fechar as posições e ordens pendentes por ações, Dólar, Índice ou TODOS estes juntos, algo inovador no mercado.
Ideal para quem quer uma segunda camada de segurança para suas operações automatizadas ou ainda que o próprio robô feche suas operações manuais em um horário programado.
Promoção de 30 dólares para a três primeiras assinatura, posteriormente será cobrado 50

Indicator LTS for MT5 (Level + Trends + Speed)
The LTS indicator was specially created for quick analysis of consolidations on the chart, which greatly facilitates decision-making when trading. LTS marks resistance and gives information about the forces affecting it, as well as the current speed and average travel. The indicator is easily customizable and can analyze any timeframe. LTS uses a unique trend analysis algorithm based on 4 parameters from global to local.

CoioteWeisWave é uma releitura do indicador de VSA WeisWave com indicação do estouro de fractal, método de analise dos TradersPiolhos e implementado originalmente pelo Trader Dario Junqueira. A versão Coiote foi reprojetada para indicação da volatilidade do volume no fractal. A coloração adicional (azul e magenta) dão sinais de entrada, saída e pontos de gerenciamento, podendo ser usados também como suporte e resistência.
Existem 3 modos de exibição do weis wave, por volume total, por range e p

There are times in life when your future is decided by heads or tails.
This system detects these moments and allows you to choose if you want to play it heads or tails.
Depending on what you choose, the system will start the algorithm in the direction that you have decided.
Choose whether you want heads or tails.
This system is suitable for small accounts and can be used with only $ 10 00 .
You can download the demo and test it yourself.
Very stable growth curve as result of

The moving average applied to the price chart is one of the most used technical analysis methods. There are several ways to use averages, among them, through the analysis of crossings.
The method consists of using two moving averages, one fast period and one slow period. The concept is very simple, when there is a crossing of the fast moving average upwards it indicates a high market trend and when the fast moving average crosses downwards it indicates a low trend in the market, combining t

O indicador CoioteAverageSpreed é uma releitura do indicador AverageSpreed. Ele mostra a relação de esforço x resultado entre o volume e a volatilidade do preço. Com o volume heatmap é possível identificar visualmente se o preço foi deslocado com uma quantidade maior de volume e se o deslocamento do preço apresentou maior resultado ou não. É possível identificar momentos de ignição e exaustão do movimento, além de injeções de fluxo para dar continuidade a um movimento.

The Dual Strategy bot uses a strategy based on classic and reliable Moving Average as well as the Relative Strength Index oscillator.
The Progressive Moving bot implements a classic strategy with the right approach to market analysis and market signal processing. This strategy will take advantage of the MA c trend indicator and the RSI indicator. The bot enters only by trend and only when the oscillator displays the origin of the movement! It is precisely the inception and not its end phase.
This Expert Advisor uses additional filters to determine the trend. It protects orders with the help of locking. The robot uses martingale. This EA use pending orders. Sooner or later martingale can lose the deposit, it is recommended to control the trading of the EA while analyzing the market. The EA trades on any symbol. The minimum recommended deposit is $1000 (it is better to start with a cent account). The EA works on M1 timeframe. Telegram channel
Settings: https://drive.google.com/file/

THE LAST RING OF SATURN is not an EA is your EA. Do you want to accompany THE LAST RING OF SATURN to the LAST level of neural trading? You just have to download it and try it yourself. Also testing it is free. Are you not going to try them?
THE LAST RING OF SATURN it is a Secure Automated Software for trade Forex market and indices. The architecture is a Fully Automatic Autonomous Robot Expert capable of independently analyzing the market and making trading decisions
THE L

The Progressive Moving bot uses a strategy based on classic and reliable Moving Average. A significant advantage of MA is trading in the direction of the current trend. This can be seen on the terminal screen after breaking the Moving Average line. Moving average trading is understandable even for a beginner. One of the most common methods is crossing two or more moving averages. In one indicator, a shorter period is configured, in the other, a longer one. You have always wanted a reliable stra

手動取引用に設計された取引アシスタント。リスクを計算して管理し、取引を損益分岐点に転送し、ポジションにトレーリングストップを伴うのに役立ちます。セットアップと使用が簡単です。取引ロットの計算、ストップロスの計算、利益レベルの取得に使用できます。
通貨ペア、CFD、株式、インデックス、先物、暗号通貨で動作します 注文前にボリューム、潜在的な損失と利益を表示します 保留中の注文の有効期限を設定する機能 取引を損益分岐点に転送する トレーリングストップトラッキング。
MT4バージョン-https:// www.mql5.com/ru/market/product/57901
オプション:
RISK_PER_TRADE-取引ごとのリスク。= 0の場合、使用されません。 CALC_MODE-取引ごとのリスク、残高のパーセンテージ、または固定金額を計算するモード。 INITIAL_LOT-RISK_PER_TRADE = 0の場合にロットを取引します。 INITIAL_STOPLOSS、INITIAL_TAKEPROFIT-初期ストップロスとテイクプロフィット。 LIFE_TIM

Description
Volume Magic is an indicator that shows the value of the relative volume in conjunction with the direction of the current trend. The ratio of the current volume relative to the average volume for a certain period is displayed in the lower window as an oscillator. The direction of the current trend is displayed as two-color trend lines.
How to use?
First, use two-color trend lines to determine the direction of the current trend. Then look for areas of low volume and open positi

Индикатор MT5 строит классические трендовые линии по фракталам. Он предназначен для быстрого анализа финансовых инструментов. Работает на любых периодах и любых инструментах. Индикатор настроен на оптимальную работу на каждом периоде графика. Не нуждается в дополнительных настройках. Для лучшего восприятия линии окрашены в разные цвета. Дополнительно: рисует круглые уровни кратные 100 отсчитывает время до окончания текущего периода. В меню свойства индикатора можно: ShowRoundLevels=true/false
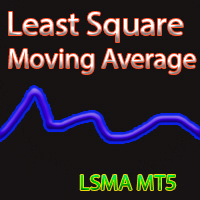
Least Square MA Description: The Least Square Moving Average indicator allows you to assess the direction of the market movement and its possible reversals. The indicator is a line that is displayed in the price window. Input parameters: LSMA_Period - the period for calculating the moving average using the least squares method; Prediction - the number of candles used to construct the predicted moving average using the least squares method, provided that its rate (falling or growing remains); Dis

The PRO Channel indicator implements the channel as well as signals for entry at the channel boundaries. Channel trading is one of the most popular Forex strategies, its simplicity allows even beginners to use this trading option. PRO Channel is a classic indicator of the family of channel indicators, the use of which allows the trader to react in time to the price going beyond the boundaries of the channel set for it. This corridor is built on the basis of the analysis of several candles, star

- I imagine that right now you're feeling a bit like Alice, tumbling down the rabbit hole ? Hm?
You take the BLUE PILL , the story ends, you wake up in your bed and believe whatever you want to believe.
You take the R ED PILL , you stay in Wonderland, and I show you how deep the rabbit hole goes... Remember, all I'm offering is the truth, nothing more.
Follow me. You can download the demo and test it yourself.
Very stable growth curve as result of smart averaging techniques.

This EA is recommended for trading BTC/USD timeframes M15 or M5. It is based on the strategy of "waiting out", the market entry (and exit) points are determined on the basis of correlation of a number of indicators, included into EA, also used market news pausing. The trading volume for opening a position depends on results of previous trades. It is possible to limit the amount of risk (the AutoMM parameter). It also has advanced features for managing news releases. Parameters StopAfterNews - a

SwS Scalping whit Stocastic: It is a scalping system that uses the stocastic signal as a reference to enter the market.
It is a very aggressive system so it needs volatile pairs with little spread.
The system detects turnin g points and operates small market corrections.
All orders have a stoploss. And it has a virtual trailing .
This system is suitable for small accounts and can be used with only $ 10 0 .
You can download the demo and test it yourself.
Very stable growth curv

The algorithm of the Sup Trend indicator is to determine the dominant direction of price movement by algorithmic analysis of price values for a certain period of time. When calculating this indicator, logorithmic gains are first calculated at the closing price, which allows you to filter out the trend, seasonality and other inclusions that spoil the picture of volatility, then the standard deviation is plotted based on the data obtained. The algorithm takes into account the measurement of pri

IntelRabbit MT5 Expert Advisor is a fully automated forex trading robot designed using our reversal trading strategies that we have developed over the years. These strategies find the highest probability entries and set TakeProfit and StopLoss accordingly. IntelRabbit MT5 EA works on any pair and timeframe. The default settings are for GBPUSD H1 timeframe. IntelRabbit MT5 EA settings and recommended ranges 1. Strategy Settings - Reversal Range: range of bars to calculate the reversal area. Th

The Volume Heatmap indicator visually shows the INTENSITY of the volume taking into account the concept of standard deviation. Purpose of the Indicator: High volumes are common where there is a strong consensus that prices will increase. An increase in volume often occurs at the beginning of a new upward trend in the price of an asset. Some technical analysts do not rely on trend confirmations without a significant increase in volume. Low volumes usually occur when an asset is heading for a down

この戦略は、大規模な買い手と売り手の価格が集中している領域を検索することに基づいています。このようなゾーンでは、通常、短期的な傾向が生成されます。これはグリッドエキスパートアドバイザーですが、不採算注文をオーバーラップする機能のおかげで、大きなドローダウンに耐え、アカウントを回復することができます。揮発性ペアと金(XAUUSD、GBPUSD、USDCAD、EURUSD、USDJPY、USDCHF、AUDUSD、NZDUSD ...)でうまく機能します。金曜日の注文のクローズや、エクイティの目標(利益または損失)に達したときなど、多くの便利な機能があります。グラフには、利益に関する情報が表示されます。
MT4バージョン https://www.mql5.com/en/market/product/57742
オプション: TIMEFRAME-シグナルを検索するための時間枠。 COUNT_BARS-バーの数; PRICE_RANGE-価格変動範囲; COUNT_BARS_IN_RANGE-範囲内のバーの数。 ENTRY_DISTANCE-最初の注文で入力する価格混雑ゾーン

Escape the black Hole, is a system that detects the range that is the black hole that keeps your money.
Once the limit of that range, which would be the event horizon, has been detected, an attack system at the price that operates in favor of the escape of that black hole begins.
Therefore, it is a system that operates in favor of the trend at the moment in which it is confirmed that the trend has exceeded the point of gravity that drags it into the fearsome price range that devours the tre

The Trend Active indicator is a signal indicator and has interesting properties. It should be taken into account that this indicator reflects extremes and should be used as an additional one, and another instrument should be used for the entry point. The indicator can transmit all types of signals to the user: messages, E-mail and Push!
The goal that was pursued when it was created is to receive signals that will give less noise and respond faster to price changes. The indicator is a trend in

The Priority Argument indicator algorithm is based on standard indicators as well as its own mathematical calculations.
The indicator will help users determine the direction of the trend. It will also become an irreplaceable advisor for entering the market or for closing a position. This indicator is recommended for everyone, both beginners and professionals.
How to work: The implementation of the trend indicator is simple - in the form of lines of two colors. We buy when the indicator line

Using the New Topic indicator is very simple as the easiest way is to look at the chart and act according to the colored arrows.
The algorithm takes into account the measurement of prices, and this method also focuses on measuring each of the price fluctuations (H / C, H / O, LC, LO) - which gives more detailed information but also more averaged. Such a calculation option takes into account intraday price fluctuations and focuses on measuring the "candlestick" share in the trend.
When cal

プロのグリッドアドバイザーがRSI(相対力指数)指標に取り組んでいます。不採算注文をオーバーラップさせることにより、アカウントのドローダウンを減らす機能があります。グラフには、利益に関する情報が表示されます。
MT4バージョン https://www.mql5.com/en/market/product/56994
オプション: RSI_PERIOD-相対力指数を計算するための期間。 UP_LEVEL-上限; DN_LEVEL-下限; RSI_TIMEFRAME-計算の時間枠。 START_LOT-初期ロット; LOT_MULTIPLIER-注文グリッドのロット乗数。 MAX_LOT-最大ロット; STEP_ORDERS-グリッドステップを注文します。 STEP_MULTIPLIER-次数ステップ乗算係数。=-1の場合、使用されません。 MAX_STEP-最大次数グリッドステップ。 OVERLAP_ORDERS-オーダーオーバーラップ機能を有効にするオーダー。 OVERLAP_PIPS-不採算注文を閉じるためのピップ単位の最小利益。 STOPLOSS、TAKEPR

Following a leader who sets the trend is easy.
The tricky part is knowing when you have to TURN AROUND . TURN AROUND is a system that detects the end of the trend and operates that point against the market. It is therefore a PULLBACK system. This system is suitable for small accounts and can be used with only $ 10 00 .
You can download the demo and test it yourself.
Very stable growth curve as result of smart averaging techniques.
"Safety first" approach in development. Stress-t
MetaTraderプラットフォームのためのアプリのストアであるMetaTraderアプリストアで自動売買ロボットを購入する方法をご覧ください。
MQL5.community支払いシステムでは、PayPalや銀行カードおよび人気の支払いシステムを通してトランザクションをすることができます。ご満足いただけるように購入前に自動売買ロボットをテストすることを強くお勧めします。
取引の機会を逃しています。
- 無料取引アプリ
- 8千を超えるシグナルをコピー
- 金融ニュースで金融マーケットを探索
新規登録
ログイン