YouTubeにあるマーケットチュートリアルビデオをご覧ください
ロボットや指標を購入する
仮想ホスティングで
EAを実行
EAを実行
ロボットや指標を購入前にテストする
マーケットで収入を得る
販売のためにプロダクトをプレゼンテーションする方法
MetaTrader 5のためのエキスパートアドバイザーとインディケータ - 112

このインジケータは、横ばいを検出し、検出された領域を色の付いた四角形で塗りつぶします。
このインディケータの主なアイデアは、価格がチャート上の特定の領域を埋 めたときにフラットを検出することです。
入力パラメータ
Color rectangle - 影を付ける矩形の色。
Bars in rectangle - 長方形内のバーの最小許容数。
Density in % - 平坦の密度。矩形の面積に対するパーセンテージで設定。 __________________________________________________________________ __________________________________________________________________
An indicator of patterns #5 and #6 ("Wedges, ascending, broadening" and "Wedges, descending, broadening") from Encyclopedia of Chart Patterns by Thomas N. Bulkowski.
Parameters: Alerts - show alert when an arrow appears Push - send a push notification when an arrow appears (requires configuration in the terminal) PeriodBars - indicator period ArrowType - a symbol from 1 to 17 ArrowVShift - vertical shift of arrows in pixels ShowLevels - show levels ColUp - color of arrow up СolDn - color

Automatic fibonacci with alerts is an indicator that automatically plots a fibonacci retracement based on the number of bars you select on the BarsToScan setting in the indicator. The fibonacci is automatically updated in real time as new highest and lowest values appear amongst the selected bars. You can select which level values to be displayed in the indicator settings. You can also select the color of the levels thus enabling the trader to be able to attach the indicator several times with d

Ferramenta derivada do DR Assistant, a versão Lite conta com recursos semelhantes, mas sendo mais específica em sua aplicação, destina-se exclusivamente ao uso para gestão de ordens abertas a partir de suas funções. Deste modo, quaisquer outras negociações ou posições abertas por outras ferramentas ou manuais serão ignoradas pelo Assitant Lite. Os parâmetros e configurações disponíveis, bem como suas principais funções são: - Take Profit e Stop Loss: duas opções de Steps, em pontos, para ambas a

This is MT5 version of ChristMyHedge . It should be referred to as ChristMyHedge-for-MT5.
Like its MT4 counterpart, the EA/signal runs on Daily (D1) time-frame on 12 pairs: GBPUSD, EURUSD, USDCHF, USDCAD, NZDUSD, USDJPY, AUDUSD, GBPEUR, EURJPY, CADJPY, AUDJPY and EURCHF concurrently, with a recommended minimum of 150USD equity per 0.01 lot size.
Default parameters may be OK, and it's best to run on VPS, if you do not have 24/5 Internet and electricity.
However, the newer version of Christ
If you are looking for a safe ea to start trading in index this is your ea
This ea performs a market entry that starts the algorithm at the time of day that the trader decides. We recommend it to be 1 min after the opening of the index.
It also allows you to say close the operation at the close of the session or keep the cycle open.
It only performs a daily cycle that starts at the scheduled time and remains alive until it exits for profit or session close.
This system is designed to

作業ロジック
ダウ戦略エキスパートアドバイザーは、「トレンド保持」のChalseDow理論に基づくエキスパートアドバイザーです。
エキスパートアドバイザーは選択されたTFを使用します。前のバーが上がっていた場合、それは買いを開き、前のろうそくの安値の後ろにストップを置くことを意味します(前のろうそくからのオフセットにフィルターを設定することが可能です)、次に、現在のろうそくが閉じた後、ストップロスは再び安値を超えて移動するため、足でノックアウトされなくなるまで取引は市場で保持されます。
中長期のトレンド商品の取引に最適です。取引を開始する前に、トレンドの存在について商品の独立した分析が必要です。 m1-MNからのすべての時間枠で、バーによるトレーリングポジションに最適です。
取引には、株式、通貨、金属、指数が適しています-一般的に言えば-中期的な傾向がある金融資産のほとんど。
推奨される時間枠はD1です。
ポジションは、前のバーの高値/安値を価格の方向に突破した後に開かれます。
ストップロスは、ローソク足の前のピークの後に設定されます。
トレーディング
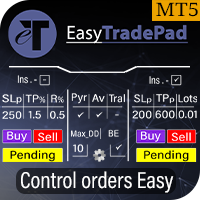
EasyTradePad は、手動/半自動取引用の取引パネルです。 ポジションと注文を処理し、ワンクリックで資金管理を計算します!
パネルは間違いなくあなたを助けます:
あなた自身が%または預金の通貨で指定した正確なリスクで取引を開始します ストップロスを損失なしに移動して利益を節約する 市場のボラティリティを平滑化することによって取引を平均化する 取引があなたの方向に進む場合は、トレンドに沿ってポジションを追加します さまざまなトレーリングストップ設定を使用して最大利益を絞ります すでに開いている取引のパラメータを変更する 収益性の高いポジションの部分的なクローズを実行する 主な機能: 注文の開始と終了 ポイント単位のSLとTPの計算 預金の%でのSLとTPの計算 $でのSLとTPの計算 ピラミッド 平均化 損益分岐点に転送 リスクに対する利益の比率の自動計算(比率) ポイントとローソク足の影によるトレーリングストップ ピラミッド
パネルは、取引が最初に指定されたTPに近づくと、追加の取引の段階的な開始を実行します。同時に、次の注文ごとに%リスク削減を設定できるため、新

パネルには、すべての初心者が処理できる最も直感的なインターフェイスがあります。
SLp列で-SLサイズをピップで指定する必要があります。値が灰色に変わり、同時にベイ/セルボタンも非アクティブになっている場合は、ブローカーによって設定される前に許可されていた値よりも小さいSL値を指定しています。
[TP%]列で、アカウント残高の%でTPを示します。設定では、この指標の計算内容に基づいて、資本、残高、または自由証拠金を選択できます。
R%列では、取引のリスク値を設定できます。
Insボタン。 -設定値ですぐに注文を開くことができます。無効になっている場合は、取引のパラメータをチャートに直接プリセットできます。 Pro Trading Panel - https://www.mql5.com/en/market/product/72256
上部の左上隅にあるマイナス記号をクリックすると、グラフのパネルを最小化できます。
パネル名の下にある+ボタンと-ボタンを調整することで、パネル自体のサイズを拡大または縮小することもできます。
保留中の注文を開いてBUへ

iPumpインジケーターは、3つのカテゴリーのインジケーターの利点を組み合わせた用途の広いインジケーターです。
複数のTFでの同時トレンド検出 抵抗とサポートのゾーンを定義する 買われ過ぎと売られ過ぎのゾーンの決定 インジケーター機能:
トレンドの定義 この機能は、現在の市場の方向性を客観的に評価し、主観を避けたいすべてのトレーダーに必要です。ほんの一瞬で、最も重要な時間枠でトレンドの方向を比較することができ、これは明確で直感的になります。
サポートとレジスタンスレベルの決定 iPumpインジケーターを使用すると、数秒以内に資産の潜在的な価格障壁を評価できます。
また、インジケーターは目の前にあるレベルのタイプを示します。
テストレベル(抵抗/サポート) 逆転レベル 弱いレベル テストされていないレベル 買われ過ぎと売られ過ぎのゾーンの決定 このタスクでは、インジケーターに遅延や再描画のないシグナルオシレーターがあり、アセットの現在の状態を示します。このデータに基づいて、次のことができます。
購入するのが面白くなる時期を正確に知る 資産を売却することが興味深い

あなたは小さなstoplossを持つEAをしたいですか? あなたはちょうど市場に出ているEAをしたいですか?
このEAは、dax(ドイツ指数)、またはDow Jonesのブレイクアウトに作用しています。 それは、市場が開いたときにのみ購入し、10分以下のウィンドウで購入しています。
この戦略(はい、それがあります2で使用することができます異なる戦略3異なるチャート)タイトなストップロスと多くの場合、数秒以内に到達するtakeprofitを持
戦略はよく証明されています。 私は良い結果を得て何年も手動でそれらを使用してきました。 設定ファイルは、私が使用する設定のコメントセクションの下に見つけることができます(あなたが時間をかけてより良い何かを見つけた場合は、TP
このEAの特徴 それだけで一日と戦略ごとに一つの貿易を取ります(時には貿易なし) すべての取引でTPとSLを使用します(SLとTPがタイトであるため、EAに組み込まれています) 買いと売りの逆指値注文の使用の可能性 ノー-マーチンゲール ヘッジなし 裁定なし 複数の取引はありません
プロモーション価格:$

作業ロジック この指標の重要性は、「燃料が機器に残っている」量を理解できるという事実にあります。状況を想像してみてください。あなたが半分放電したバッテリーを搭載した車に残した場合、平均して、この量のエネルギーは通常250 kmの車に十分であるため、必要に応じて700kmの距離を超えることはできません。そのため、商品ごとに一定の日次価格変動があり、統計的観察の結果、資産が1日あたり1 ATRを通過する時間の95%、2以上のATRを通過する時間の5%のみであることが明らかになりました。
例、毎日のATR EURUSD = 682ピップ。トレードに参加します。たとえば、TPが500ピップのレベルのブレイクアウトの場合、正しいTPサイズを設定したように見えますが、資産がすでに1日のATRの90%を通過していることを考慮していません。取引が開始された時間、したがって、楽器にはTPを受け取るのに十分なエネルギーがない可能性があります。楽器の残りのチャージが10%しかない場合は、TPを調整するか、取引にはまったく参加しません。
パワーリザーブインジケーターは、計測器が慣性を使い果たした量を
戦略ロジック Pump and Dump for mt5 Expert Advisorは、トレーダーがトレーダーのために作成した完全に自動化されたトレーディングアドバイザーです。 戦略は「より安く購入し、より高価に販売する」です。価格が大幅に上昇/下降した後、注文が開始されます。 ポンプアンドダンプ戦略の基本的な意味は、価格が下がると資産を安く購入し、価格が上がると資産を高く売ることです。 市場での急激な価格変動の後、反対方向に大幅な価格ロールバックが発生し、いわゆる「ヘアピン」が描画され、EAが力強い成長または価格の下落の瞬間を捉え、に基づいて市場に参入することにお気づきかもしれません。これらの信号。ビデオとスクリーンショットで詳しく説明します。
アドバイザの戦略は、iPumpインジケーターを使用した%価格変動の分析に基づいて資産の買われ過ぎ/売られ過ぎゾーンを識別するアルゴリズムに基づいています。インジケーターは資産の買われ過ぎ/売られ過ぎレベルを評価し、これに基づいてアドバイザーは取引された商品の最適な売買ゾーン、そして市場に参入します。
利点 アカウントドローダウン
このスクリーナーを使用すると、選択した期間(時間枠)内に通常よりも買われ過ぎ(成長率)または売られ過ぎ(減少率)の資産を特定できます。 市場は法律によって支配されており、より安く購入し、より高価に販売しますが、自動スキャナーがないと、たとえば今週内に、通常よりも買われ過ぎまたは売られ過ぎの通貨/株を特定することは非常に困難です。現在の時間、または月。 数十または数百の機器が存在する可能性があり、すべてを手動で分析する時間がないことが物理的に可能な場合もあります。これらの問題は、Screenerを使用して簡単に解決できます。 スクリーナーができること スキャナーはどのTFでも使用できます スキャナーは、通貨、株式、暗号通貨、商品、インデックス、およびその他の機器で動作します 資産を特定するロジックは、市場の基本法則に基づいているため、普遍的です。 スクリーナーの助けを借りて、あなたはさまざまな戦略に従って作業することができます、最も一般的なものの1つはポンプとダンプです 各商品の平均値を明らかにする-SoftimoTradeScreenerは、選択したTFの資産の買われ過ぎと売られ過ぎ

ユーティリティMTI(メイン取引情報)-トレーダーの基本的な取引情報を表示します。
スプレッドの平均および現在のサイズ ショートポジションとロングポジションのスワップサイズ 1つの取引ロットに対して1ピップのコスト ストップレベルサイズ(保留中の注文を出すための最小距離) 現在の(赤)終了までの時間と次の(灰色)取引セッションの開始までの時間 現在の取引セッションが終了するまでの時間は赤で表示され、次のセッションが開始されるまでの時間は灰色で表示されます。色は、インジケーターのプロパティで個別に調整できます。 Recommended Robot Scalper - https://www.mql5.com/en/market/product/77108
表示は次の方法で実行されます。
欧州貿易セッション(EU旗) アメリカの貿易セッション(米国旗) パシフィックトレーディング(オーストラリア国旗) アジア貿易セッション(日の丸) 取引セッションの終了と変更の時間を知ることは重要です。なぜならトレーディングセッションの終わりまでに、多くのトレーダーはポジションを修正しま

セミオートマーティンシステム
導入
このツールは半自動マーティン取引に使用され、パネルをクリックして注文すると、EAがポジションを管理します トランザクションの方向を決定し、残りはEA管理に任せてください 自動マーティン、設定されたグリッドに従って倉庫を追加し、この機能を無効にすることもできます ワンクリック清算 1つのキーロック機能 時間制御 警告音プロンプト
特性
トレーディングチャート:任意 取引可能な通貨:任意 自動テイクプロフィットクロージング バックテストに使用できます クリアパネルディスプレイ
パラメータ
主な設定パラメータ
LogLevel = LOG_LEVEL_INFO; //ログの書き込みレベル UseAutoMagic = true; //マジックナンバーを使用するかどうか MagicNumber = 6; //マジックナンバー0-2000を設定します ロット= 0.01; //初期取引量 UseMartin = true; // Martin関数を使用するかどうか ブースター= 1.7; //増加の倍数 NetGap = 10;

Size Bars – индикатор отображает на графике максимальный, минимальный, текущий и средний размер баров (свечей) за выбранный период.
Отображаемые параметры индикатора Size Bars: 1) Текущий размер бара в писах (по максимум/минимум, тело бара). 2) Максимальный, минимальный и средний размер свечей BUY . 3) Максимальный, минимальный, средний размер свечей SELL . 4) Количество свечей BUY и количество свечей SELL . 5) Среднее количество свечей подряд BUY и SELL . 6)

This DYJ OonClickClose help you to close all orders having profit immediately with only ONE CLICK, its work is very fast. You can choose which symbol you want or close all symbols so it will helpful for you in your trading to manage trading faster. This EA can quick close all Buy and Sell Orders by a selected symbol or total, And delete all pending orders. It includes dynamic target profit tracking function. The software has manual transaction buttons buy and sell. It is a management softw
不採算注文のバスケットを「解決」するためのシステム、ニュースフィルター、他の取引商品のオープンポジションのフィルター、および取引シグナルをテレグラムチャネルに送信する機能を備えたグリッドアドバイザー。
エキスパートアドバイザーは、手または他のエキスパートアドバイザーで開いた取引を損益分岐点にするユーティリティとして、アカウントの不採算ポジションを復元するために使用できます。
線形回帰チャネル内で機能し、いくつかの条件で入力します。信号は、線形回帰チャネルの方向、チャネル幅、指数移動平均の交点、1日の平均ボラティリティ、次数平均を使用します。
主な機能: 戦略に含まれるシグナルの取引 ボタンでの取引 ニュースフィルター 他のトレーディング商品のオープンポジションでフィルタリング アカウントの不採算ポジションの決済 位置平均 ポジションのトレーリングストップ利益 損益分岐点に転送 電報にトレードシグナルを送る 電報にニュースを送る
グリッドステップが構成され、価格が私たちに反する場合、一定数の注文の後、アカウント回復機能(ドローダウン削減)がアクティブになり、最も
Auto set stop loss and take profit and trailing on any open position on chart , Wen you open positions manually it will manage the trade and set the stop loss/take profit and trailing stop based on Average true range calculation with risk reward factor default 1:3 . also you can use normal stop loss take profit and trailing . Inputs Stop Loss (in pips) Take Profit (in pips) Trailing Stop (in pips) Trailing Step (in pips) Use ATR = true ATR period Risk Reward
chart outpu

Auto SL and TP is a program that adds StopLoss and TakeProfit automatically, so you don't need to worry about it anymore. The program checks at any time if StopLoss and TakeProfit are set correctly!!! You can enter your values via the input parameter.
Input-Settings StopLoss: Boolean value, if set to true, will be executed. StopLoss in Points TakeProfit: Boolean value, if set to true, will be executed. TakeProfit in Points

Based on pending orders. You decide what the distance to the pending order is. Very easy to use and optimize. How it works? EA opens orders in accordance with the trend (if the parameter Trend = On) and then builds succeeding trades if the move goes against it. And more specifically ... sets the distance between orders. The distance can be fixed or variable (different for all orders). This will help increase the trading system flexibility.
Designed for major currency pairs. For Expert Adviso

Hi there! Since I am starting commercial and non-commercial product publishing I would highly appreciate: If you like this product, please rate it. That will help to promote not only this product, but indirectly another ones. So, such promotion will help to make some money from commercial products. Thus, I will have opportunity to fund my another directions of trading researches like bot development using mql4 and mql5 programming languages as well as python written products like crypto bots. If

The Spike King Indicator is, as the name suggests, a forex trading tool that recognizes spikes in the market. This is a perfect indicator for reversal traders. A spike often indicates a turn-around moment. The best way to use that gauge is to apply it to your favourite trading system as a filter. ONGOING PROMO!!! The indicator is displayed in a separate window placed just below the main trading chart, as well as a confirmation arrow with shows us in the chart fr every new signal. HAS AN INBUILT
Robot functions: 1. TP and SL 2. TSL 3. BE 4. Working time selection function 5. Disconnection of the robot's work after obtaining a given profit or loss. A robot designed to trade on all currency pairs, cryptocurrencies and synthetic indices. Works on any time frame. Tests have shown its great effectiveness in action. If you need more information about the robot, visit my YT channel and use the Telegram messenger: @Mati_FX
100 % PER MONTH PROFIT---- MY NEW SIGNAL HERE -------> https://www.mql5.com/en/signals/2162238?source=Site+Signals+My#
What Is the Average True Range (ATR)? The average true range (ATR) is a technical analysis indicator, introduced by market technician J. Welles Wilder Jr. in his book New Concepts in Technical Trading Systems, that measures market volatility by decomposing the entire range of an asset price for that period. The true range indicator is taken as the greatest of the fol
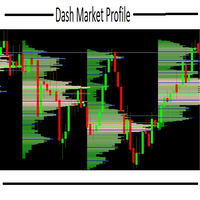
this indicator is essential when it's necessary to identify trade locations on chart. You can initially get an idea of the candlestick's direction with other graphical tools and then identify the best regions with the DMP. The Dash Market Profile is a statistical indicator, that mean it is an indicator that is based on mathematical calculations, identifying the best regions and observing the candles of the best regions to trade. The financial market is not as easy as it seems, it is necessar

A indicator to show saturation in buying or selling With fast and complex mathematical calculations Easily find saturation points for buying or selling Can be used in all symbols and time frames with many signals Can be combined with different indicators and different time frames With simple settings and simple working methods
Features: Can be used on all symbols Can be used in all time frames Can be used in all markets (Forex, stock, etc.) Large number of signals Same performance on all t

High Probability Reversal Arrow Indicator The indicator looks for trend exhaustion areas, and plots Buy/Sell arrow after on confirmation of trend exhaustion. Signals can also be shown as popup alerts, or be sent as e-mail or mobile phone notification. Trades can be taken on breakout of the signal candle. Inputs
Signal Type: Aggressive/Normal History Bars : Can be set to 0 (zero) to show all historical signals, or can be set to a limited number of bars for faster execution. Show Alert : True/F
Modifiable Moving Average Cross Expert Advisor
This Expert Advisor (EA) is based on the cross of two moving averages ; i.e; “ Moving Average 1 ” and “ Moving Average 2 ”.
“Moving Average 1” has to always be greater than “Moving Average 2”. (So that it logically makes sense; unless one is just trying out different stuff). If “Moving Average 2” crosses above “Moving Average 1”, the program will enter a BUY trade . If “Moving Average 2” crosses below “Moving Average 1”, the program will enter

Crypto Mama version 1.10 introduces a significant change. The robot now possesses the capability to execute various types of orders, including Limit, Stop, and Market orders. The "Reverse" option is also integrated but is deactivated by default. However, users can activate it when necessary. By default, the robot initiates Market orders and is configured to trade on the following symbols: BTCUSD/H1 timeframe. When using the robot on the listed symbols, prioritized by quality, users must select a

Real Trend Zigzag shows the real trend of a market, u nlike the default Zigzag indicator. It calculates the trend in real time and shows green lines for upwards trends, red lines for downward trends and blue lines for no trends. Regarding the old slogan "the trend is your friend" it helps you to decide if should open a buy or sell position. If you are looking for a multi timeframe zigzag, take a look at the PRO version: https://www.mql5.com/en/market/product/72071 MT4 version can be found her
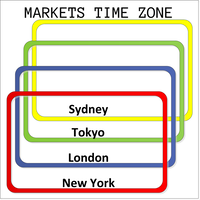
This product displays open and close time zones for four major markets New York, London, Sydney and Tokyo. It spares you the effort to manually check for market hours by conveniently displaying colored zones for different market hours. For serious traders it is essential to understand your preferred currency pair behavior with respect to major markets open and close times. This EA comes in handy when you want to integrate market hours with your other analysis tools all in one visual display. -Th

Error EA is designed to be a forex trader, trading currency pairs. The robot is capable of trading across timeframes ranging from M15 to H6. When trading on higher timeframes, from H1 to H6, the robot is characterized by higher precision and lower trading frequency. On the other hand, when trading on lower timeframes, from M15 to M30, the robot has a higher trading frequency. Additionally, the robot achieves excellent results on various currency pairs across different timeframes. This fact clear

Description:
The Wall of Worry indicator allows you to assess market sentiment and possible reversals. The indicator represents three lines that are displayed in a separate window.
Black line (trend) - the amount of volumes in the candle body.
Red line (bears) - the amount of volumes in the upper shadow of the candlestick.
Blue line (bulls) - the amount of volumes in the lower shadow of the candle.
The idea is based on "Wall of Worry" - this is the periodic tendency of financial marke
An indicator of patterns #52 and #53 ("Falling/rising wedges") from Encyclopedia of Chart Patterns by Thomas N. Bulkowski.
Parameters: Alerts - show alert when an arrow appears Push - send a push notification when an arrow appears (requires configuration in the terminal) PeriodBars - indicator period K - an additional parameter that influences the accuracy of pattern shape recognition ArrowType - a symbol from 1 to 17 ArrowVShift - vertical shift of arrows in pixels ShowLevels - show lines
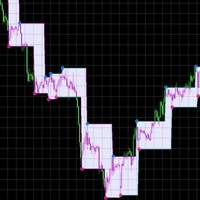
The ZigZag indicator, which has already become common and familiar to any trader, has acquired new forms and received additional reinforcement by including the results of Parabolic SAR analysis in its team. The tandem of these two indicators shows excellent accuracy in determining the direction of the trend and timely receiving a signal about its reversal. The main signals on the chart are red and blue markers (if desired, the colors can be changed). Blue marker - we start selling, red-purchases
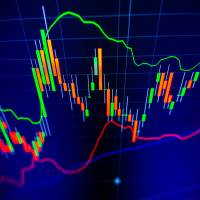
The indicator calculates reversal points based on the past trend and forms a channel (outer) on this basis. This elapsed time span from which the reversal points are determined can be specified in the settings.
An inner channel is also drawn in white. The trend continues in this channel, if there is a sideways trend. Here the upper / lower line form the possible turning point.
The indicator is suitable for all trading areas, whether forex, crypto, metals, indices or futures. All areas trade
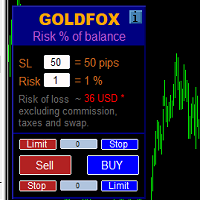
ストップロス(ピップ単位)と口座残高からのリスクのパーセンテージを考慮した取引ロットの自動計算。 Expert Advisorパネルは、左上のチャートにあります。アドバイザのパネルで、ピップ単位のストップロスのサイズとバランスからのリスクのパーセンテージを選択できます。保留中の注文の現在の価格からの偏差をピップで設定できます。赤い色は、ストップロスがトリガーされたときに失う可能性のある預金通貨の金額を示します。この金額には、手数料、スワップ、税金は含まれていません。
主要な外国為替通貨ペア、XAUUSD(ゴールド)、BTCUSD、ETHUSDには、このアドバイザーを使用することをお勧めします。他の機器については、計算の特殊性を考慮すると、エラーが発生する可能性があります。ほとんどの外国為替商品では、ドットの後に5桁のアカウントをお勧めします。
説明
-損失のリスク。預金通貨のリスク額は、アドバイザーの情報パネルに赤で表示されます。この値は、商品の証拠金がこのリスクに対して十分であり、SLフィールドでピップサイズを正しく指定している場合、未決済注文(または

XAUUSD H4 Set -> start 01:00 | end 23:55 | Lot Size Initial 0.01 | Lot Size Average 0.10 | Max Orders 100 | Distance -100 | TP 50 | SL -100000 - Recommended Deposit 10.000$ “ Continuum EA was born from the need to have a short-term trading with operational signals.” The logic behind this system is based on one entry per candle.
A check based on multiple moving averages detects the direction of the trade.
The EA immediately opens a trade and places a pending averaging order at the desired

Trade Dragon Pro An expert trade utility perfect for intraday, mid-term and long-term trading. Trade Dragon Pro generates stop-loss and take-profit levels for you based on the previous Tokyo-Sydney session.
In-built risk management Configurable number of entries On-the-fly risk and SL and TP adjustment (TP is based on SL) In-built trade manager for auto break-evens and trailing stop losses Per-day support and resistance levels Pending levels menu 3 MA trend signal Trade projection to show you
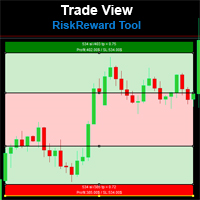
Risk Reward Tool , It is easy to use. With this tool you can see the rates of profit loss profit. You can see your strategy and earnings reward status of your goals.Double calculation can be done with single tool. Move with drag and drop. You can adjust the lot amount for calculations. The calculation results are shown in the comment section. There may sometimes be graphical errors during movements. Calculations works at all currency. Calculations All CFD works. Updates and improvements will co

The EA trades using two MA indicators - Moving Average and ADX - Average Directional Movement.
Buying and selling is possible only when a new bar is formed. Buy: MA is rising and the current closing price is above it. A buy order is placed only if there is a buy signal and there are no open long positions. Sell: MA is falling and the closing price is below it. A sell order is placed only if there is a sell signal and there are no open short positions. ADX will not allow trading if the market

TradeByTime Manager is a tool to trade based on time. It is semi auto trading. Trader define entry and exit time and EA will manage the rest. Helpful for trader who is usually trading with time range such as trading signal with entry and exit based on time or trading with news event time. Or trader who is familiar with trading binary option, this is another 'sense' of it. Only this is for trading on regular chart. 1. TakeProfit and Stoploss 2. Double time based : Local and Server 3. Time counte

A very useful indicator to show you the previous day High and Low level as a channel on any time frame. This is an essential tool that helps you identify the current market position and trend. Every trader should have this in his toolbox, as sometimes when working on smaller time frames we forget about what happened yesterday :) and therefore we get distracted by false movements of the market.
I hope you enjoy my products and for the Demo version before leaving a negative review (if the need a

ボリンジャーバンドとストキャスティクスとの戦略取引
ボリンジャーバンドは主にトレンドを追うために使用されます。
オープン保留中の注文の購入または販売のための確率的メインラインおよびシグナルラインの使用
フィボナッチは目標利益、サポート、レジスタンスレベルの価格を使用しています
MT4 version : Auto3M Pro MT4 特 マーチンゲールなし ハードストップロスと各ポジションの利益を取る ボリンジャーバンドによる柔軟なストップロス、固定小数点、以前の高さまたは低さ、フィボナッチレベル 柔軟な固定小数点間で利益を取り、フィボナッチレベルで利益を得る 固定小数点間の柔軟なトレーリングストップとストップレベルの乗算 資金管理 ニュースフィルター 保留中の注文をインターバル時間で自動的に削除 保留中の注文には買いストップと売りストップ機能を使用します 自動チャートにフィボナッチ、ボリンジャーバンド、ストキャスティクスを追加 市場が閉じる前に利益を閉じる バランスによる動的ロットサイズ ヘッジポジション 固定位置 エクイティによる利益を閉じる 部分的な利益を閉じ

Binary Options Assistant (BOA) Multi Currency Dashboard for Binary Options (MT5) .
You can use any of the BOA Signals Indicators with the dashboard. Just change the BOA Signals Indicator Name in the dashboard settings to the indicator you want to get signals from. For example: CHILL. BLAZE: BOA_BLAZE_Indicator_v1 Strategy : BLW Online Trading Binary Options Strategy (3 Moving Average)
LAVA: BOA_LAVA_Indicator_v1 Strategy: Lady Trader Binary Options Strategy (Bollinger Bands & Stoc
Binary Options Assistant (BOA) CHILL Signals Indicator provides signals based on Katie Tutorials Binary Options Strategy. Indicators: 3 Moving Averages & RSI
Stop missing trades, stop jumping from chart to chart looking for trade set-ups and get all the signals on 1 chart! U se any of the BOA Signals Indicator with the Binary Options Assistant (BOA) Multi Currency Dashboard . All BOA Signal Indicator settings are adjustable to give you more strategy combinations. The signals can be seen vi
Binary Options Assistant (BOA) ICE Signals Indicator provides signals based on gkNextLevel Binary Options Strategy. Indicators: 2 Bollinger Bands & Stochastic
Stop missing trades, stop jumping from chart to chart looking for trade set-ups and get all the signals on 1 chart! U se any of the BOA Signals Indicator with the Binary Options Assistant (BOA) Multi Currency Dashboard . All BOA Signal Indicator settings are adjustable to give you more strategy combinations. The signals can be seen v

Binary Options Assistant (BOA) BURN Signals Indicator provides signals based on Ana Trader Binary Options Strategy. Indicators: MACD & Stochastic
Stop missing trades, stop jumping from chart to chart looking for trade set-ups and get all the signals on 1 chart! U se any of the BOA Signals Indicator with the Binary Options Assistant (BOA) Multi Currency Dashboard . All BOA Signal Indicator settings are adjustable to give you more strategy combinations. The signals can be seen visually and hea
Binary Options Assistant (BOA) BLAZE Signals Indicator provides signals based on Christian’s at BLW Online Trading Binary Options Strategy. Indicators: 3 Moving Averages
Stop missing trades, stop jumping from chart to chart looking for trade set-ups and get all the signals on 1 chart! U se any of the BOA Signals Indicator with the Binary Options Assistant (BOA) Multi Currency Dashboard . All BOA Signal Indicator settings are adjustable to give you more strategy combinations. The signals c
Binary Options Assistant (BOA) LAVA Signals Indicator provides signals based on Lady Trader Binary Options Strategy (Bollinger Band & Stochastic). Indicators: Bollinger Bands & Stochastic
Stop missing trades, stop jumping from chart to chart looking for trade set-ups and get all the signals on 1 chart! U se any of the BOA Signals Indicator with the Binary Options Assistant (BOA) Multi Currency Dashboard . All BOA Signal Indicator settings are adjustable to give you more strategy combinatio

Binary Options Assistant (BOA) BOIL Signals Indicator provides signals based on Ana Trader Binary Options Strategy. Indicators: Stochastic
Stop missing trades, stop jumping from chart to chart looking for trade set-ups and get all the signals on 1 chart! U se any of the BOA Signals Indicator with the Binary Options Assistant (BOA) Multi Currency Dashboard . All BOA Signal Indicator settings are adjustable to give you more strategy combinations. The signals can be seen visually and heard au
Binary Options Assistant (BOA) COLD Signals Indicator provides signals based on Amalia Trader Binary Options Strategy. Indicators: Keltner & Stochastic
Stop missing trades, stop jumping from chart to chart looking for trade set-ups and get all the signals on 1 chart! U se any of the BOA Signals Indicator with the Binary Options Assistant (BOA) Multi Currency Dashboard . All BOA Signal Indicator settings are adjustable to give you more strategy combinations. The signals can be seen visually

This robot operates through triggers above and below the previous candlestick with STOP orders.
When reaching the trigger (Stop Order) it opens the order and we have three situations:
If it reaches TAKE PROFIT (Maximum Profit) and the Breakeven Point is activated, it moves the STOP LOSS and the reverse STOP ORDER to Breakeven and cancels the reverse STOP order when reaching the TP.
If you go to STOP LOSS after reaching breakeven, the trigger of the reverse order will be reached be

Robô Ultra Dinamic Keltner
é um expert que utiliza os canais de keltner como principal forma de sinal.
O Robô possuem três setups
Rompimento das bandas Toque nas Bandas Retorno ao centro que é o Fechou Fora Fechou Dentro Configurações básicas do expert são
Volume (Tamanho do lote a ser negociado) Stop Loss em Pontos Take Profit em Pontos Configuração de horário para inicial Configuração de horário para enviar ordem Metas Financeiras Perda máxima no dia Lucro Máximo no dia Martingale Br

This is an original, agile, and excellent trending system. Whether you are a beginner trading novice or a professional trader, this set of indicators can help you quickly and timely track the latest changes in market trends. It has the following characteristics: The method of use is extremely simple, plug and play, and the display of all trend analysis results is clear at a glance; There is no need to configure any functional parameters, the trend tracking indicator will automatically analyze th

This is the Stargogs Volatility Arrow V1 Yeahhh!!! This Arrow is based on trend, support and demand and based on EMA's. You can change the parameters or settings like you want to. Message Me for the System which works best with this Indicator for free (include: Template, and other indicators). This indicator works with all Currency Pairs, All Volatility indices, All Indices, Boom & Crash Indices, Gold and NASDAQ. Works on All Timeframes Add the following to your chart with Stargogs Volatility A
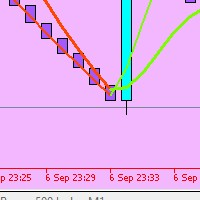
The marik_moving average signal indicator for the MetaTrader 5 trading terminal is built on the interaction of the fast and slow moving Hull.
The moving average is known for the fact that the lag of the indicator, characteristic of moving averages, is minimized in it. The marik_moving average signal indicator for MT5 at the intersection of the "Fast" and "Slow" lines displays a signal that is regarded as a likely price reversal.

- This Indicator will automatically plot 13 support/resistance reference lines base on Fibonacci level calculation for timeframe M30 and above. - Not available for charts with timeframe lower than M30 due to noisier (high fluctuation) nature.
- The reference lines are plotted from a maximum and minimum levels derived automatically from a custom algorithm. - The 13 reference lines are at 123.6%, 111.8%, 100%, 88.2%, 76.4%, 61.8%, 50%, 38.2%, 23.6%, 11.8%, 0%, -11.8% & -23.6%. - It will also plot

An indicator of patterns #21, #22, #23 ("Flag") from Encyclopedia of Chart Patterns by Thomas N. Bulkowski. Parameters: Alerts - show alert when an arrow appears Push - send a push notification when an arrow appears (requires configuration in the terminal) PeriodBars - period in bars K - an additional parameter that influences the accuracy of pattern shape recognition. The influence of the parameter will be visible if not all of the pattern variants are enabled (not all three parameters Expandin

A flexible 2-Line MACD indicator The default MACD indicator inside MT4, limits you to using the MACD with a fast-EMA, slow-EMA. This MACD indicator allows you to set your own MA-Method choices for these 2 components, separately! You can select from SMA, EMA, SMMA, LWMA, ADAPTIVE MA, FRACTAL MA, DEMA, TEMA, VARIABLE INDEX DYNAMIC MA, and can even use a separate method for each 2 fast-slow. The signal line has options from SMA-EMA-SMMA-LWMA. On-chart colored candles, with drawing condition types i
Gap indicator (pattern #23) from Encyclopedia of Chart Patterns by Thomas N. Bulkowski.
Parameters: Alerts - show alert when an arrow appears Push - send a push notification when an arrow appears (requires configuration in the terminal) GapSize - minimum gap size in points ArrowType - a symbol from 1 to 17 ArrowVShift - vertical shift of arrows in pixels Auto5Digits - automatic multiplication of GapSize by 10 when working with 5 and 3 digit quotes. Note. Arrows appear at the opening of a

An indicator of pattern #30 ("Island Reversal") from Encyclopedia of Chart Patterns by Thomas N. Bulkowski (two gaps, the second gap is in the direction of the first one). Parameters: Alerts - show alert when an arrow appears Push - send a push notification when an arrow appears (requires configuration in the terminal) GapSize - minimum gap size in points ArrowType - a symbol from 1 to 17 ArrowVShift - vertical shift of arrows in pixels ShowLevels - show levels ColUp - color of an upward line

An indicator of patterns #24 and #26 ("Head and Shoulders") from Encyclopedia of Chart Patterns by Thomas N. Bulkowski. Parameters: Alerts - show alert when an arrow appears Push - send a push notification when an arrow appears (requires configuration in the terminal) PeriodBars - indicator period K - an additional parameter that influences the accuracy of pattern shape recognition ArrowType - a symbol from 1 to 17 ArrowVShift - vertical shift of arrows in pixels ShowLevels - show levels Col

The Half ma arrow indicator for the MetaTrader 5 trading terminal is a simple but effective tool that gives a signal about a change in the current trend. The Half ma indicator looks like a solid dynamic line that changes color at the points where the trend changes. At these points, the indicator draws arrows of the corresponding color and direction.The Half ma arrow indicator for the MT5 terminal is not an independent source of input signals. It will be most effective to use it as a trend filte

1. What is it The classic Bollinger Bands and the Bollinger Bands indicator built into the system, they have the same mean period and deviation period. And the method of average is just the simple moving average method. The deviation method used is just the standard deviation method. All this limits our research because: Sometimes we would like to have longer period averages + shorter period deviations. Sometimes we want moving averages that are not limited to simple moving averages but als
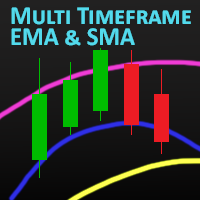
MT Moving Average
MT Moving Average is an easy to use multi time frame moving average indicator. It shows moving averages (SMA or EMA) of current symbol from all time frames (higher and lower). No need to switch between time frames anymore. With help of the indicator panel you can select which timeframe should be shown on the chart. I.e. your current timeframe is M5 and you can turn on M15 to see the the moving average of period M15. Indicator settings
Dark interface --> Set to true to use d
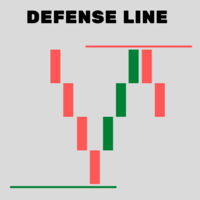
Indicator that determines very accurately "future" where BUYERS and SELLERS will defend their positions.
DOES NOT use moving averages, Fibonacci or any other underlying indicators.
SIMPLE AND EFFICIENT !!
In these defense regions "DEFENSE LINE" is the best region for decision making to buy / sell.
1- Place the indicator on the chart
2 - Move the Vertical lines to the period to be analyzed
3 - The Defense Line will be drawn automatically
4 - To erase the Defense Line, press the
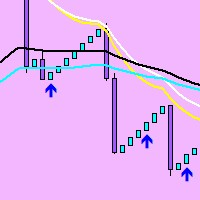
modification of the Rsi ma indicator. Added a filter-the trend indicator iMA (Moving Average, MA). You can also now set the character code (from the Wingdings font) for the arrows and the offset of the arrows.
The 'Rsi ma' indicator draws two indicator buffers using the DRAW_ARROW drawing style. The 'Oversold' buffer is drawn when the indicator LEAVES the oversold zone and the iMA is under the price, and the 'Overbought' buffer is drawn when the indicator LEAVES the overbought zone and the iM
MetaTraderマーケットは、履歴データを使ったテストと最適化のための無料のデモ自動売買ロボットをダウンロードできる唯一のストアです。
アプリ概要と他のカスタマーからのレビューをご覧になり、ターミナルにダウンロードし、購入する前に自動売買ロボットをテストしてください。完全に無料でアプリをテストできるのはMetaTraderマーケットだけです。
取引の機会を逃しています。
- 無料取引アプリ
- 8千を超えるシグナルをコピー
- 金融ニュースで金融マーケットを探索
新規登録
ログイン