YouTubeにあるマーケットチュートリアルビデオをご覧ください
ロボットや指標を購入する
仮想ホスティングで
EAを実行
EAを実行
ロボットや指標を購入前にテストする
マーケットで収入を得る
販売のためにプロダクトをプレゼンテーションする方法
MetaTrader 5のための新しいエキスパートアドバイザーとインディケータ - 95

This non-trading expert utilizes so called custom symbols feature ( available in MQL API as well) to build renko charts based on history of real ticks of selected standard symbol. RenkoFromRealTicks generates custom symbol quotes, thus you may open many charts to apply different EAs and indicators to the renko. It also transmits real ticks to update renko charts in real time. The generated renko chart uses M1 timeframe. It makes no sense to switch the renko chart to a timeframe other than M1. T

S imple arrow with alert on chart. This is NOT an entry indicator but a direction indicator. It uses MACD signal line to show you possible future direction of a trend. Please use it with other filters or confirmations to trade properly. Recommended for scalping and short term trades. Made for EURUSD M5 but it should work on every major pair on M5 timeframe. For MT4 version please go here! *If you need fully automated trading system. Please check this EA here! FEATURES: Very simple directional i
FREE

Note : Free version can be used for trading on Demo Accounts.
Important :
This is Arbitrage EA and may not work on all accounts. It is recommended to follow the testing process described on product screenshots.
Strategy :
EA will place trades based on Triangular Arbitrage strategy. Triangular arbitrage (also referred to as cross currency arbitrage or three-point arbitrage) is the act of exploiting an arbitrage opportunity resulting from a pricing discrepancy among three different cu
FREE

FXC iMACD-DivergencE MT5 Indicator
This is an advanced MACD indicator that finds trend-turn divergences on the current symbol. The indicator detects divergence between the MACD and the price movements as a strong trend-turn pattern.
Main features: Advanced divergence settings
Price based on Close, Open or High/Low prices Give Buy/Sell open signals PUSH notifications
E-mail sending Pop-up alert Customizeable Information panel Input parameters: MACD Fast-EMA: The Fast-EMA variable of the MACD

Indicator shows 3 Fibonacci expansion levels, based on the last pivot breakout. Pivots are calculated based on volatility (ATR), works on every Timeframe and Symbol. Lines are displayed only after the pivot breakout. A comment on the upper left side shows the minimum calculated value (in points) for pivots. Parameters: Variation: minimum variation for the pivot. ATR multiplication factor. (default 3) ATR Period: Period for ATR value calculations. (default 60)
Ex.: ATR on TimeFrame H1 = 100po

This indicator displays volume delta (of either tick volume or real volume) encoded in a custom symbol, generated by special expert advisers, such as RenkoFromRealTicks . MetaTrader does not allow negative values in the volumes, this is why we need to encode deltas in a special way, and then use CustomVolumeDelta indicator to decode and display the deltas. This indicator is applicable only for custom instruments generated in appropriate way (with signed volumes encoded). It makes no sense to ap
FREE

Trend Line Finder will project forward a support and resistance lines using 2 previous highs for resistance and 2 previous lows for support. It will then signal to the trader by alert making the trader more aware that a possible good move is about to happen. This is not a stand-alone trading system but is very useful in finding key areas of support resistance levels where price will usually either rebound from or breakthrough. Its down to the trader to decide what to do with use of other s
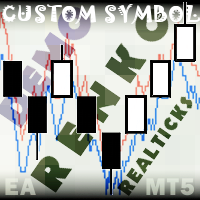
This non-trading expert utilizes so called custom symbols feature to build renko charts based on history of real ticks of selected standard symbol. RenkoFromRealTicks generates custom symbol quotes, thus you may open many charts to apply different EAs and indicators to the renko. It also transmits real ticks to update renko charts in real time. This is a functionally limited demo version of RenkoFromRealTicks . RenkoFromRealTicks utility can not work in the tester because it uses CustomSym
FREE

Version 1.6 of the KRAL , released in December 2023, incorporates advanced functionalities. Consequently, this robot now possesses the ability to work with all types of orders and open buy or sell-only, positions as well. Additionally, it features an integrated option for reversing positions. This version also includes an advanced money management system, which can be utilized at your discretion, and it offers an independent option to set a fixed lot size if automatic calculation is not prefe

This software uses classical rules to the entry and exiting of the trades when trading using the ichimoku style. The EA trades in the current timeframe on the charts. According to testing results yielded more than $1k using the 1hr chart in the past year. The EA should not be expected to perform well when the price is ranging and too volatile. The best results should be achieved when the EA is turned on in the trending market only and under a solid money management plan. The results shown on the
FREE
Мультивалютный индикатор в отдельном окне отображает движение валютных пар в пунктах с расхождением от начала дня. Во время работы, динамически возможно включать и отключать различные пары прямо на графике. При первом запуске, возможно, потребуется продолжительное время, пока загрузиться история для основных валютных пар. Расчет всех кроссов происходит на основе мажоров. Для валют CAD, CHF, JPY - график перевернут. При повторном открытии, все настройки индикатора восстанавливаются автоматически.
FREE
Мультивалютный индикатор в отдельном окне отображает движение валютных пар в пунктах с расхождением от начала дня. Во время работы, динамически возможно включать и отключать различные пары прямо на графике. При первом запуске, возможно, потребуется продолжительное время, пока загрузиться история для основных валютных пар. Для валют CAD, CHF, JPY - график перевернут.
При повторном открытии, все настройки индикатора восстанавливаются автоматически.
FREE

Number one iForex "Number one iForex" is a expert advisor based on price movement. It has a built-in unique Smart Recovery and money management algorithm. Only one trade at a time.
Settings Description
Start Time (Hour) - Standard 1 AM. (You can adjustable). End Time (Hour) - Standard 11 PM. (You can adjustable). Magic Number - Standard 123456 (You can adjustable). Auto buy - Standard true (You can adjustable to false for stop automatic open long position). Auto sell - Standard true (You c

EA designed in MQL5 for AUSUSD H4, can be used also in H1 and Daily, but H4 is the best choice. It uses "On Balance Volume" and "RSI" indicators for trading, only 1 trade opened at the same time. Works best on trending market. - Averages 12% return per year with 0.01 lots - Tested for more than 15 years - Designed for long term gains - Fixed lots - Always trade with Stop loss and Take profit - No Martingala - No Hedging - Customizable magic number

EA は、長い期間の MA からの衝動的なバウンスが完了した後、価格が平均に戻ったときに取引します。必要に応じて平均化を使用できます。高度なパネルとすべての種類の通知があります。 問題解決→ こちら / MT4版→ こちら 利点: バスケット注文の高度なフィルタリング
手動注文を追加できる完全自動取引システム
簡単なセットアップと直感的なパネル インターフェイス
強力な取引の可能性と簡単なセットアップ
内蔵オートロット
入力設定: . Main settings Size_of_the_first_order - 最初の注文を開くためのボリューム。 Enable Autolot 計算が無効になっている場合に使用されます。 Enable_Autolot_calculation - オートロットを有効にします。オートロットを使用する場合、最初の注文のサイズは使用できません。初回注文時に使用。 Autolot_deposit_per_0.01 ロット - オートロット使用時の 0.01 ごとのデポジット額 Orders_Magic_number - アドバイザの注文の主な

無限からの通貨の強さを測定するためのこの革新的な指標は、長い間取引されているダフ屋やトレーダーにとって不可欠な助手です。 通貨の強さ/弱さを分析するためのシステムは、世界の主要なトレーダーによって市場で長い間知られており、使用されてきました。 任意の裁定取引は、この分析なしでは完全ではありません。 私たちの指標は、互いに関連して基本通貨の強さを簡単に決定します。 これは、インスタント分析を可能にし、最強のエントリポイントを検索し、すべてまたは現在の通貨ペアの折れ線グラフが表示されます。 インジケータは直感的で、すぐに見つけて任意のペアに切り替えることができ、地下室とメインチャートの両方に配置できるモバイルパネルがあります。 通貨の強さの変化の通知のタイマーモードは、トレーダーに電話で通知を受け取る機会を与えます。
通貨パワーメーターインフィニティ指標を使用するためのいくつかの戦略:
1. 通貨の強さの線形表示のチャートを使用して、交差点を新興トレンドの信号として検索します 2. トレンド反転信号が表示された後、強い通貨の方向に頭皮 3. 通貨の強さの発散分析を使用して、
FREE

Telegram Simple
is an APP that allows you to send your technical analysis or operations, directly to your telegram channel, quickly and simply, without complications. - Scroll through the symbols from the panel - Fully configurable list of symbols - Quick change of Time Frame from panel - Send comments and Screenshots
for more details: tradingxbots@gmail.com

The patterns of 3 (three) Candles:
Three White Soldiers; Three Black Crows; These are reversal patterns widely used by traders, as they have a high probability of showing the inversion of the current market movement. For example, if in a bullish trend there are three black crows, there is a high probability of reversing the current bullish movement.
The Three White Soldiers have the following characteristics: There are 3 consecutive candles with a good body, that is, the difference between

RSIアラーム(メタトレーダー5用)
このインジケーターは、すべての設定(周期、色、レベルなど)を備えた通常のRSIのように機能します。
ただし、さらに、アラームを上下のレベルに設定でき(例70および30)、青と赤の線を移動して上下のレベルを確立することにより、これらのレベルを調整することができます。
予想される上限または下限のRSIが満たされたときにチャート上に矢印を作成する追加機能をオンまたはオフにすることもできます。 RSIアラーム(メタトレーダー5用)
このインジケーターは、すべての設定(周期、色、レベルなど)を備えた通常のRSIのように機能します。
ただし、さらに、アラームを上下のレベルに設定でき(例70および30)、青と赤の線を移動して上下のレベルを確立することにより、これらのレベルを調整することができます。
予想される上限または下限のRSIが満たされたときにチャート上に矢印を作成する追加機能をオンまたはオフにすることもできます。

財務時系列を分析する場合、研究者はほとんどの場合、価格が通常の(ガウス)法則に従って分配されるという予備的な仮定を立てます。このアプローチは、正規分布を使用して多数の実際のプロセスをシミュレートできるという事実によるものです。さらに、この分布のパラメータの計算には大きな問題はありません。 ただし、金融市場に適用した場合、通常の配布が常に機能するとは限りません。金融商品の収益は、通常とは異なる形をしていることがよくあります。排出量が多すぎる、および/または大量であると、いわゆる「ヘビーテール」分布が使用されます。 この指標を作成する際、価格レベルはラプラス分布の影響を受けると想定します。この分布の主な違いは、はるかに広い範囲の値を使用できることです。このおかげで、ラプラス分布は価格変動をシミュレートすることを可能にします。さらに、ラプラス分布は複合的であるため、さまざまな条件下で低い値と高い値が発生する状況で使用できます。分布自体見た目は通常とは大きく異なります。また、グラフの形状と位置は、bとmの2つのパラメーターに依存します。 レベル設定 ラプラス分布の主な利点は、引数値の範囲が広い
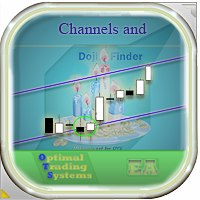
This EA finds price movement channels on the chart and also identifies Doji and Engulfing candles. The EA trades when such a candle appears at the channel border (it can not only bounce off the borders, but also break the channel), and can display the channels and candles that it trades. To show examples of candles and for some settings, a menu has been made on the left of the chart. The Expert Advisor also has signal filtering by stochastic and moving average, it has many settings to optimize t

Description
Money Zones is an indicator that determines accumulation/distribution zones in the market. Green zones make it possible to look for buy entry points or sell exit points. Red zones, on the contrary, define the opportunity for selling or closing buys. The indicator has the ability to define money zones for two timeframes simultaneously on the same chart.
How to use?
Use this indicator to identify market zones as support/resistance zones to determine the best conditions for marke

Volume Calculator
This indicator shows the volume to be used in an operation based on the maximum acceptable stop value and the size of the stop. That way you will not use a calculator to calculate the volume you are going to use every time. This indicator makes your life much easier and faster. Suitable for any type of trader: Scalper, DayTrader, SwingTrader.
FREE

BUILD YOUR GRID
The expert is a system to help any trader to make a grid of orders (without martingale, lite martingale, or full martingale) easy and simple. Please make your test to find your settings. Default settings are just to take an idea of how the expert works. The expert can make according or contrary grid of orders. You can set the expert to work in hedge mode if the losses are huge. The system uses a high-risk strategy. It's better to test it first in a demo account. Version for MT4
FREE
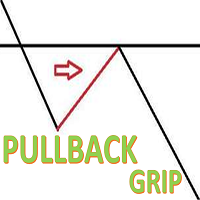
PULLBACK GRIP , is a trading system that uses price action levels support and resitence to determine market pullback and init the grip mode whit lot and risk control. if the trade is in the correct direction have a anti-martingala algoritm to take the best profit of the trend market. PULLBACK GRIP is a system that detects an entry point and initiates an operational algorithm whit multilot algorithm.
Detecting and operating the pullbacks on the wrong entries using a price action, is the most

The technical indicator Trend Strength Analyzer measures the deviation of the price of an instrument from average values over a specific period of time. A comparative analysis of the relative strength of bulls and bears underlies the indicator. If bulls prevail, an upward trend. If bears are stronger - a downward trend.
Settings:
Strike Energy (2 solid lines) = 14.
Influence Power (2 dotted lines) = 50. The TSA oscillator is effective in an active market. The most commonly used indica
FREE

The Market Thermometer can be used to help traders identify sleepy or turbulent periods. It helps beginners to check when is the ideal time to enter operations, that is, when the value of the thermometer is below its average for several periods, identifying a peaceful market. When the market is heated, that is, the thermometer is above three times its average, it is time to make profits. The Thermometer measures the extent to which the end of a period, maximum or minimum price, projects out
FREE

The Market Thermometer can be used to help traders identify sleepy or turbulent periods.
It helps beginners to check when is the ideal time to enter operations, that is, when the value of the thermometer is below its average for several periods, identifying a peaceful market. When the market is heated, that is, the thermometer is above three times its average, it is time to make profits. The Thermometer measures the extent to which the end of a period, maximum or minimum price, projects outsi
FREE

BOOM AND CRASH EA PRO BOOM AND CRASH EA PRO is a 100% adaptive expert advisor based on price movement. It has a built-in unique Smart Recovery algorithm. Only one trade at a time. Every trade has Stop Loss and Take Profit from very beginning, and they do not change. This is for those, who are looking for stable growth over the long run. SETTINGS Lot size 0.2 Stop loss 5000 take profit 10000 Recommended pairs BOOM1000,CRASH1000 Recommended TimeFrame 15m Recommended Setup
Balance : $50 - $5000
Botti Tools features
1 - Automatically places Take Profit and Stop Loss values, previously defined, in Pending Orders and in Market Positions
2 - Based on the amount of Stop Loss points defined and the specified monetary value it calculates what volume should be used for that order.
3 - After X points he puts the order on breakeven
4 - It cancels the Take Profit at X points away from it and places the Stop Loss in such a way as to guarantee Y gain points
5 - If the fourth option
FREE

Leave a review for this product, and receive another "Free" product that you choose. You can see my other products here: https://www.mql5.com/en/users/zakri/seller
Trend Detective is an advanced trend detection indicator which shows accurate entry points in direction of trend. It uses smart technology in order to detect entry points, trend changing points, and TP points. It also shows hit rate for current chart using selected parameters. Hit rate for this indicator on different charts can be
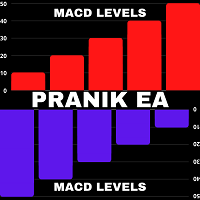
Easy to use EA designed to auto trade. Works in every market condition. It uses reliable levels of MACD indicator combined with unique logic to perform fully automatic trading operations. *For MT4 version please go here! *If you don't like automated system and only need an alert system to help you in trading. Please check this arrow with alert system here!
FEATURES: Dangerous methods like martingale, hedge, grid or scalping are NOT used. Each position has Stop Loss and Take Profit. Positional
FREE
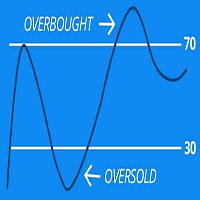
Scan all your favorite pairs with RSI, and get notified on your preferred time frames.
Settings are Customizable
Click to change time frame or open new pairs
Notification: Phone/Popup/Email The relative strength index (RSI) is a technical indicator used in the analysis of financial markets. It is intended to chart the current and historical strength or weakness of a pair/stock based on the closing prices of a recent trading period. The RSI is most typically used on a 14 period, measured on

GIVE A LOOK TO MY OTHER PRODUCTS !
100 % PER MONTH PROFIT---- MY NEW SIGNAL HERE -------> https://www.mql5.com/en/signals/2162238?source=Site+Signals+My# BROKEN TRENDLINE ALERT IS A SIMPLE TOOL INDICATOR. JUST DRAW IN YOUR CHART A DYNAMIC OR STATIC TRENDLINE,AND THE INDICATOR WILL SEND YOU ALERT WHENEVER THE PRICE CROSSES BELOW OR ABOVE YOUR DRAWN TRENDLINE. IT WORKS IN ANY TIMEFRAME AND ANY CHART YOU WANT.JUST GOT A VPS AND DON'T STRESS IN FRONT OF YOUR COMPUTER.
FOR ANY KIND OF QUESTION

As simple as title, this is a telegram notificator to be always updated about your open position. It send basically 3 message: When you reach a stop loss; When you reach a take profit; When you reach a margin call; If you want I'm available to do all customization for you, like send chart pictures, particular message or to interact with Metatrader with Telegram custom command.
How to configure: Go to Metatrader, "Windows->Options->Expert Advisor-> WebRequests for URL" and write "https://api.te
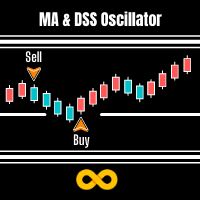
MA & DSS Oscillator is a simple system that overcomes all the market confusion by looking at the Moving Average and Double Smoothed Stochastic Oscillator. A Signal is made when the Oscillator is under 50 (A default value) and heading in same direction as the Moving Average.
The moving average is arguably the simplest but most effective tool when trading larger timeframes. We use this and the Double Smoothed Stochastic Oscillator to time our market entry.
Double Smoothed Stochastic is simila

The Market Sessions Indicator for MT5 helps you predict market turnarounds by detecting major supply and demand areas. These pivot points tend to occur after a new session has started and the previous one is still open. It is also used to gauge how many points or pips the market moves on average during a session. This helps us to place better our take profits and stop losses. The indicator works on all forex pairs, gold, silver, commodities, stocks, indices and any other instrument that your

GIVE A LOOK TO MY OTHER PRODUCTS ! 100 % PER MONTH PROFIT---- MY NEW SIGNAL HERE -------> https://www.mql5.com/en/signals/2162238?source=Site+Signals+My# MACD Cross Alert is a tool indicator that notificate directly to your phone whenever the signal line crosses the base line. For more accurate signals,crosses are filtered like this : Buy Signal : SIGNAL LINE CROSSES ABOVE BASE LINE AND BOTH ARE ABOVE THE 0 VALUE Sell Signal : SIGNAL LINE CROSSES BELOW BASE LINE AN

GIVE A LOOK TO MY OTHER PRODUCTS ! 100 % PER MONTH PROFIT---- MY NEW SIGNAL HERE -------> https://www.mql5.com/en/signals/2162238?source=Site+Signals+My# Breakout Wall is a very cool indicator. It paints a resistance and a support in the chart given by a " n " number of candles ( you can choose the parameter ),and give you an alert when a candle closes below a support or above a resistance.Very important tool if you trade daily candles for example..... Just close your pc and don'

>>> Comment ajouter des indicateurs personnalisés ou des EA à MT5 <<< > Ouvrez MT5, > allez dans Fichier> Ouvrir le dossier de données, > puis sélectionnez MQL / 5> 'Experts' ou 'Indicateurs' > et collez votre fichier MQL4 / EX4 ou MQL5 / EX5 dans ce dossier.
Lorsque vous redémarrez la plate-forme, vous devriez maintenant voir votre EA / indicateur personnalisé dans la fenêtre du navigateur.
Vous pouvez le faire glisser et le déposer sur le (s) graphique (s) de votre choix.
>>> Pour

Control Panel iForex The script allows users to easily one click for adjust lot order, buy, sell and close positions if their profit/loss reaches or exceeds a value specified in USD. BUY - Click for order long position. LOT - standard 0.1 lot. You can adjustable in control panel. SELL - Click for order short position. CLOSE ALL - Click for close all position. CLOSE BUY - Click for close all only long position. CLOSE SELL - Click for close all only short position. TAKE PROFIT (USD) - stan
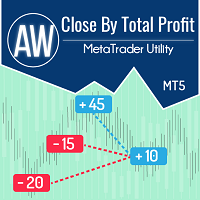
This is a utility for closing orders or baskets of orders for the total profit or loss. Can work multicurrency, can work with orders opened manually. Has additional trailing profit. Capabilities: Closing an order for the current symbol or for all symbols Closing individual orders or whole baskets of orders Stopping the utility in one click Trailing function for total profit Setting TP and SL in money, in points or as a percentage of the deposit Closing all BUY or SELL orders or closing all orde

ザ トレーダーのベストパートナー! 取引アシスタント: これは非常に機能が豊富な取引支援ツールです。 開発は簡単ではありません。Pro をサポートしてください。クリックしてジャンプしてください。
KトレードアシスタントプロMT5
取引アシスタントの操作手順
基本的な使用設定 基本: 言語選択スイッチをサポート (現在中国語と英語をサポート) 自動言語認識 バインディングをサポート ポジションを開閉するホットキー 、ショートカット キーを使用してポジションをすばやく開閉します... ポジションを閉じるためのショートカット キー。 ロック解除はほとんどの機能をサポートします リプレイ で使用できる操作 テスト環境 オープンポジションとクローズポジション: ワンクリックでポジションをオープン ( テイクプロフィットとストップロスの便利な設定、ロットサイズの自動計算などの便利な機能を含む) ワンクリックで閉じる (ロック)、ミニマリストスタイルのデザイン、クローズポジションのタイプ
FREE
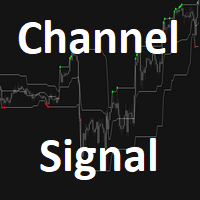
チャネル外国為替インジケーターは、特定の期間の極端な価格値を念頭に置いて設計されています。
インジケーターは、ボリンジャーバンドの線に似た3本のはっきりとした色の線で構成されています。
基本的なトレーディングシグナル
買いシグナル:価格がインジケーターの中央の中線より上で開閉し、チャネルの上部境界に沿って取引される場合は、長く行きます。
売りシグナル:価格がインジケーターの真ん中の青い線の下で開閉し、下のチャネル境界に沿って取引されるときにショートします。
買いトレードの終了:強気のトレンドが続いている間に価格がインジケーターの中央中央線を下回った場合、すべての買い注文を閉じます。
売りトレードの終了:弱気トレンドが進行している間に価格がインジケーターの中央中央線を超えてクローズした場合、すべての売り注文をクローズします。
チップ:
指標と他のテクニカル分析ツールをうまく組み合わせると、最良の結果が得られ、収益性の高い取引戦略が得られます。 スキャルピング、デイトレード、スウィングトレードに使用できます。
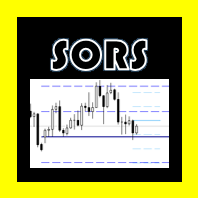
SORS COMPLEXES(Metatrader 5の場合)
このインディケータはチャート上にSORSラインを描くように設計されています。これらは通常尊重されるマーケットポイントを計算する最新の方法であり、サポートとレジスタンスで構成されていますが、クラシックとは異なり、これらはボラティリティの内因性と標準偏差から計算されます。
構成では、各レベルの線形の色を変更し、不要なレベルを非表示にすることができます。
A =年次。
M =毎月。
W =毎週
D =毎日。
SORS COMPLEXES(Metatrader 5の場合)
このインディケータはチャート上にSORSラインを描くように設計されています。これらは通常尊重されるマーケットポイントを計算する最新の方法であり、サポートとレジスタンスで構成されていますが、クラシックとは異なり、これらはボラティリティの内因性と標準偏差から計算されます。
構成では、各レベルの線形の色を変更し、不要なレベルを非表示にすることができます。
A =年次。
M =毎月。
W =毎週
D

Description :
VWAP (Volume-Weighted Average Price) is the ratio of the value traded to total volume traded over a particular time horizon. It is a measure of the average price at which pair is traded over the trading horizon. Read More.
All Symbols and All Timeframes are supported.
Indicator Inputs :
VWAP Mode : Mode of VWAP Calculation. Options can be selected : Single,Session,Daily,Weekly,Monthly
Volumes : Real Volumes,Tick Volumes
Price Type : Used price for cal

EA Ordem Fácil helps you open pending buy and sell orders (buy or sell stop) using the SHIFT, CTRL keys and mouse left button click.
To create a buy stop order, press the SHIFT key (only once) and click on mouse left button on the chart above the price.
To create a sell stop order, press the CTRL key (only once) and click on mouse left button on the chart below the price.
While the order is not opened, when you moving the mouse cursor on the chart, on the left and above corner of the ch

The Relative Equilibrium index (REi) is a technical analysis indicator that shows the direction and strength of a trend and indicates the probability of its change. It shows the ratio of the average price increase to the average fall over a certain period of time. The value of the index allows you to assess whether buyers or sellers had a stronger influence on the price over a set period of time and to assume further developments. The indicator is characterized by simplicity of interpretation an
FREE

It is based on Surfing strategy. DOES NOT USE MARTINGALE. The EA catches the moments when the previous candle crosses the moving average indicator and eliminates the false breakouts using the RSI+MA indicator, and at the same time analyzes the trend direction. The EA trades pending orders, which also allows to avoid false movements. If the pending order was not triggered and the chart reversed, then the EA deletes the pending order. Also, according to the strategy, the EA uses the Trailing Stop,

Lost in the market is a system that detects an entry point and initiates an operational algorithm.
This algorithm is different if the input is correct or wrong.
You can operate with low capital and margin.
You can download the demo and test it yourself. Very stable growth curve as result of smart averaging techniques.
"Safety first" approach in development. Stress-tests on historical data for multiple pairs. Fully automatic. Broker type: Low spread, fast execution, low commission fa

The Last Fractals , is a trading system that uses fractals to determine market corrections. The Last Fractals, is a system that detects an entry point and initiates an operational algorithm. This algorithm is different if the input is correct or wrong.
From the inputs you can control the initial loting of the algorithm, if the trade goes against you the lotage is maintained, but if it goes in your favor the lotage is increased to improve your profit.
You can download the demo and test i

Feel the Power , is a trading system that uses fractals an levels of price to determine market corrections. Feel the Power , is a system that detects an entry point and initiates an operational algorithm whit multilot algorithm. This algorithm is different if the input is correct or wrong.
From the inputs you can control the initial lot of the algorithm, if the trade goes against you the lotage is maintained to the control power, but if it goes in your favor the lotage is increased to imp

FRACTALS GRIP CONTROL , is a trading system that uses fractals an levels of price to determine market corrections and init the grip recovery mode whit lot and risk control. FRACTALS GRIP CONTROL is a system that detects an entry point and initiates an operational algorithm whit multilot algorithm.
This algorithm is different if the input is correct or wrong.
From the inputs you can control the initial lot of the algorithm, if the trade goes against you the lotage is maintained to the co

Good afternoon. Today we offer the maxlottomson indicator to determine the maximum volume that you can put up for purchase or sale, if you look at your deposit level. This indicator is convenient to use for News trading, when you need to determine the entry point on a high-speed movement and calculate the risk level as a percentage of the deposit, the maxlottomson indicator shows the maximum value of the LOT volume for your deposit that you can use for trading.
FREE

The utility opens copies of open trades. It is very convenient if you use the Signals service and want to increase the volume of transactions.
Settings: Symbols: all symbols only current symbol Orders: Buy Sell Magic Any Magic Input Magic Lot size Original - lot size from original order; Fix Lot - fix lot size (input); Lot X Mult - lot size X koef; Stop Loss From sender - Stop Loss from original; Without - without Stop Loss; Plus Fix - Stop Loss from original order + fix points; Fix Point
FREE

The mechanism is exactly the same as the free version https://www.mql5.com/ru/market/product/50090 with the exception of a huge number of additional support settings that will help you curb the martingale system. Unlike the free version, this adviser will not let you merge the entire deposit at once, and indeed with the right settings it will not work out). You can start even with $ 100. There is a feature of testing Jast Martingale, in MT5 tick data are processed with an error on the data pr

The indicator determines the state of the market: trend or flat.
The state of the market is determined by taking into account volatility.
The flat (trading corridor)is displayed in yellow.
The green color shows the upward trend.
The red color shows the downward trend.
The height of the label corresponds to the volatility in the market.
The indicator does not redraw .
Settings History_Size - the amount of history for calculation.
Period_Candles - the number of candles to calculate the
GRV Grid expert Advisor is a regular grid trader trading in both directions. The peculiarity of this grid is that subsequent orders in the grid are opened not only upon reaching the set step but also on the basis of the signal, which allows not to accumulate a lot of orders that can very quickly drain the entire Deposit. The EA makes a decision based on the signals from THE mA indicator and the trend filter. The EA trades almost non-stop, i.e. there are almost always open orders, so for stable
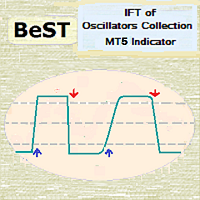
BeST_IFT of Oscillators Collection is a Composite MT4/5 Indicator that is based on the IFT ( Inverse Fisher Transformation ) applied to RSI , CCI , Stochastic and DeMarker Oscillators in order to find the best Entry and Exit points while using these Oscillators in our trading. The IFT was first used by John Ehlers to help clearly define the trigger points while using for this any common Oscillator ( TASC – May 2004 ). All Buy and Sell Signals are derived by the Indicator’s crossings of the Bu
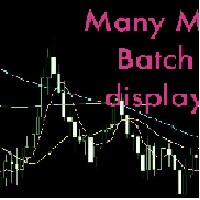
移動平均線は、通貨の価格の変化を認識する一番手軽なインジケーターです。 そのインジケータを期間毎や種類毎で複数設定して推移を見るのに優れています。 しかし、移動平均線を複数設定するのはとても手間ですよね! しかも、複数の通貨ペアを何本も表示させると更に手間が増えます。 その手間を省いたインジケータになります。
複数の移動平均線を一括で表示させる事ができます。 最大4本、ラインの太さ、色や期間、 平滑化の種類や 価格の種類も自由に設定できます。 移動平均線を表示するかどうかを設定し、いつでも表示・非表示を選択する事もできます。 1つのインジケータで表示できる最大数は4本です。 インジケータを複数起動させることで、同一画面により多くの移動平均線を表示させる事が可能になります。

The Supertrend indicator is a very versatile and and accurate trend detection system. It can also be used an an reversal indicator. Therefor you can use it either as entry or as an exit signal. Depending on your settings it is also good for trend confirmation. This version is slightly enhanced from the original version from mladen. The Supertrend of Averages Histogram Version contains: 11 different price options Averaging period
18 different averaging types ATR period and ATR multiplier Shows r
FREE

A countdown timer for the Volume bar chart generator and Tick chart generator products, which are available for download from the MQL5 Market: Tick chart generator: https://www.mql5.com/en/market/product/29215 Volume bar chart generator: https://www.mql5.com/en/market/product/47197
The counter conveniently displays the number of ticks or transactions (depending on the chart) that need to pass for a new bar to start printing.
The user can set the following indicator inputs.
Volume type
FREE

Привет. Сегодня представляем индикатор корреляции - SynchroWindowTomson. Индикатор в одном окне показывает движение нескольких инструментов, по отношению друг к другу, удобно определять направление и изменение, особенно когда вы работаете с целым портфелем разных инструментов и нужно определить какой из них тянет результат назад и движется в другую сторону. Так же видны точки разворота спреда.
FREE

All what you need before start a trade
network connection/broker's/symbols/historical orders benchmarks/currnet orders status
01. symbol's trading privilege
02. order execution mode
03. trade session hours
04. min lot/max lots
05. max pending orders
06. freeze point pending order's distant points (zero is good)
07. Min SL/TP points required by broker if open an order (zero is good)
08. account leverage
09. Margin call open an order must > 100%
10. MarginStopOut forced to close som
FREE

Tenha a boleta do ProfitChart no seu Metatrader! ........................
Agora é possível ter a boleta do profit no seu Metatrader. Envie ordens de compra e venda, acompanhe o mercado e simule estratégias em momentos de mobilidade, diretamente do seu Metatrader5. Gestão de riscos e otimização de lucros são dois princípios básicos de qualquer operação bem-sucedida. Nesse sentido, utilize as ferramentas de STOPMOVEL, TRAILING STOP, STOPGAIN E ORDENS PARCIAIS DE SAÍDA.
Funcionalidades
Description:
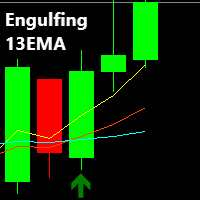
The Engulfing 13EMA is a Multi Timeframe Indicator that scans Multiple Symbols which will help you to identify potential trade set ups. As well as Forex, it can scan Crypto, Exotics, Metals, Indices, Energies or what ever else you have in your Market Watch list. You also have the option to enable/disable the time frames you want to scan. (M1,M5,M15,M30,H1,H4,D1,W1,MN1)
An alert is presented when the 13EMA passes through certain Engulfing candles, based on certain parameters wi

While M5 trend is reverse, it opens the first position according to H1 trend. It targets to get "take profit points" determined by the user. In case of reversal, it enlarges the position under certain conditions and aims to close at the break-even point.
Only for Meta Trader 5 Netting (Generally default) Accounts. The recommended currency is "EURCAD" and the recommended minimum balance is 500.
Screenshot Settings are: Take Profit Point: 300 0.01 Lot Size for Each Free Margin: 500 Maxim

This is a momentum Indicator adapted to work on lower timeframes for Boom and Crash Indeecies. However the indicator can work with other Synthetic Indecies.
The indicator trend colour is set default to Aqua, then sell signal, the colour changes to red and blue signifies buy signals. .
For non Boom nor Crash Indecies use a smaller period and slightly increase the deviation.

前書き インベストメントキャッスルインジケーターは、以下の問題を解決することを期待して作成されました。
1.さまざまな時間枠でトレンドの正しい方向を決定します。
2.ヒット率、勝率をチャートに表示します。
3.このインジケーターはチャートを再描画しません。
4.このインジケーターは Investment Castle EA に組み込まれています。
*設定されたファイル、更新などについては、Webサイトをチェックしてください: https://www.investmentcastle.com
免責事項 「インベストメントキャッスルインジケーター」とその名前が付いたすべての製品は、トレーダーが取引をサポートするために使用できるツールとして明確に見なされるべきです。これを念頭に置いて、このツールがどれだけうまく機能するか、または効果的であるかは、トレーダーの入力や最適化に完全に依存します。
トレーダーとして、投資キャッスルインジケーターを使用する前に、まずデモまたはトライアルアカウントのさまざまなパラメーターの入力設定を徹底的にバックテストすることにより、投資キ
FREE

効果的にロングとショートの指標を使用し、さまざまな資産間の相関を活用するには、いくつかの基本的なステップに従うことが重要です。
1. 指標の基礎を理解する:ロングとショートの指標の基礎的なメトリックスと計算方法に慣れること。通貨ペア、指数、または仮想通貨の相関関係を理解し、これらの資産間の正の相関または負の相関を特定します。
2. 資産間の相関を分析する:ロングとショートの指標を使用して、興味のある資産間の相関関係をモニターします。時間の経過とともに通貨ペア、指数、または仮想通貨の関係を観察し、正の相関や負の相関の傾向を特定します。
3. 正のダイバージェンスを特定する:関連する他の資産よりも強いパフォーマンスを示す資産を見つけることを目指します。これは取引の機会を示しており、強い資産が引き続き価値を上げる可能性がある一方、他の資産はより弱いパフォーマンスを示す可能性があります。
4. 負のダイバージェンスを利用する:同様に、他の資産よりも弱いパフォーマンスを示す資産に注意を払います。これも取引の機会を示しており、弱い資産が引き続き減価する可能性がある一方、他の
MetaTraderマーケットが取引戦略とテクニカル指標を販売するための最適な場所である理由をご存じですか?宣伝もソフトウェア保護も必要なく、支払いのトラブルもないことです。これらはすべて、MetaTraderマーケットで提供されます。
取引の機会を逃しています。
- 無料取引アプリ
- 8千を超えるシグナルをコピー
- 金融ニュースで金融マーケットを探索
新規登録
ログイン