YouTubeにあるマーケットチュートリアルビデオをご覧ください
ロボットや指標を購入する
仮想ホスティングで
EAを実行
EAを実行
ロボットや指標を購入前にテストする
マーケットで収入を得る
販売のためにプロダクトをプレゼンテーションする方法
MetaTrader 5のための新しいエキスパートアドバイザーとインディケータ - 87
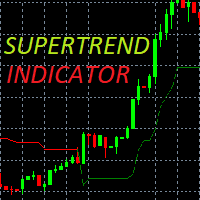
A super-trend indicator is plotted on either above or below the closing price to signal a buy or sell. The indicator changes colour, based on whether or not you should be buying. If the super-trend indicator moves below the closing price, the indicator turns green, and it signals an entry point or points to buy. If a super-trend closes above, then the indicator shows a sell signal in red. You will also note that at the point where buy or sell signal is generated is the crossover point. At the p

This EA is a Trend Following EA. It can place trades using a Fixed Lot size or Percent Risk and has an optional Trailing Stop to lock in Profits. Stop Loss is set automatically Take Profit is set using your desired Risk to Reward Ratio. Does not take trades every day for every pair. Average 10 trades per month with default settings but can have many more based on settings. Ultimate Trend Trader does not use a GRID or MARTINGALE system but simply maintains profitability by Risk to Reward (U
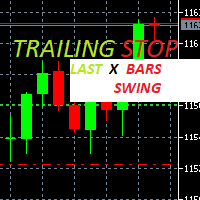
Trailing Stop loss last X candles swing high and low.
X is a value of candles you can set as an input parameter.
This Trailing stop loss moves the SL below the last X candles low(if BUY positions) or high(for SELL positions)
If we are in a trend and we open a position following the trend, the SL will be automatically placed at the low or high of the last X bars.
contact me if you need further assistence

[Target currency pair / time] [EURUSD/15M] Recommended. Variable lot MT5EA for compound interest operation!
[About EA operation]
After purchasing an EA, it is recommended to operate with a real account after operating with a demo account for a certain period of time.
[About kikyo/logic overview] Kikyo is an EA that supports EURUSD/15M. Adopts a variable lot system that can easily realize compound interest operation according to the amount of funds (the default is a fixed lot. Please c

Trend Follower predicts the possible start of a trend, the indicator uses as a basis for the closing high possibility of the indicators to identify a possible entry or low possibility, the indicator just an entry parameter which can be the period .
Input parameters Period : A positive integer that indicates the period for number
Alert: Sends an audible signal when a signal occurs
Check out other products: https://www.mql5.com/en/users/junioredj16/seller

マーチンゲール。「 Fobos iSAR 」は、15 の個別のブロック (ミニ Expert Advisors) で構成され、利益を要約し、時間の経過とともにドローダウンを分配します。
特徴: 各文字の個別の入力データ。 シンボルは繰り返すことができます (15 個の同一のシンボルでも互いに別々に取引されます)。 1 つの取引口座に、さまざまな設定で複数の「Fobos iSAR」をインストールできます (条件: Magic[i+1]>Magic[i]+15 に注意)。 任意の 1 つのチャートにインストールされます。 ヘッジ口座の種類。 4 桁のクオートを持つブローカーの場合、5 桁のクオートの場合と同様に「TakeProfit」パラメーター データを入力する必要があります (つまり、10 を掛けます)。 市場に参入するためのシグナルは、iSAR_2 インディケータを突破する価格です。さらに、iSAR_1 インディケータのデータに基づいてエントリー取引が行われます。ポジションを閉じるシグナル - テイクプロフィット。
アドバイザーは、使用する口座の取引条件に合わせて最適化する

現在、ホリデーディスカウントで399ドル! 今後値上がりする可能性があります。以下の説明をお読みください。
Ultimate Dynamic Levelsの紹介 - Ultimate Sniper DashboardのBESTエントリーインジケーター! 極めてローリスクなタイムリーエントリーと高RR!!!
アルティメットスナイパーダッシュボードはこちら。 初心者はもちろん、プロのトレーダーにとっても最も重要な能力は、いつどこで相場が転換するかを正確に判断し、いかに安全に参入し、利益を得て退場するかを見極めることです。
アルティメット・ダイナミック・レベルズ・インディケーターは、相場が転換する可能性が最も高い場所を簡単に教えてくれるので、極めてローリスクなトレードを自信を持って行うことができ、同時にチャートをクリーンでシンプルに保ちながら、$$$を稼ぐことができるのです!
アルティメット・ダイナミック・レベルズ・インディケーターは、複数の時間枠で重要な隠れたレベルを一度に見つけるユニークで強力なアルゴリズムを持っています。また、他の典型的なSRインジケーターのように、レ
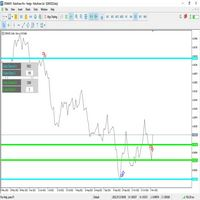
プライスチャンネルは、2つの独立したプライスチャンネルとプライスゾーンのレベルで構成されています - (A / B). このインジケータは、常に価格の挙動と動きを監視し、チャネルレベル(A / B)の破壊、レベルの再配置、極値および極小値の新しいゾーンの固定を行います。 以前の高値と現在の安値の分析については、各チャンネルのバーの数 - (A / B)に依存することはありません。 チャート上の各チャンネルに有用な情報を表示するインジケーターです - (A/B)。 1. 各チャンネルの解析で指定されたバーの数。 2. デルタ - 各チャンネルのレベル間の距離。
1. インジケータのアプリケーション例:最大値と最小値(上または下)のゾーンと新しいローカルレベルを検索して更新するために、チャネルで - (A)は、範囲を指定します - (100 - 500)バー例えば。チャンネル(B)は使いたくないので、チャンネル(B)には(0)バーを表示します。 B)チャネルの水準は、チャート上では消えてしまい、私たちの邪魔をすることはありません。 2. インジケータアプリケーションの例:狭い廊下で価

BUY INDICATOR AND GET EA FOR FREE AS A BONUS + SOME OTHER GIFTS! ITALO TREND INDICATOR is the best trend indicator on the market, the Indicator works on all time-frames and assets, indicator built after 7 years of experience on forex and many other markets. You know many trend indicators around the internet are not complete, does not help, and it's difficult to trade, but the Italo Trend Indicator is different , the Italo Trend Indicator shows the signal to buy or sell, to confirm the signal t

市場構造は、より高い時間枠でのブレイクアウトがトレーダーにトレンドをクリアするのに役立つ可能性があるものです.
1. このインディケータは最後の 2 つの構造 (ZigZag の前の高値と安値) のみに ZigZag を描画し、ZigZag の新しいバーは構造のブレークが発生したときにのみ形成されます。
2. 構造体の破壊時にターミナルとプッシュ通知を提供
3. [ と ] キーから ZigZag の Extdepth を増減して、スイングを調整します。
4. Line AB BC と CD の色を変える
5.多くのチャートに追加し、複数のシンボルでアラートを取得します
Break of Structure Multi ExtDepth Breakout Multi Symbol Scanner を探している場合は、この製品を使用できます。 Multi Symbol Multi ExtDepth ZigZag Breakout Scanner
最高の価値を見つけるために 1 年間最適化する
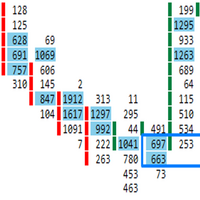
注文フローは、ボリュームを取引するという点でユニークです。 EUR/USD で作成され、1 時間足チャートで 2021 年 11 月 11 日から 2022 年 10 月 24 日まで最適化されています。 資金管理の最適化入力が使用されます。 この EA は厳格な資金管理を使用しており、一攫千金のクイック マーチンゲールや sl のない EA ではありません。 トレーディングはギャンブルではなく、リスク管理に関するものです。 EUR/USD の 1 時間足チャートで実行するか、最適化する他の資産と時間枠を見つけたい場合は、1 年間のデータで最適化します。 最高の価値を見つけるために 1 年間最適化する
注文フローは、ボリュームを取引するという点でユニークです。 EUR/USD で作成され、1 時間足チャートで 2021 年 11 月 11 日から 2022 年 10 月 24 日まで最適化されています。 資金管理の最適化入力が使用されます。 この EA は厳格な資金管理を使用しており、一攫千金のクイック マーチンゲールや sl

The fastest, most convenient, intuitive tool for opening and managing positions. Places orders by clicking on the chart. Automatically calculates the size of the position when placing it, depending on the length of the stop loss and the amount of the deposit. Similar to position calculation tools in TradingView. Allows you to add levels of stop transfer to break and intermediate takes for open positions. + partial fixation at the moment by click. Better, easier and more enjoyable to manage than
FREE
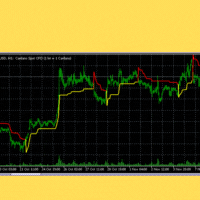
スーパートレンドは、前述のように、トレーダーがトレンドを特定し、金融資産をいつ売買するかを知るのに役立つように、オリビエ・セバムによって開発された比較的人気のないテクニカル指標です。このインディケータは、TradingView と MetaTrader のデフォルトとして見つかりません。それでも、カスタムメイドの Supertrend インジケーターを市場で見つけることができます。
チャートに適用すると、スーパートレンド インジケーターは 2 色で表示されます。これらは変更できますが、デフォルトの色は通常、赤と緑です。緑色の場合は資産を購入するシグナルであり、赤色の場合は資産を売却するシグナルです。
スーパートレンド インジケーターは、すべてのタイムラインでうまく機能します。日足チャートや週足チャートなどの5分以上のチャートのような短い時間枠で機能します。
売買シグナルを特定する 上に示したように、売買シグナルはスーパートレンド指標でよくマークされています。価格がインジケーターの緑色の部分を上に移動すると、買いシグナルが現れます。
一方、インジケーターの赤いセ
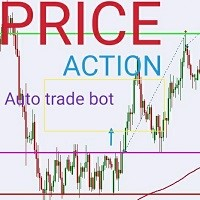
PRICE ACTION Semi-auto trade bot: (SPECIALLY DEIGNED FOR XAUUSD ) This is a simple quantitative model that trades GOLD(XAUUSD) using automatic price action analysis algorithms Place it on any symbol or timeframe. The position sizes are calculated by multiplying 0.01 per USD 500 on account to ensure low risk exposure and also leaving free margin for hedging positions that reduce the overall risk exposure . This is what leads to stability in the model though it is possible that the model like
FREE

価格チャートのマーケット セッション インジケーターは、ニューヨーク、ロンドン、東京、シドニーの取引時間を示しています。各取引セッションの開始時間と終了時間は手動で設定できます。
特徴:
メイン セッションを表示: シドニー、東京、ロンドン、ニューヨーク。 色付きの線でハイライトし、オブジェクトを描画します。 重複するセッションのセッションのボラティリティをグラフィカルに識別できます。 パラメータを含む 18 個の可動パラメータが含まれています。
シドニーセッション開始 - シドニー取引セッション開始時間 シドニーセッション終了 - シドニー取引セッション終了時間 シドニーセッションの色 - 価格チャートのシドニー取引セッションエリアの色 東京セッション開始 - 東京取引セッション開始時間 東京立会終了 - 東京立会終了時間 Tokio session color - 価格チャート上の東京取引セッションエリアの色 ロンドンのセッション開始 - ロンドンの取引セッション開始時間 ロンドンのセッション終了 - ロンドンの取引セッション終了時間 ロンドン セッションの色 - 価

Symbol Changer this Indicator for make more easy when change Chart pair, this more usefull if trader make deal with many pair.
Property Input Indicator Custom Unique ID : Indicator have Id for make different. Show Profit Loss : Adjustable for Show or no Profit and Loss Option Horizontal/Vertical button : Button can change Horizontal or Vertical. Option Window : Adjustable in main Chart as window or buttom chart as Window 1, 2 Main Pairs Preset / Own Pair : available group pair for make easy ha

Trading strategy: Scalping. The "Perfect Breakout" EA is based on a complex breakdown tactics based on Patterns. The essence of the Adviser's strategy boils down to the fact that the expert determines two or more multidirectional fractals (marks the local minimum and maximum) and places two or more pending buy stop and sell stop orders at a given distance from them. In the event of a breakdown of one of the pending orders, the expert accompanies the position: trailing stop, breakeven and smart c

--->12 DAYS OF XMAS GIFT PRICE $180 <--- WHEN DEMO TESTING USE THE SET FILE FOR USD/JPY & CAD/JPY SET FILES ARE ARE LOCATED IN THE COMMENT SECTION
STRATEGY SUMMARY & ADVANTAGES: - It's a full-automatic mid-term trading EA, with a Martingale option, no Grid. - Set Files will be given for optimal performance. - 2 Money Management Strategy (PE “Partial Exit” Very High Win Percentage & FE “Full Exit” Swing Trade until either TP is hit or Kijun Sen is crossed) - Prop Trading Compatible . - With

Non-indicator Range Trading System New edition of FX Rover advisor - improved perfomance, updated software engine and inputs.
Optimized & backtesed on real ticks with 99% quality in 2010-2022, сompatible with EURUSD, EURJPY, CADCHF, AUDNZD, AUDCHF, AUDJPY, AUDCAD. FX Rover P EA trades pending orders from the borders of the calculated range. The grid of orders is activated if necessary.
Features
Indicatorless
100% automated
Stoploss for every position (optional)
Drawdown stop
Fixed & Re

Reward Multiplier is a semi-automatic trade manager based on pyramid trading that opens additional orders with the running profit of your trades to maximize return exponentially without increasing the risk.Unlike other similar EAs, this tool shows potential profit/loss and reward to risk ratio before even entering the first trade! Download full version here ( In the mini version. Starting lot is fixed at 0.01 (or minimum allowed lot size ) Guide + tips here MT4 version here You only open the
FREE

There are thousands, if not millions, of strategies on the internet, but only less than 10% work and of those even less have stood the test of time. Very few strategies have successfully weathered the 2008-2009 financial crisis, 2020 covid effects on the markets and all other unforeseen events that have affected the market in the last 2 decades. That being said, the strategy I feature in this episode does just that, the epitome of stability as I’ll show in a 20 year back-test.
The source of
FREE

After purchasing, you can request and receive any two of my products for free!
После покупки вы можете запросить и получить два любых моих продукта бесплатно! Fully automated multi-currency trading algorithm that works only at night during a calmer market period with a unique market entry point search system. Does not use dangerous trading methods - martingale, grid and averaging. The main parameters for self-optimization are available in the EA settings. Default currency pairs USDCHF,GBPUSD,
FREE

- No Martingale
- No Grid - No high Risk Strategy.
- Target big moves - Swing - Low Risk
This EA is good for busy individuals who doesn't have time to monitor the screen at all times. Just place it on 4H Timeframe and let it do all underground work. This excellent expert advisor is not a scalper. It’s made to target greater moves and a long term big wins while minimizing losses. Long Journey EA is a sophisticated mathematical algorithm that analyzes market data, it's based

BatchLoader for Mobile Traders: The idea of BatchLoader just as the name implies is to enable traders open a single position through their mobile phone and have it duplicated based on the max position such trader set in the "input settings", we have day traders and scalpers who find it difficult to open several position when trying to scalp, with this BatchLoader, you won't have to worry about poor entry execution.. How to Use it; *install the expert on your desired chart you usually trade on(
FREE

The indicator returning pivot point based trendlines with highlighted breakouts . Trendline caculated by pivot point and other clue are ATR, Stdev. The indicator also includes integrated alerts for trendlines breakouts and foward message to Telegram channel or group if you want. Settings · Lookback bar: Default 200 is number of bar caculate when init indicator. · Length: Pivot points period · Slope Calculation Method: Determines how this lope is calculated. We supp

Robotizz Indicator is a powerful trading indicator using price action and moving averages. Robotizz indicares with arrows on long trades ir short trades, showing some TP and SL points too. It works with any symbol, even on forex markets or B3 Brazilian markets. You can configure moving averages periods, besides simple or exponential moving averages. Also it is possible to configure arrow position. Try Robotizz for one month and take a boost on your manual trades.

Hush mt5 is an advanced indicator that gives a signal about the overbought or oversold market in a certain period of time
Hush mt5 the advantage of this indicator is that it does not disappear after the signal on the chart
Suitable for any trade: forex, stocks, cryptocurrency, metals
Hush mt5 can be used on any time period. The signal goes to the beginning of the next candle after the arrow
Hush mt5 performed best on the period H1,H4,daily
It can be used in addition to forex, in binar

TransitHazard is a trading indicator system's that use one of the best trading strategy. The indicator system have input options so that you can adjust or set the strategy to work the way you would like by allowing you to set the period and other adjusting set inputs and the indicator system has color settings to set your own preferred colors. Works on all the time frames and on all the pairs. Green colored candles give a buying signal and an alert after one bar will be given so that you don't m

TransitBlueOcean is indicator system that uses ocean wave's pattern, to help one to know when to buy and when to sell. The indicator system is very powerful like the ocean waves. Join the mql5 channel for TransitBlueOcean https://www.mql5.com/en/channels/transitblueocean How to use: Zoom in so that the Ocean will appear on your chart.
Buy when you see the candles, the candle will be above the ocean wave (buying signal).
Sell when you can't see the candles, the candles will be inside the w

Assistant for all those who forget to set StopLoss, TakeProfit and Trailing Stop in deal parameters, or trade on a very fast market and fail to place them in time. This tool automatically tracks trades without StopLoss, TakeProfit, Trailing Stop and checks what level should be set in accordance with the settings. The tool works both with market and pending orders. The type of orders to work with can be set in the parameters. It can track either trades for the instrument it runs on, or all
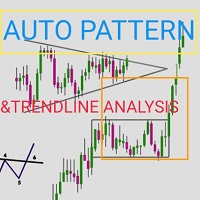
Automatic pattern recognition software for MT5 Price action analysis (automatic levels) tool: https://www.mql5.com/en/market/product/94338
Trend lines Common chart patterns eg triangles, flags, pennants etc range detection with latest support and resistance levels. object updates to avoid lagging signals. Telegram updates just place your chart ID in the inputs section and it will send you screenshots at a given interval of what is happening in the market so you do not miss out on any opportun

A problem when indicator call webrequest is "The WebRequest() function is synchronous, which means its breaks the program execution and waits for the response from the requested server. Since the delays in receiving a response can be large, the function is not available for calls from indicators, because indicators run in a common thread shared by all indicators and charts on one symbol. Indicator performance delay on one of the charts of a symbol may stop updating of all charts of the same symb
FREE

This is 3 pre-filtered CCI, Commodity Channel Index, indicators pre-filtered by your choice of 3 Smoothing and/or Averaging methods. I have found certain settings to be very reliable and I plan to incorporate this into an Expert Advisor in the future. I have added a new form of Averaging: Smoothed TEMA, or Triple Smoothed EMA, Exponential Moving Average. It gives less noise than the TEMA, but provides the smoothing of the Double Smoothed EMA, so it should be a slight bit quicker. PLEASE Download
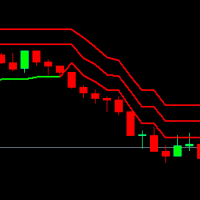
Robot usage: RSI, EMA, MFI to open trade.
RSI — Relative Strength Index — is an indicator created by Welles Wilder. The main objective for this indicator is to measure the strength of an instrument now against its history. To do it, the indicator compares price changes of up days to down days. The RSI indicator is a momentum as it shows the velocity of the upward or downward market movement, is an oscillator as it is bounded and oscillates between 0 and 100 level, and is a leading indicator a

You Can Copy All the Trades from one MT5 terminal to another MT5 terminal hosting two different accounts in the same computer or VPS. It will work with same broker as well as different broker. You can also use it to copy from MT5 to MT4, then you also need to download the MT4 version and set the SEND and RECEIVE accordingly. MT4 version download- https://www.mql5.com/en/market/product/83400 Note: While Testing with demo version, do not use real account, as it will not copy. If your trades are

Introduction and Description
Bawaba, from the Arabic word for "Grid", is a grid-based scalping robot for FOREX currency pairs. It has adjustable stoploss and takeprofits, as well as the possibility of having a fixed volume or adapting to the account balance. Grid scalping is when a grid of orders is created by increasing and decreasing prices incrementally above and below a set price. Below is a list of the different characteristics of the expert advisor: No Martingale. Grid scalping and tradin
300 downloads without review ? !!!!
If continued. I will not share any product for free. :( Small and very simple timer next to the current price to show the end time of the current candle
Very useful and important for scalpers and those who work on price action.
We assure you that we welcome any suggestions to improve this indicator and make the necessary changes to improve this indicator.
You can contact us via Instagram, Telegram, WhatsApp, email or here. We are ready to answer you.

!! BLACK FRIDAY !! FOR LIFETIME !! ================== == 35$ ONLY !! == ==================
BOOK YOURS NOW !!
The Position Manager Contains A Lot of Functions such as; (How to Operate) 1. Adjustable Volume per Trade (You could change the volume as you wish per trade). 2. Adjustable Risk : Reward Ratio (1RR means sacrifice 1 Risk : 1 Reward, 1.5RR, 2RR etc. as you wish) 3. Adjustable Stop Loss Points (Calculated Points as Stop Loss and Automatically adjusted the Risk Reward Ratio) 4. Buy Butt

The value of the MMCCI indicator is calculated based on the "Minors" and "Majors" currency pairs and is based on the original CCI algorithm. This gives us a more accurate result than if we only observed the value of the current currency pair. You can request alerts when the CCI value crosses or returns from the specified level or crosses zero. All settings can be saved in a template. Setting options:
Basic signals that can be enabled separately for the current and the previous candle: Overbou
FREE
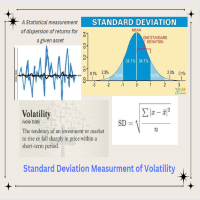
Standard Deviation Pivot Point will enhance your trading and highlight great trade opportunities with the Support and Resistance levels that professionals use based on volatility of market. Standard Deviation Pivot trading is a simple effective method for entry and finding targets that are statistically on your side, highlighting market key levels has been used by professionals for decades and is effective on all symbols: Forex, Crypto, Stocks, Indices. Standard deviation is a measurement if vol

This is an aggressive price-action Expert Advisor suitable for multiple symbols and timeframes. Due to minimal drawdown , it is suitable for small accounts using Fixed, Growth, Aggressive or Brutal risk models. See screenshot. The default parameters work best on USDJPY, GBPUSD, EURUSD on H1 timeframe. You can tweak the settings of the Scalper and find the best parameters for a given symbol and timeframe. Stop-loss of 50 points is recommended.
WARNING : Minimum account balance is $50. Before u

Auto Fibo は、手動での取引を強化するために開発されたインジケーターです。自動で黄金比を描き、時間を節約し、取引を円滑にします。 グラフにインジケータを取り付けると、自動的に正確な黄金比が描かれるので、臨界点を探す手間が省けます。 インターフェイスは、お使いのコンピュータに応じて、バンドのおおよそのハイポイントとローポイントに調整されます。 このインジケータは、ほとんどの始点と終点の選択ミスを修正します。 各バンドには、正確な価格が表示されます。 警告 私はMQL5.comで私のEAを販売するだけです。もし誰かが私のEAを売ってくれと連絡してきたら、それはあなたのお金が欲しいだけの詐欺師です。
また、もしあなたが私のEAを外部のウェブサイトから購入した場合、それは偽のバージョンであり、オリジナルのものと同じようには動作しないことを保証します。
FREE

ナスダック クオンツ NAS100 PROMOÇÃO :1200 USD PROXIMO PREÇO:1950 USD
Expert Nasdaq は、安全に利益を得るために設計された動的かつ最適化されたスキャルパー取引システムです。ニューラル ネットワークの最適化に基づくリスク管理と、残高利益に基づくスマートなロット増加システムを備えた完全なシステムは、初心者と経験豊富なトレーダーに適しています。モバイル指値注文を使用し、市場のプルバックを利用して、より短く安全なストップを提供できます 賞金をカバーできます デフォルト設定を使用するか、ブローカーに最適化されたセットアップをリクエストすると、当社が作成します
正しいバックテストを行うには、まずメタトレーダーで NAs100 アセットの履歴データをダウンロードする必要があります!
エキスパート ナスダック クオンツ NAS100 にはスマート システムとドローダウン削減アルゴリズムが組み込まれており、主に価格が損失ゾーンに入る前に注文を閉じることができます 保留中の注文と成行注文の迅速な実行を備えた完全なダッシュボードを備
Multi Symbol ZigZag Breakout Scanner は、マーケットウォッチで選択されたすべてのシンボルをスキャンします。
価格がこれらのレベルに到達しようとしているときに、ダブル トップ、ダブル ボトム、または任意のフィボナッチ エクステンション レベルを簡単に見つけるのに役立ちます。
Timeframe と、Zigzag の複数の Extdepths (最大 3 つ) を選択できます。 推奨される ZigZag は 21、34、および 55 で、すべてのタイプの Zigzag とフィルター ノイズをカバーします。
端末アラートまたはプッシュ通知のいずれか、または両方を受信するように設定できます
Multi Symbol ZigZag Breakout Scanner は、マーケットウォッチで選択されたすべてのシンボルをスキャンします。
価格がこれらのレベルに到達しようとしているときに、ダブル トップ、ダブル ボトム、または任意のフィボナッチ エクステンション レベルを簡単に見つけるのに役立ちます。
Timeframe と、Zig

I do not have the exact indicator for MT4 but the nearest possible look alike can be downloaded from here . Also you may check this link . This is the exact conversion from TradingView: "Donchian Trend Ribbon" By "LonesomeTheBlue". One of the coolest indicators out there to detect trend direction and strength. As a trader you always need such indicator to avoid getting chopped in range markets. There are ten buffers as colors to use in EAs also. The indicator is loaded light and non-repaint. Not

To download MT4 version please click here . - This is the exact conversion from TradingView: "Linear Regression Candles" By "ugurvu". - The overall look of the indicator is like Heiken Ashi. - It can be used as a trend confirmation indicator to detect the right trend direction. - This indicator lets you read the buffers for Candles' OHLC. - This is a non-repaint and light processing load indicator - You can message in private chat for further changes you need. Thanks

インディケータは現在のクオートを作成し、これを過去のものと比較して、これに基づいて価格変動予測を行います。インジケータには、目的の日付にすばやく移動するためのテキスト フィールドがあります。
オプション:
シンボル - インジケーターが表示するシンボルの選択;
SymbolPeriod - 指標がデータを取る期間の選択;
IndicatorColor - インジケータの色;
HorisontalShift - 指定されたバー数だけインディケータによって描画されたクオートのシフト;
Inverse - true は引用符を逆にします。false - 元のビュー。
ChartVerticalShiftStep - チャートを垂直方向にシフトします (キーボードの上下矢印)。
次は日付を入力できるテキストフィールドの設定で、「Enter」を押すとすぐにジャンプできます。

Martini EA は、2 年間のライブ アカウント履歴記録を持つ外国為替取引のエキスパート アドバイザーで、特に特定の外国為替ペアの取引用に設計されています。5 分間の時間枠のスキャルパーであり、その戦略は取引量の少ない時間帯に基づいています。取引量が少なくニュースがない夜間の数時間取引することで、精度を最大化し、リスクを最小化します。 参加する MQL5 グループ より役立つ情報や製品のアップデートをお届けします。 毎日のアップデートやニュース、最新のセット ファイルについてメンバー間で話し合うプライベート グループへの参加も歓迎します。プライベート グループ リンクを取得するには、私に連絡してください。 ライブアカウントシグナル MT4バージョン 期間限定価格 499 ドル | 次回価格 599 ドル
***Martini EA MT4を購入すると、SafeGold Scalping EAとW Drive Forex AI Proを無料で入手できます!*** 詳細についてはプライベートでお問い合わせください! 主な特徴 夜間の FX マスター: 「Martin

BC Juice mt5 (ビッグ キャンドル スキャナー) は、ポートフォリオに入れるべき強力なツールです。その最も重要な特徴の 1 つは、85% の確率で市場で「反転」を見つけた場合に成功する可能性が高いことです。
Martin Gale や Grid を使用していません。これは、Heiken Ashi インジケーターによって提供されるトレンドの独占的な確認に加えて、非常に十分に根拠のある実績のある戦略です。
Experts Advisor は、反転の可能性が高い領域に参入しようとしますが、市場の急激で強い動きは、この EA の運用にとって最良の味方であることが確認されています.不安定で不安定な BC Juice mt5 EA は、経済カレンダーの金融ニュース レポートの恩恵を受けており、世界経済の不安定性によって生じる市場の潜在的でつかの間のターンを利用するのに理想的な EA です。
BC Juice mt5 EA のデモをダウンロードして、その見事なパフォーマンスをご自身で確認してください。AUD/USD ペアですぐに使用できる構成が付属しており、最近の最適化はわ

同時に機能する多くのシンプルな戦略を組み合わせた多通貨エキスパート アドバイザー。各戦略は、ボラティリティの高い市場の瞬間における単純な取引アルゴリズムに基づいています。各戦略は、過去 5 年間にわたって最適化されてきました。 Expert Advisor は、「群衆の正しさ」の統計原理を使用します。異なる戦略からのシグナルを平均化し、好ましい方向に市場ポジションを開きます。 この原則は、相関する取引手段に関する同時作業とともに、不利な市場フェーズへの耐性と成長期間の分布の均一性を大幅に高めることを可能にします。
オプション
予想される最大ドローダウン (%) -- 予想されるおおよその最大ドローダウン。これにより、ドローダウンが設定値を超えないように、開いているポジションのパラメータが自動的に選択されます。このパラメーターは、過去 5 年間のテスト データに基づいており、今後の作業中に発生する可能性のある実際のドローダウンは、上下の両方で、宣言されたものとはわずかに異なる場合があります。 取引用定期預金 -- 取引に使用する資金の固定額を設定します。開かれた

BUY INDICATOR AND GET EA FOR FREE AS A BONUS + SOME OTHER GIFTS! ITALO VOLUME INDICATOR is the best volume indicator ever created, and why is that? The Indicator works on all time-frames and assets, indicator built after 7 years of experience on forex and many other markets. You know many volume indicators around the internet are not complete, does not help, and it's difficult to trade, but the Italo Volume Indicator is different , the Italo Volume Indicator shows the wave volume, when market

アラートメールを送信することにより、アカウント情報をリアルタイムに知ることができるツールです。
アラートの機能は次のとおりです。
1. フローティング損益アラート、設定した利益額と損失額に達すると、EAから自動的にアラートの詳細がメールで送信されます。
2. 2. 注文の開始と終了のアラート、あなたのアカウントにオープンポジションとクローズポジションがあると、EAは自動的に電子メールで詳細なアラートを送信します。
3. 3. 複数シンボル気配値アラート:お客様が設定した気配値が上昇または下降すると、EAが自動的にアラートの詳細をEメールで送信します。
上記全てのアラート回数をカスタマイズすることができます。
使用方法
1. MT5クライアント-ツール-オプション-電子メール ,電子メール設定を完了し、それを有効にします。
2. MT5クライアントにEAをロードし、自動売買を有効にします。
EAのパラメータ設定の説明
損益アラートのパラメータは以下の通りです。
1. TPは利益額、SLは損失額を設定し、その額はFloating P

A new generation progressive indicator from INFINITY. Predictor PRO uses its own entry and exit calculation strategy. Indicator without redrawing signals! This is very important for real trading.
The indicator can be used for any currency pairs, metals, cryptocurrencies or indices. The best time of the H1 chart.
Unlike other indicators, Predictor PRO shows shows the Buy/Sell entry point and the Close exit point. Calculating the profit of all signals in points on the panel helps to choose th
Next Candle Timer Pro displays the remaining time before the current bar closes and a new bar forms. It can be used for time management with trade to wait next moments. Feature Highlights Tracks server time not local time Configurable Text Color and Font Size Optional Visualization of the Symbol Daily Variation Optimized to reduce CPU usage Every time frame will automatic get remain timing. Input Parameters Color as Label Anchor of the label a sort assign Position of timer: true/false Text Font

Free TrendLine EA opens trades whenever the price on the chart interacts with or crosses your trend line. You simply draw the trend line manually then let the EA do the trading automatically according to the rules you give it. The settings available in the EA are explained below: Lots : The lot size for trading. RiskPercentage : Set a value other than zero to activate lot sizing by use of percentage of margin. TrendLineName: The name of the line to track. You can either * rename the trend li
FREE

Hello! I am a professional trader with experience trading on the Forex and Moscow Exchange margin markets. Trading in total for about 14 years. For all the time of trading, I have gained tremendous knowledge, experience and understanding of the essence of the market. I want to tell you that for a beginner, the market seems like a place to make easy profits. But this is an illusion and a big mistake. The market changes all the time, volatility changes, trends are replaced by flats, and flats by t

Bill Williams' divergent bar with angulation. The angle between the green line and the top/bottom of the bar is used as an angle, which basically corresponds to the updated recommendations from Justin Williams Angulation for the Wiseman Bullish and Bearish Divergent Signal Bar - YouTube . The default settings of the angle of 85 and 21 bar from the moment of crossing the lip line of the Alligator work quite well. If you use this indicator in real trading, I highly recommend not to engage in day
FREE

This indicator will mirror the assets in use in another metatrader, being able to choose the timeframe and a template. This is the Metatrader 5 Client, it needs the Metatrader 4 or 5 Server versions: Metatrader 4 Mirror Chart Server: https://www.mql5.com/en/market/product/88644
Metatrader 5 Mirror Chart Server: https://www.mql5.com/en/market/product/88652 Details of how it works in the video.
FREE
This indicator will mirror the assets in use in another Metatrader, being able to choose the timeframe and a template. This is the Metatrader 5 Server, it can work with Metatrader 4 or 5 Client versions: Metatrader 4 Mirror Chart Client: https://www.mql5.com/en/market/product/88649
Metatrader 5 Mirror Chart Client: https://www.mql5.com/en/market/product/88650 Details of how it works in the video.

BETA product Recurring updates, and real-time assistance. Ea Auto is a specialist in inserting TakeProfit and StopLoss of positions, and moving them in favor of operations in an automated way, the user only needs to enter the initial TakeProfit and StopLoss value.
Recommendations on use in any asset In any period Chart So far, this utility only supports Forex
Description of input parameters Theme: set between Light (a lighter theme) and Night (a darker one) Take Profit(points): field wher

Outbreak is a fully automated robot that follows breakouts in EURUSD. It opens several trades a day and closes them the same day. Always just one order open with StopLoss. More than 80% of the trades are profitable in historical backtests and in the Live trading signal >>
Live tradingl of the second strategy here >>
NO m artingale, grid trading or other dangerous method used, that at the end erases your account. Usually Outbreak is scalping the market, cutting small profits
The Black Swan Trading Panel was designed and built to make trading as easy as possible. Track any trading instruments with multiple time frames on one chart and thus have a complete overview of the market situation. The Black Swan Trading Panel uses three custom indicators that will give you a clear overview of the market situation regarding trend, price deviations and support/resistance zones. This indicator is highly customizable and therefore suitable for every type of trading. With this too

( MT5 FILES ) For MT4 version : https://www.mql5.com/en/market/product/88697 Capability
MT4 to MT4, MT4 to MT5, MT5 to MT5, MT5 to MT4 Features Minimize button Close All button ROLE selection : Master / Client Master pairing : direct input Indicator lamp : Green -> Master distributing signal. Blue -> Client connected to the Master. Red -> Master key pairing not found. Master Features Reset button : Resetting the account list to the ea input. Add account : input the client account

To download MT4 version please click here . The Volume Oscillator measures volume by analyzing the relationship between two Moving Averages. The Volume Oscillator indicator subtracts a fast MA from slow MA. The fast and slow MA periods are configurable via input tab. Volume indicators are an ingredient of trading systems to avoid entry in thin liquidity markets. Having set a threshold on Volume Oscillator you can avoid entering chop. Buffers are available to access via EA.
FREE

A supply and demand indicator designed with a minimalist trading strategy based on the nature of the market. Indicator type: Price Action indicator The Bull zone is a strong support area, and the Bear zone is a strong resistance area. When a Bull zone was breakout, it becomes the "base" of the Bears and vice versa. When the price meets these areas, there is a high probability that the price will reversal , so we call them Obstacles. It is a suitable indicator for traders interested in manual pr

Hello ! If you scroll in one chart, all charts will be scrolled If you change the time frame in one chart, it will change in all charts Of course, you can turn this feature on or off All the charts in which you want changes to be applied are specified through ID in the indicator settings You can scroll the charts of different time frames in two ways at the same time 1: Coordinated based on time That is, 1 hour candle is 60 candles one minute back 2: scroll in the form of number of candles That i
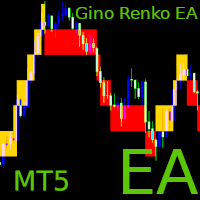
Here is an EA based on the Renko indicator, it can be used with currencies, commodities, and forex. Just associate it with the corresponding graph.
The indicator used for the EA is available here, but it is not necessary for its operation, they are 2 independent products: https://www.mql5.com/fr/market/product/87852?source=Site +Market+MT5+Indicator+Search+Rating006%3agino+renko
Personally I don't like renko like EA, and I haven't done any tests to find out which configuration is the best.

This EA helps to Close all Positions opened. It saves you the time of closing multiple positions manually.
Parameters: Buy: Close Buy Positions Only Sell: Close Sell Positions Only Buy & Sell: Close Buy & Sell Positions Pending: Close Pending Orders
More Advanced MT5 version available at: https://www.mql5.com/en/market/product/93301?source=Unknown%3Ahttps%3A%2F%2Fwww.mql5.com%2Fen%2Fmarket%2Fmy More Advanced MT4 version available at: https://www.mql5.com/en/market/product/93468?source=U

To download MT4 version please click here . This is the exact conversion from TradingView: "RSI versus SMA" By "JayRogers". This indicator lets you read the buffers for all Lines on chart. Note: This is an indicator, Not an expert. Meaning It does not take trades. If you want the EA please contact via message. You can easily use the indicator to understand the logic behind trades that the TradingView strategy takes. The strategy is profitable if this indicator is applied to the right symbol at
FREE

Lumos Lumos is a multifunctional trading assistant. It gives an overview of the current market situation for a better decision making. The strategy tester only provides a visualization of the application. Lumos is highly customizable and gives you information in multiple timeframes about: MAs, price structure, RSI, RSI MA and an overview of the price distance to possible SLs.
FREE
MetaTraderプラットフォームのためのアプリのストアであるMetaTraderアプリストアで自動売買ロボットを購入する方法をご覧ください。
MQL5.community支払いシステムでは、PayPalや銀行カードおよび人気の支払いシステムを通してトランザクションをすることができます。ご満足いただけるように購入前に自動売買ロボットをテストすることを強くお勧めします。
取引の機会を逃しています。
- 無料取引アプリ
- 8千を超えるシグナルをコピー
- 金融ニュースで金融マーケットを探索
新規登録
ログイン