YouTubeにあるマーケットチュートリアルビデオをご覧ください
ロボットや指標を購入する
仮想ホスティングで
EAを実行
EAを実行
ロボットや指標を購入前にテストする
マーケットで収入を得る
販売のためにプロダクトをプレゼンテーションする方法
MetaTrader 5のための新しいエキスパートアドバイザーとインディケータ - 84

任何交易者的最佳伙伴! 该EA加载后: 1.可以对无止损止盈的订单自动设置止盈和止损. 2.可以对盈利订单在盈利一定设置幅度后保护盈利 3.可以移动止盈止损
特性 1.可以对无止损止盈的订单自动设置止盈和止损.
2.可以对盈利订单在盈利一定设置幅度后保护盈利
3.可以移动止盈止损 自动止盈止损设置 自动设置止损止盈的开关
固定止损的点数设置 固定止盈的点数设置 自动使用波幅自动计算的TP设置 波幅自动计算的TP的风险系数设置 超过一定开仓时间的订单不再设置止盈止损. 止损保护设置 止损保护开关
止损保护启动点数设置 盈利保护点数设置
止损移动设置 移动止损开关
移动止损启动点数设置 移动止损回撤点数设置
有任何问题,欢迎交流...

Trend Dynamics Expert Advisor is a level trader designed to be as precise as possible.
Because of the extreme accuracy of the entries and the algorithms ability to filter out bad trades, the system does not take new trades every day.
The system was not optimized and has fixed indicator settings as its universally adaptable.
Be aware, that its recomended to run multiple pairs on the same account for more profit. Our Goal is to help you be way more profitable and way more stress free, so yo
Currency Pair Splitter, calculates the value of an individual country and display it's fluctuations and trend over a given period. It has three lines which gives a mean price for a given period of time. This product is accurate in determining the actual direction of a country economic growth and strength as a result of economic events happening in a country. It shows an optimum price where a currency can deviate. Example For a pair EURUSD . this indicator Calculates the Value of the Numerator E

This indicator plots the volume profile by Price on the chart
There are 5 ways to view it:
By Total Volume Traded; Volume Ticks(Forex) Separated by Buyers and Sellers; Buyers Only; Sellers Only and; Business balance (Buyers - Sellers).
It is possible to select how many days the profiles will be calculated.
On the current day it recalculates the histogram data for each new candlestick.
Another feature is to select the highest trading range by entering the desired percentage.
Th
FREE

Open Multiple Trades on MT5 in 1 click at one price. Enter the Symbol you want to trade Enter the Lot size Specify the number of trades you want to open Choose from a dropdown list whether you want to buy, sell, sell limit, sell stop, buy limit, buy stop If they are pending orders, state the number of pips away from the current price that you want to set the trades. Once you are done, click Ok and see the script open your trades in an instant What to Always Note Check the minimum stop levels f

対称的な三角形のチャートパターンは、価格が上昇または崩壊することを余儀なくされる前の収縮と統合の期間を表しています。下のトレンドラインからのブレークアウトは新しい弱気トレンドの始まりを示し、上のトレンドラインからのブレークアウトは新しい強気のトレンドの始まりを示します。
MT4バージョンはこちらから入手できます:https:// www.mql5.com/en/market/product/68709/
このインジケーターはこれらのパターンを識別し、4つのキーポイントが形成され、価格が再び三角形に戻ったときにアラートを出すので、潜在的なブレイクアウトの準備をすることができます。対称的な三角形は常に完全に対称であるとは限らず、価格は上下する可能性がありますが、通常、最も成功するブレイクアウトは、三角形の最初のポイントを形成した高または低の方向です。したがって、インジケーターはブレイクアウトに対して強気または弱気のバイアスを与え、色分けされ、その特定の方向を警告します。一方向だけで取引を行う必要はありませんが、どちらの方向へのブレイクアウトも可能ですが、最初のポイントのトレンドに

トレーダーのベストパートナー! 取引アシスタントの操作手順 基本的な使用設定 基本: 言語選択スイッチをサポート (現在中国語と英語をサポート) 自動言語認識 バインディングをサポート ポジションを開閉するホットキー 、ショートカット キーを使用してポジションをすばやく開閉します... ポジションを閉じるためのショートカット キー。 ロック解除はほとんどの機能をサポートします リプレイ で使用できる操作 テスト環境 オープンポジションとクローズポジション: ワンクリックでポジションをオープン ( テイクプロフィットとストップロスの便利な設定、ロットサイズの自動計算などの便利な機能を含む) ワンクリックで閉じる (ロック)、ミニマリストスタイルのデザイン、クローズポジションのタイプ、クローズポジションのタイプ(ロング注文、空の注文、または未決注文)、利益が0より大きい注文をクローズするかどうか、損失注文をクローズするかどうか、クローズ率の設定(0〜100%)、クローズを反転するか

Expert Advisorsの戦略は、Facebook Group EANationから生まれました。このグループには4万人以上のメンバーがいます。新しいろうそくごとにヘッジ取引を開始し、ポジションが取引の負け側にあるときにグリッドを開きます。
平均グリッド= N
=現在の小節の前の6小節の合計/ N
時間枠=新しいバーが表示されたときに新しいヘッジ取引を開始します
自動ロット= 1ロットは、10,000ドルのロットサイズが0.01になることを意味します
NO MORE HEDGE =片側がNトレードに達すると、TPになるまでヘッジトレードを開始しません
クロージング戦略= TP 1は、トレードの反対側のグリッドサイズです。
= TP 2-6 =パーセントで
パラメーター:
-平均グリッド
-AGタイムフレーム
スプレッドフィルター
-最大スプレッド
- 時間枠
資金管理

This indicator shows the TLH and TLL and some trendlines that allow us to estimate the trend of market. It also shows the values of the angles of the lines in percentage in points (pip) , the standard deviation, and the trend of each line, and when it breaks the lines of support and resistance (TLH and TLL). And finally, it also shows the points identified as supports and resistances through the fractal algorithm in the graph. The high and low trend lines are supported by the highs and lows, th
FREE

The SM_GOLEM EA Expert Advisor is designed to work on accounts with an initial deposit of 100 units or more. On cents, it is desirable to use at least 3000 units. The algorithm of the Expert Advisor works as follows: entering a trade at the beginning of the bar with a growing signal of the ROC oscillator, exiting the market at the end of the bar when the CCI (Commodity Channel Index) is below the level line. The Expert Advisor was optimized on an hourly timeframe, since it was supposed to be us
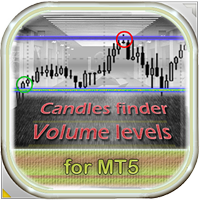
This EA identifies trading candles that often foreshadow a market reversal and finds volume accumulation levels in the trading history. It opens trades if a candlestick like "Doji" or "Engulfing" appears at the volume level and the price seems to be repelled from the level. To make its strategy clearer to users, it can display volume levels and signal candles (thanks to its good display, it can be used as an indicator). In the strategy tester, some display functions do not work correctly, so wat
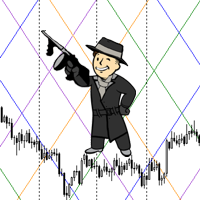
The script statistically reveals the main rate of movement (Gan angle) for the selected instrument. Using mathematical methods, it determines the speed of following the candles of the current timeframe against the background of the older one. Just place AutoGan on the graph and it will perform the required calculations and correctly draw the Gan grid.
The script is very easy to use, only the colors of the grid lines are set in the parameters.
Parameters:
GRID_COLORING : How many colors to

For those who love to trade using the Heikin Ashi Candlesticks, here it is one more powerful ally: Heikin Ashi Volume . This indicator is an exclusive idea and creation from us at Minions Labs for you. The idea behind this indicator is to have a visual cue over the Heiken Ashi candles pointing at those candles with big volume. For this to happen you can choose between 2 different techniques of identifying the "high" volume: Higher Volume above the last N previous bars average. Higher Volume segm
The first currency based indicator to draw a distinction between map and strength. The map shows the currencies in terms of oversold/overbought levels and gives the direction of travel. The currency strength calculates and shows the strength of that move. Alerts are included for changes in currency direction on the map (confirmed over two bars) and also when the strength reached the appropriate level. The currency map is useful for finding currency pairs to trade and in which direction. Look fo

The EA uses cross-trading for several currency pairs at the same time, taking into account the total profit. Trade is seen in groups, in each group there can be 2 - 8 currency pairs at the same time. Trading signals come from 6 timeframes: М1, М5, М15, М30, Н1, Н4. The EA uses the following indicators: MACD, Standard Deviation, Commodity Channel Index. The EA uses a hidden one: stop loss, take profit, breakeven, trailing and the minimization of stop loss towards profit. The EA does not requir

移動平均線クロス、ボリンジャーと移動平均線のクロス、移動平均線の角度でサイン表示
MT5インジケータ こちらに サイト があります。 このインジケータは3つのパターンでサインを表示(切り替え可能)します。 ① 移動平均線のクロス ② ボリンジャーバンドと短期移動平均線とのクロス ③ ボリンジャーバンドと短期移動平均線とのクロスと、中期移動平均線と長期移動平均線の角度 ⓸ ボリンジャーバンドと短期移動平均線とのクロス(サインを交互に表示) 移動平均線のクロス 指定した短期移動平均線と長期移動平均線のゴールデンクロスでは買いサイン、デットクロスでは売りサインを表示します。 ディフォルトでは短期は5,長期は20となっています。 もちろん変更可能になります。 移動平均線の種類をEMA(指数平滑移動平均線)やSMMA(平滑化移動平均)などに変更可能で適する価格も変更可能になります。 ボリンジャーバンドと短期移動平均線のクロス ボリンジャーバンド(以降BB)と短期移動平均線のクロスでサインを表示します。 ディフォルトではBB+1σと5MAのゴールデンクロスで買いサイン、BB-1σと5MAのデ
An indicator of patterns #32 and #33 ("Measured Move Up/Down") from Encyclopedia of Chart Patterns by Thomas N. Bulkowski. Parameters: Alerts - show alert when an arrow appears Push - send a push notification when an arrow appears (requires configuration in the terminal) PeriodBars - indicator period MinMovment - minimum movement value (in points) BackMovment - maximum value of return movement (as decimals) ArrowType - a symbol from 1 to 17 ArrowVShift - vertical shift of arrows in points Sh

order flow indicator that monitors price formation effectively identifying market direction. As it is an extremely fast indicator, it should be used in support and resistance, static and dynamic regions, the OrderFlowWay will predictively indicate the veracity of breakouts that have not happened yet, showing whether there is action by big players in the traded price. Operations must be carried out after crossing the lines, preferably close to the zero axis of the indicator.

Close all your trades or some of them with this script. If you have multiple trades open on a symbol and you want to close all of them just drag the script onto the chart and close the trades without delay. The Script will ask you how many trades you want to remain open... In case you want to close all trades just click OK Say you want to leave 1 position open out of 7, just type in 1 and click ok. Script closes trades faster than EA because it does not wait for the market to move but rather
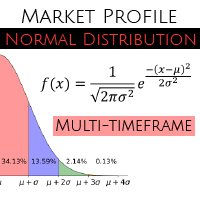
MT4 version - https://www.mql5.com/ru/market/product/69932
Unlike other indicators of this type, this version has: The ability to display data from smaller timeframes on the current chart. For example, displaying data from the M1 period on the H1 chart. Calculation of values using the Gaussian formula (normal distribution formula). Flexible system of settings. Settings: basePeriod - base period. indicatorMode - display mode. Sets the value of each interval: by4h (4 hours), by6h

This is the EA version of the Kenko Trend Indicator mt5. It follows the trend on all instruments and trading pairs according to my improved step and ladder technique.
INTRODUCTION For anyone studying forex charts, the aim is to identify trends, and spot reversals. If you have years of experience it may be easy, but most of us need something to make the trend apparent. If you're familiar with the popular renko charting method, you know that it was developed for this purpose. But renko cha

Indicator that will show your Balance , and your Equity . Really simple to use, no specific requirements to install it. However you can deeply configure it for your own wishes. The pannel has 4 buttons. Only current will display the information of the chart you linked the indicator. If this is deselected, you will have the information of the whole account. Only Buys will display only the BUY orders and Only Sells will display only the SELL orders. Show Zero will display the 0
CRIANDO OPORTUNIDADE COM ROBÔ INVESTIDOR
O curso “Criando Oportunidade com Robô Investidor” é destinado para pessoas que acreditam serem capazes de gerar suas próprias oportunidades no mercado digital , através da programação de sistemas automatizados você será capaz de criar seus próprios robôs e executar suas operações operando seu próprio capital ou de terceiro, além de descobrir onde e como vender seus robôs.

Indicator tested for 7 years with excellent results when used correctly An order flow tracking indicator when used at support and residence points simply shows the direction of the Big Players, validating good opportunities seek optimal risk-adjusted returns on their investments. Use when Flow line crossing at signal line after candle closed , works with absolutely everything
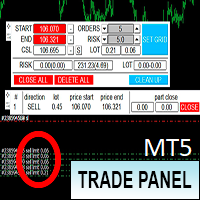
Торговая панель предназначена для установки сетки ордеров с различными параметрами. Добавлено все что есть у версии для МТ4. Предназначена для форекс счетов с хеджированием. Имеет несколько основных функций по установке ордеров в заданном диапазоне и с заданным риском, закрытию части ордеров из сетки, переносом в безубыток, закрытие части по профиту на определённом уровне, а также отображает информацию по текущему риску и отображает все сетки которые были выставлены по определённой паре при этом

Painel informativo fácil de usar e pode ser usado em qualquer gráfico . Painel Pega o Resultado Por Numero Magico Somente para plataforma Metatrader5. Painel informa todos os resultados do dia sendo positivo ou negativo, Lucro e muito mais. Fácil de usar e pode ser colocado facilmente dentro de um Robô . Muitas pessoas precisam de diferentes paineis para cada tipo de EA, ou seja, pode se tornar cansativo fazer um novo para cada aplicação. Portanto decidi fazer um painel modular que se adapta ao
FREE

マトリックスアローインジケーターMT5は、すべてのシンボル/商品(外国為替、商品、暗号通貨、インデックス、株式)で使用できる100%再描画されていないマルチタイムフレームインジケーターに続くユニークな10in1トレンドです。マトリックスアローインジケーターMT5は、初期段階で現在のトレンドを判断し、最大10の標準インジケーターから情報とデータを収集します。
平均方向移動指数(ADX) 商品チャネルインデックス(CCI) クラシック平研アシキャンドル 移動平均 移動平均収束発散(MACD) 相対活力指数(RVI) 相対力指数(RSI) 放物線SAR ストキャスティクス ウィリアムズのパーセント範囲 すべてのインジケーターが有効な買いまたは売りシグナルを与えると、対応する矢印がチャートに印刷され、次のろうそく/バーの開始時に強い上昇トレンド/下降トレンドを示します。ユーザーは、使用するインジケーターを選択し、各インジケーターのパラメーターを個別に調整できます。マトリックスアローインジケーターMT5は選択されたインディケーターからのみ情報を収集し、それらのデータのみに基づいてアローを印

このプロジェクトが好きなら、5つ星レビューを残してください。 インスタグラムでフォロー:borelatech このインジケータは、時間のための再開のコンパクトなカウントダウンクロックを描画します
キャンドルを閉じると: チャートの任意の角に配置することができます。 複数のタイムフレーム; MT5のナビゲーターからドラッグすることでインジケータウィンドウに追加できます。 ろうそくが10秒残っていると色が異なります。 チャートとのより良い統合のためのカスタマイズ可能な色。
FREE

This script is for changing all open tabs/charts at once on MetaTrader 5 using the drop-down box once the script has been initialized. It has all the standard timeframes available to be selected for MetaTrader 5. This is an individual script for all timeframes. You will need to select the timeframe you want all charts to go. Please watch the video for the installation instructions.

他のEAを無料で入手!!!他のEAを無料で入手!!!他のEAを無料で入手!!!他のEAを無料で入手!!!他のEAを無料で入手!!!
RSIグリッドはRSIの買われ過ぎと売られ過ぎの条件に基づいており、取引が市場の負け側にあるときにグリッドを開きます。 RSIはテクニカルトレーダーに強気と弱気の価格の勢いに関するシグナルを提供し、多くの場合、資産の価格のグラフの下にプロットされます。資産は通常、RSIが70%を超えると買われ過ぎと見なされ、30%を下回ると売られ過ぎと見なされます。
パラメーター:
タイムフィルター
月曜日
火曜日
水曜日
木曜日
金曜日
土曜日
日曜日
始まる時間
終了時間
RSI設定
RSI期間
買われ過ぎ
売られ過ぎ
時間枠
資金管理
Autolot
最大ロット
利益を得る
グリッドサイズ
乗数
トレーリングオプション
トレーリングストップ
トレーリングステップ
トレイルオフセット
ファイルを設定する
v1.8GBPUSDセット1

このインジケーターは、チャート上の重要なテクニカル レベルを表示します。 これらのレベルは、価格変動のサポートまたはレジスタンスとして機能します。
最も重要なレベルは 100 ポイントと 50 ポイントの倍数です。 レベルを 25 ポイントの倍数で表示することもできます。
価格がそのレベルに達すると、アラートまたはプッシュ通知が表示されます。
MT4のバージョン https://www.mql5.com/ja/market/product/69486 設定 Show Levels 100 pips - レベルを 100 pips の倍数で表示します。 Show Levels 50 pips - レベルを 50 ピップスの倍数で表示します Show Levels 25 pips - レベルを 25 ピップの倍数で表示します Color Levels 100 pips - 100 ピップで割り切れるレベルの線の色 Color Levels 50 pips - 50 ピップスで割り切れるレベルの線の色 Color Levels 25 pips - 25 ピップで割り切れるレベル
FREE

Display Order box list from Trading box Order Management tool. Find contacts and manual links on my profile . This dashboard gives you an edge in forex trading because in few seconds you can decide which pair and timeframe is worth to watch more closely. This is how you will not be distracted by all other forex pairs that you trade, and you will not miss great opportunities to trade the best price.
Trading Dashboard (order box overview panel and Trading box Order management extension) Tr
FREE
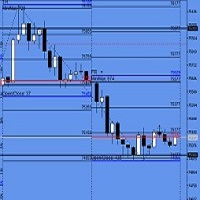
Open close levels.
Open close levels - is an indicator for MetaTrader 5, which displays High/Low, Open/Close, ATR levels (set manually) of the day, week, month on the chart. Marks round levels, signs the days of the week, numbers every week. All levels are marked with price tags with a price symbol. Also, the indicator automatically calculates and displays on the chart the distance that the price has passed from High to Low and from Open to Close by day, week and month.
The indicator di

Steady Flow MT5 is a fully automated system which has been developed to make strategies compatible with price action patterns. Protected by stop loss and take profit The Expert Advisor does not use martingale, grids, hedging, averaging and other risky strategies Enable or disable news filtering according to user needs Continuously generating profits Can trade full time in all conditions Works well in all market conditions, either trend or sideways This EA has passed 18 years back test of tick

Automatically plots the 'Golden Fibonacci Ratio’ between the High and Low of the previous day... ...Highs and Lows are great Support and Resistance zones.
Breakouts of Fibonacci levels are key points for entry and exit of trades.
Pink lines indicate that the previous day's Candle closed lower. Blue colored lines indicate that the previous day's Candle closed higher.

For anyone studying forex charts, the aim is to identify trends, and spot reversals. If you have years of experience it may be easy, but most of us need something to make the trend apparent. If you're familiar with the popular renko charting method, you know that it was developed for this purpose. But renko charting has a flaw; the trend is often broken by false reversals. So I developed my own version - the Kenko Trend Indicator. The kenko trend indicator draws renko style trend following block

One of the most famous phrases in the trading world is "The Trend Is Your Friend".
Trading following the current trend is one of the most successful ways in terms of probability. The hard part of it is to recognize when the market is trending or not.
that's the role of our indicator we called The Trend Is Your Friend Until It Is Not. Apart from its big name it is really easy to use and see when the market is trending or ranging. Through a little window of 3 colors you will identify if the ma

Trailing Step, Trailing Stop and Stop Loss as we used see how Pro traders used to make consistent profit. Traders who prefer the Stop Loss and Trailing Step trading style can use this EA to power their trading strategy and leverage from the movement of the price towards the Take Profit line with the continuous movement of the SL line. What is special about this EA is that it will immediately open the next trade in the opposite direction once the price hits SL. The EA has a built-in News Filter,

An indicator of patterns #35 and #36 ("Pipe bottoms" and "Pipe tops") from Encyclopedia of Chart Patterns by Thomas N. Bulkowski. Parameters: Alerts - show alert when an arrow appears Push - send a push notification when an arrow appears (requires configuration in the terminal) PeriodBars - An indicator period (number of bars that form a top/a bottom) K1 - an additional parameter that influences the accuracy of pattern shape recognition K2 - an additional parameter that influences the accuracy

Version 1.0 The Trend Snatcher is Multi timeframe indicator that can be used to catch swings on the price market chart The indicator uses two lines that targets the highest buying and lowest selling levels , the signal indicated by the two lines crossing The indicator is suitable for scalping and Swing trading, It can also be used as additional Confluence to enter a trade when Price is at a significant level of supply and demand or Trendline touch
HOW IT WORKS? Buying : Place your Buy

Stable Signals is a simple indicator with simple and reliable signals. The first advantage a trader gets when using forex arrow indicators is convenience. There is no need to look for the intersection of moving averages or oscillator lines by straining your eyes and peering at the chart. It is enough to see 1-2 arrows - and this is already a signal. The good thing is that the arrow is colored. The trader is always looking for good indicators. It is very convenient to use arrow Forex indicators,
Expert Advisor = MA Line with Filter Executor = Crossing Candle and Moving Avereage Line Filter = Moving Average, Stochastic, Parabolic SAR
Parameter Information: Lot Mode --> 1 = Fixed Lot, 2 = Freeze%Balance Lot, 3 = Martingale System Position Type --> 1 = Every time there is a signal ea will open a position, 2 = Only one position per trade
you can choose filter some, all or nothing
FREE

TL/DR: Scalping with trend to ensure maximum profit and minimal drawdown. Try it, love it, own it.
Scalp Surgeon works with short time frame (5M) while having trend marker at higher time frame (30M~4H).
Users are allowed to play with MA to find the best parameter for their pairs: >> If you closed a trade too early while it is in trend? Reopen the trade at a better position than your closed position. >> Choose your take profit and stop loss level. >> Want less constraint? Change the % condit
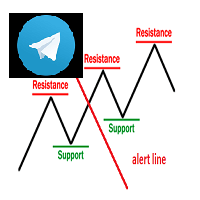
Keylevel and trendline Telegram reminder Having this EA, you do not need to standby on the screen to wait for price touch key level, trend line, or at 50 – 61.8 of Fibonacci retracement. All is automatic and it will notify you when need to take a look at the chart. EA will send you a screenshot through Telegram of the chart at the time of notification. This product can be used for every market, every instrument. The system auto draws and alerts when the price at a key level and at a Fibonacci r

The name Aroon means “ Dawn's Early Light ” in Sanskrit. His creator Tushar Chande chose this name because the indicator is designed to catch the beginning of a new trend. At first sight it seems a little confusing all those jagged lines but after you understand the basics of it, you will find this indicator pretty cool and use it in a variety of ways, i.e.: Trigger, Trend Filtering System, and so on. The Aroon indicator was created in 1995 so it is a "modern" indicator compared to the Jurassic
FREE
This Expert Advisor Makes efficient use of market fluctuation using multiple criteria. Initial deposit value is criteria for final return of the EA. we recommend using at least $500. Along with increasing initial deposit value, it s recommended to increase trading lot size relatively. Other input parameters are optimized for GBPUSD. To be used for other pairs it must be optimized separately.

Taka Taka Scalper Pro is a simple expert advisor that can be configured according to moving averages signals, such as triple, double or exponential moving average . Trigger signals are configured when these averages crosses. Besides, there is a important ATR filter to trade only on such volatility. A trend filter can also be configured according to averages. Takeprofit and stoploss are calculated according to ATR multiplier , even for long or short trades. You can also configure a non scalper mo

Half Trend TPSL Buy Sell Indicator calculates the open and close of the price bars over the selected period of time and applies its own calculation method to find an average line of the price movement. ATR based Take Profit and Stop Loss ATR is a measure of volatility over a specified period of time. The most common length is 14, which is also a common length for oscillators, such as the relative strength index (RSI) and stochastics. A higher ATR indicates a more volatile market, while a lowe

Finding the right trend is always one of the most important points of trading
If you agree with me then let's move on
How do we recognize the trend?
As you well know, one of the best and most widely used standard indicators is the ATR. There is no special magic
We try to identify the trend by calculating the amount of ATR and the amount of Multiplier.
You can use this indicator in all currencies and all time frames. Of course, note that the purpose of this indicator is to show the t

Sends alert when price moves from the previous alarm price by predefined points (or bps). Four alarm modes: push notifications, pop-up, e-mail and / or FTP. Highly customizable alert text and user-configurable indicator color / width / style.
Input parameters: Alert offset, in points : Alert is triggered when price moves from the previous alert by predefined points (if the last alert has not been registered, the current price is used as the last alert). The alert price is updated automaticall

RSI Arrow1 is an arrow indicator based on the RSI, is easy to use; no internal adjustments to be made. the user can change the indicator period as desired in the settings. It can be used on all markets but it will all depend on your Trade strategy. There is no better Time Frame for its use; the use will depend on the Trader himself.
Settings:
RSI Period Push Notification Email Notification Audible Alert Down levels Up levels

HLBand is an indicator which can show trend, volatility channels, and it has 3 line levels: upper, middle and lower.
HLBand MT5 version is a perfect translation of HLBand MT4, it works absolutely identical to MT4 version.
Indicators Inputs
BandPeriod - the period used for calculating values of bands. PriceField - the price used for calculations, it can have two values: 0:High/Low, 1:Close/Close.

Put to work now The Last Pharaon this incredible EA was carefully made and tested for the EUR / USD market exclusively in the 5m time frame, the purpose of this EA is to keep your capital safely behind this incredible EA and your account never reaches to $ 0.
This EA can be used with little capital $ 100, I have tested it with $ 50 and it works perfectly but it is advisable to start with a minimum of $ 100, I recommend using a VPS. You can also work a higher capital, you just have to raise the

Local Trade Copier EA MT5 による、驚くほど高速な取引コピーを体験してください。1分で簡単にセットアップできるこの取引コピー機は、同じWindowsコンピュータまたはWindows VPS上の複数のMetaTrader端末間で取引をコピーすることができ、0.5秒未満の高速コピースピードを実現します。
初心者であろうとプロのトレーダーであろうと、 Local Trade Copier EA MT5 には、あなたの特定のニーズに合わせてカスタマイズするための幅広いオプションが用意されています。これは、利益の可能性を高めたい人にとって究極のソリューションです。 今すぐ試してみて、これが市場で最も速くて簡単なトレードコピー機である理由を理解してください。 ヒント: デモアカウントで Local Trade Copier EA MT5 デモバージョンをダウンロードして試すことができます: ここ ダウンロードした無料のデモ ファイルを MT5 >> ファイル >> データ フォルダを開く >> MQL5 >> Experts フォルダに貼り付けて、ターミナルを再起動し
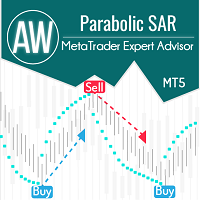
完全に自動化された取引ロボット。信号の識別には、よく知られているパラボリック SAR インジケーターが使用されます。さらに、EA は、平均化機能、最初と最後のバスケット注文を閉じる機能、および自動ロット計算機能を実装します。高度な情報パネルと 3 種類の通知があります。アドバイザでインジケータ シグナルを調整する機能。 問題解決→ こちら / MT4版→ こちら / 命令 -> ここ 利点:
あらゆる楽器と時間枠で使用可能 構成可能な組み込みインジケータ パラメータ 簡単なセットアップと直感的なパネル インターフェイス ろうそくごとに 1 つの注文のみを開く機能 組み込みの自動ロット計算 最初と最後のバスケット注文を閉じるための組み込みシステム 3 種類の通知: プッシュ、メール、アラート 利点: EA は、インジケーター信号に従ってポジションを開きます。トレンドが交差すると、インジケーターからシグナルが受信され、この時点でポジションが開かれます。 下降トレンドの開始に関するシグナルを受信すると、売りポジション
上昇トレンドの開始に関するシグナルを受信す

このプロジェクトが好きなら、5つ星レビューを残してください。 インスタグラムでフォロー:borelatech 大規模なボリュームを取引するには、複数の楽器/チャートを調べる必要があります
新しい機会を見つける, このインジケータは、特定の特定のプロットによってあなたを助ける
数またはそのサフィックスの複数のレベルによって、それらを自動的に更新します
価格が変更されると、そうでなければ退屈なタスク。 例えば、GBPUSDでは、インジケーターの4つのインスタンスを
チャートをプロットする: 線長100バーの各0.01間隔。 線の長さ25バーの0.0075間隔で終わる各価格。 線長50バーの0.0050間隔で終わる各価格。 25バーの線長で0.0025間隔で終わる各価格。 このようにして、定規に似ているので、この例が非常に見られます。
スクリーンショット。 また、色やラインのスタイルを異なるスタイルで設定できます。
レベルを視覚化しやすいようにします。
FREE

前書き これは毎日の収益性の指標です
特性 統計は、通貨、マジックナンバー、およびメモに基づくことができます 統計は時間に基づくことができます すべての通貨、すべての期間で利用可能 白と黒のテーマがあります 逆ソート リフレッシュレートを調整できます 更新時間を最新に設定できます
パラメータ nD = 30; // 日数 StartTime = D '2021.06.01 00:00:00'; // 始まる時間 EndTime = D '2021.06.27 00:00:00'; // 終了時間 ToCurrent = true; // EndTimeを現在に更新 リバース = 真; // 逆行する MagicNumber = 0;

ONLY 3 COPIES OUT OF 10 LEFT AT $50! After that, the price will be raised to $200. EA with the idea of using the "High Risk - High Reward" strategy. You should use the EA with the same capital as my trading signal, withdraw profits regularly and only use lot size 0.01 no matter the capital. - REAL SIGNAL: https://www.mql5.com/en/signals/2151054
Real operation monitoring as well as my other products can be found here: https://www.mql5.com/en/users/tuanthang/seller
IMPORTANT! Contact me i

The indicator evaluates the degree of price variability and identifies the components leading to growth and fall. Using Variability, you can determine the places where the movement changes, successful moments for trading on the trend or against the trend. Accompany open transactions. DISPLAY
The indicator displays 3 lines: VARIABILITY - a thin gray line. Total price variability. The growth of the line indicates an increase in market activity. The decline shows the possibility of counter-trend t
Indicator that synchronizes the charts, that is, when the symbol is replaced in one of the charts, all those that appear with the synchronized indicator are changed, with the same timeframe (Same_Timeframe = true) or with different timeframes (Same_Timeframe = false). The graphics to be synchronized are identified by color (Label).
To synchronize the indicators, the indicator must be inserted in all the charts to be synchronized, using the same color (Label).
A box with the chosen color (La
FREE

Tillson's T3 moving average was introduced to the world of technical analysis in the article ''A Better Moving Average'', published in the American magazine Technical Analysis of Stock Commodities. Developed by Tim Tillson, analysts and traders of futures markets soon became fascinated with this technique that smoothes the price series while decreasing the lag (lag) typical of trend-following systems.
FREE

Counts the lifetime of Candle Extra until its closing.
It is used to assist in the entry of operations... ...We operate at the close of one-minute Candles, that is, when the timer is at 00:xx:01. We open an order, and the value of that operation is also displayed by the tool.
Extra: To 'unlock' the price scale. Double click on the scale and the graph will be 'horizontally centered'. In addition to allowing the expansion and contraction of the price scale, we can navigate the chart by dra

No! These are not the 'Bollinger Band'.
Identifies the CONTINUITY of the movement between High, Low and Closing. The 'two bands' in one color signal the CONTINUITY of bull or bear movement. With this tool, following the price direction, it was easy even for those who are Café com Leite in the Market!
Remember if: All our tools work together, exclusive indicators and risk management robot.
They automatically identify the different patterns in the Mini-Index dynamics as well as manage our o

EA Gold River was created specifically for trading on gold (XAUUSD) time frame M5-H1.
EA Gold River uses signals from a unique Gold River indicator (you do not need to buy separately, the indicator is built into the Expert Advisor).
I will not show beautiful drawn screenshots and super edited videos. If you are using my EA TradeBooster , then you will like EA Gold River .
The standard set is good for trading, but you can always come up with your own set for higher profits.
Happy Trades

There is a very simple rule
It is Always difficult to cross high pressure areas and easy to cross low pressure areas
MT4 version is available here
This is definitely true for price
It was so simple, it was not!
So let's get started
This indicator shows you the amount of pressure in that area according to the bars that it shows. The longer the bar, the higher the pressure in that area It also marks the most pressed area with a rectangle
From now on you can simply decide on the

What do you expect from a robot? Check out the live accounts and see for yourself! Live - EURUSD - Agressive Live - EURUSD - Moderate Live - EURUSD - Light Live - Multiple currencies SIMPLE AND PROFITABLE!
Kraken FX uses scalper and martingale techniques in addition to RSI and Volume indicators to trade.
Recommended currencies: AUDCAD, EURAUD, EURGBP, EURUSD, GBPCAD, GBPUSD e USDCHF Recommended timeframe: H1
Click here for the latest sets

Sharing-Is-Caring Trade Copier
Features Local & Remote copy One tool can act as provider or receiver of trades Co-exist with other positions opened manually or from other expert advisors Can be stopped and restarted at any time without any issues such as deals getting closed mysteriously Copy same lot or adjust according to your balance and leverage Partial close/open Manage max funds to use One provider can copy to unlimited number of receivers One receiver can copy from unlimited number of
FREE

A lot of professional traders use high quality divergence signals as a part of their strategy to enter a position. Spotting correct divergences quickly can often be hard, especially if your eye isn’t trained for it yet. For this reason we’ve created a series of easy to use professional oscillator divergence indicators that are very customisable so you get only the signals you want to trade. We have this divergence indicator for RSI, MACD, Stochastics, CCI and OBV. RSI: https://www.mql5.com/en/

Kroko Trader EA is a trading system that uses William´s Alligator indicator as trend and trigger signals. Also, as a filter, ATR can be configured to trade only in certain volatility. Takeprofit and Stoploss are calculated according to multiplier of ATR values, resulting in a dynamic stop function. Optimized EA was on EURUSD , H1 . But, it´s possible to optimize on other timeframes and currencies, such as EURUSD , M15 Scalper . Please download it and don´t let to test other expert advisors of my
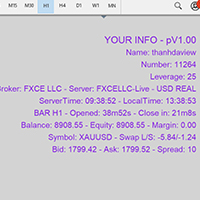
Show Account Information Custom showing your MT5 account information Indicators add account information to chart. Profit, Balance, Equity, Free Margin, Margin and Margin Level % Profit.... Hide account information: Click anywhere on account information text.
The hide/show response is dependent on incoming ticks or chart refresh. In tick scarce or closed markets the indicator hide/show click will appear not to function while waiting for a tick or chart refresh. It is only necessary to att
MetaTraderマーケットは自動売買ロボットとテクニカル指標を販売するための最もいい場所です。
魅力的なデザインと説明を備えたMetaTraderプラットフォーム用アプリを開発するだけでいいのです。マーケットでプロダクトをパブリッシュして何百万ものMetaTraderユーザーに提供する方法をご覧ください。
取引の機会を逃しています。
- 無料取引アプリ
- 8千を超えるシグナルをコピー
- 金融ニュースで金融マーケットを探索
新規登録
ログイン