YouTubeにあるマーケットチュートリアルビデオをご覧ください
ロボットや指標を購入する
仮想ホスティングで
EAを実行
EAを実行
ロボットや指標を購入前にテストする
マーケットで収入を得る
販売のためにプロダクトをプレゼンテーションする方法
MetaTrader 5のための新しいエキスパートアドバイザーとインディケータ - 80

Killer Market MT5 is an advisor with a system for "Resolving" a basket of unprofitable orders, a news filter, a filter for open positions on other trading instruments and the function of sending trading signals to your Telegram channel.
The Expert Advisor can be used to restore unprofitable positions on the account as a utility to bring trades to breakeven that you opened with your hands or other Expert Advisors.
Works inside a linear regression channel, input on several conditions. The s

Adapted from the award winning international best seller (Short Term Strategies That Work) by Larry Connors and Cesar Alverez in 2008, this concept was retested 10 years after the book published and that will give you an idea of the concept if it still works. Take the last 10 years as walk forward and this strategy is added with a twist to risk management with arbitrary 5% stop loss and exit day counted as calender days instead of trading day. This EA works on dual mode, Long and Short. Origin

Open Risk Profit shows your current risk or possible profit of all open positions. Total open risk is your loss if all positions run into the stop loss.
Total open profit is your profit if all positions reach your take profit.
Total float is your current profit or loss of all positions. The program also breaks down the information into the individual symbols. For example, you can monitor how much is your current profit and your potential risk in EURUSD, no matter how many individual positio
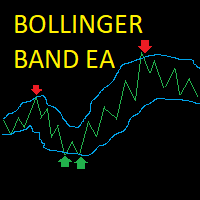
Bollinger Band Scalper EA This EA opens trades when the price hits and bounces off the Bollinger Bands, it closes the trade when it reaches the opposite Bollinger band or if the price reverses into the trailing stoploss. Posisitions are sized dynamically depending on the user's account balance. The EA waits for the price to cross the Bollinger Band and then opens a market order at a set percentage of the bandwidth from the band chosen by the user. The position is sized a percentage of the user's
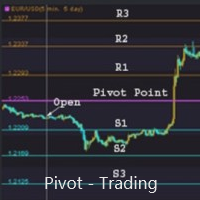
支点交易 : 1.pp 支点 2. r1 r2 r3 , s1 s2 s3 交易实用必备工具指标 波浪自动计算指标,通道趋势交易 完美的趋势-波浪自动计算通道计算 , MT4版本 完美的趋势-波浪自动计算通道计算 , MT5版本 本地跟单复制交易 Easy And Fast Copy , MT4版本 Easy And Fast Copy , MT5版本 本地跟单复制交易 模拟试用 Easy And Fast Copy , MT4 模拟账号运行 Easy And Fast Copy , MT5 模拟账号运行
支点( pivot points) 作为一种交易策略已经很长时间了,最初是场内交易员使用这种方法。使用这种方法通过几个简单的计算就可以了解市场在一天中的去向。 支点法中的支点是一天中市场方向的转向点,通过简单地计算前日的高点、低点和收盘价,可以得到一系列点位。这些点位可能形成关键的支撑和阻力线。支点位,支撑和阻力位被统称为支点水位。 你所看到的市场每天都有开盘价、高价、低价及收盘价(有一些市场是 24 小时开盘,比如外汇市场,通常用 5pm EST 作为开盘和收盘时间)。这些信

CandleVolume is an indicator that colors bars according to increasing or decreasing volume. You can use it to identify strategic regions of the chart and complete an analysis. White means low volume, yellow means medium volume and red means climax volume. It is a recommended indicator if you like to interpret market contexts and understand how market cycles work.

Все паттерны из книги Томас Н. Булковский "Полная энциклопедия графических ценовых моделей" в одном индикаторе со сканером. Cканер включается параметром ScannerMode. При ScannerMode=false индикатор ищет один паттерн (выбирается переменной Pattern). При выявлении паттерна индикатор рисует стрелку, открывает окно сообщений, выполняет push-уведомление. У индикатора много параметров, некоторые их них задействованы всегда, некоторые выборочно. Включите переменную ShowHelp - на графике отобразится по

このインジケータは、横ばいを検出し、検出された領域を色の付いた四角形で塗りつぶします。
このインディケータの主なアイデアは、価格がチャート上の特定の領域を埋 めたときにフラットを検出することです。
入力パラメータ
Color rectangle - 影を付ける矩形の色。
Bars in rectangle - 長方形内のバーの最小許容数。
Density in % - 平坦の密度。矩形の面積に対するパーセンテージで設定。 __________________________________________________________________ __________________________________________________________________

The robot uses one of the most used indicators in Asia:
* ICHIMOKU CLOUD *
There are two trading strategies:
Crossing of Tenkan and Kijun lines and; Kumo lines crossing.
Know our products
Position openings are based on the parameters identified as signals, if you activate all the robot will issue a trading order only if the number of signals is greater than the minimum stipulated by the user.
This Expert Advisor (EA) works on HEDGE (Forex, etc.) and NETTING (Bovespa, etc.) accou

EasyTradePad は、手動/半自動取引用の取引パネルです。 ポジションと注文を処理し、ワンクリックで資金管理を計算します!
パネルは間違いなくあなたを助けます:
あなた自身が%または預金の通貨で指定した正確なリスクで取引を開始します ストップロスを損失なしに移動して利益を節約する 市場のボラティリティを平滑化することによって取引を平均化する 取引があなたの方向に進む場合は、トレンドに沿ってポジションを追加します さまざまなトレーリングストップ設定を使用して最大利益を絞ります すでに開いている取引のパラメータを変更する 収益性の高いポジションの部分的なクローズを実行する 主な機能: 注文の開始と終了 ポイント単位のSLとTPの計算 預金の%でのSLとTPの計算 $でのSLとTPの計算 ピラミッド 平均化 損益分岐点に転送 リスクに対する利益の比率の自動計算(比率) ポイントとローソク足の影によるトレーリングストップ ピラミッド
パネルは、取引が最初に指定されたTPに近づくと、追加の取引の段階的な開始を実行します。同時に、次の注文ごとに%リスク削減を設定できるため、新

iPumpインジケーターは、3つのカテゴリーのインジケーターの利点を組み合わせた用途の広いインジケーターです。
複数のTFでの同時トレンド検出 抵抗とサポートのゾーンを定義する 買われ過ぎと売られ過ぎのゾーンの決定 インジケーター機能:
トレンドの定義 この機能は、現在の市場の方向性を客観的に評価し、主観を避けたいすべてのトレーダーに必要です。ほんの一瞬で、最も重要な時間枠でトレンドの方向を比較することができ、これは明確で直感的になります。
サポートとレジスタンスレベルの決定 iPumpインジケーターを使用すると、数秒以内に資産の潜在的な価格障壁を評価できます。
また、インジケーターは目の前にあるレベルのタイプを示します。
テストレベル(抵抗/サポート) 逆転レベル 弱いレベル テストされていないレベル 買われ過ぎと売られ過ぎのゾーンの決定 このタスクでは、インジケーターに遅延や再描画のないシグナルオシレーターがあり、アセットの現在の状態を示します。このデータに基づいて、次のことができます。
購入するのが面白くなる時期を正確に知る 資産を売却することが興味深い

作業ロジック
ダウ戦略エキスパートアドバイザーは、「トレンド保持」のChalseDow理論に基づくエキスパートアドバイザーです。
エキスパートアドバイザーは選択されたTFを使用します。前のバーが上がっていた場合、それは買いを開き、前のろうそくの安値の後ろにストップを置くことを意味します(前のろうそくからのオフセットにフィルターを設定することが可能です)、次に、現在のろうそくが閉じた後、ストップロスは再び安値を超えて移動するため、足でノックアウトされなくなるまで取引は市場で保持されます。
中長期のトレンド商品の取引に最適です。取引を開始する前に、トレンドの存在について商品の独立した分析が必要です。 m1-MNからのすべての時間枠で、バーによるトレーリングポジションに最適です。
取引には、株式、通貨、金属、指数が適しています-一般的に言えば-中期的な傾向がある金融資産のほとんど。
推奨される時間枠はD1です。
ポジションは、前のバーの高値/安値を価格の方向に突破した後に開かれます。
ストップロスは、ローソク足の前のピークの後に設定されます。
トレーディング

パネルには、すべての初心者が処理できる最も直感的なインターフェイスがあります。
SLp列で-SLサイズをピップで指定する必要があります。値が灰色に変わり、同時にベイ/セルボタンも非アクティブになっている場合は、ブローカーによって設定される前に許可されていた値よりも小さいSL値を指定しています。
[TP%]列で、アカウント残高の%でTPを示します。設定では、この指標の計算内容に基づいて、資本、残高、または自由証拠金を選択できます。
R%列では、取引のリスク値を設定できます。
Insボタン。 -設定値ですぐに注文を開くことができます。無効になっている場合は、取引のパラメータをチャートに直接プリセットできます。 Pro Trading Panel - https://www.mql5.com/en/market/product/72256
上部の左上隅にあるマイナス記号をクリックすると、グラフのパネルを最小化できます。
パネル名の下にある+ボタンと-ボタンを調整することで、パネル自体のサイズを拡大または縮小することもできます。
保留中の注文を開いてBUへ

MT4バージョン: https://www.mql5.com/en/market/product/72558 この戦略は、最も重要な サポートと レジスタンスのレベルを跳ね返すことに基づいています。 このアルゴリズムは、リスクの高い戦略を使用していません。各取引は、いくつかのレベルの管理によって保護されています。 適応型トランザクション追跡アルゴリズムが使用されます。 この戦略は、100%のシミュレーション品質で、利用可能な履歴全体にわたって正常にテストされています。 実際の市況に近いスリッページとコミッション。 開発会社の公式ウェブサイト、あなたはここで見つけることができます MQL5プロファイル 私たちの公開チャンネルへようこそ MQL5Сhannel その他の製品 Varko Technologies
推奨事項
通貨ペア: GBPUSD、EURUSD 時間枠:M1
ブローカーサーバーには、ネットワーク遅延が最小限のVPSまたはサーバーを使用してください。 スプレッドと手数料が最も低いブローカーを使用してください。 実際のアカウントで使用す

Implements a channel based on integrated comparison of moving average values with improved functionality. As a result, the chart displays a channel of deltas of moving averages in the center line and an indentation of the channel boundaries over a specified range.
What is the channel? This is the price range (limited), in which all its dynamics (movement) takes place over a certain period of time. This method is very old, the Forex channel strategy dates back to a long time, when the theory

Bollinger Bands (BB) are similar to Envelopes. The difference between them is that the boundaries of the Trade Bands (Envelopes) are located above and below the moving average curve at a fixed percentage distance, while the Bollinger Bands are plotted at distances equal to a certain number of standard deviations. Since the magnitude of the standard deviation depends on volatility, the bands themselves adjust their width: it increases when the market is unstable, and decreases in more stable per
If you are looking for a safe ea to start trading in index this is your ea
This ea performs a market entry that starts the algorithm at the time of day that the trader decides. We recommend it to be 1 min after the opening of the index.
It also allows you to say close the operation at the close of the session or keep the cycle open.
It only performs a daily cycle that starts at the scheduled time and remains alive until it exits for profit or session close.
This system is designed to

Implements a channel based on the moving average indicator with improved functionality.
Moving average, moving average (English Moving average, MA) is a general name for a family of functions, the values of which at each point of determining the level of some average value of the original function for the previous period. The channel moves up and down relative to the moving average by a specified number of points.
This indicator is suitable for those who are interested in the classic calc
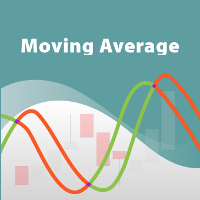
Moving average, moving average (English Moving average, MA) is a general name for a family of functions, the values of which at each point of determining the level of some average value of the original function for the previous period.
This indicator is suitable for those who are interested in the classic calculation method but with improved functionality. There is a version for both MT4 and MT5.
Moving averages are commonly used in time series data to smooth out short-term fluctuations a
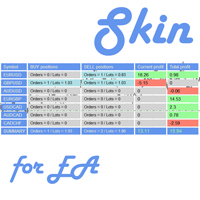
This utility is a graphical shell for other Expert Advisors that do not have their own graphical shell or whose graphical shell you do not like. Just run the utility on a free chart of any currency pair, specify in the input parameters the "Magic Number" of the advisor to which you want to connect the utility, and a graphical shell will appear on the graph, containing information about the traded currency pairs, current positions and trading results of your advisor. If you like this utility, tak
FREE
An indicator of patterns #5 and #6 ("Wedges, ascending, broadening" and "Wedges, descending, broadening") from Encyclopedia of Chart Patterns by Thomas N. Bulkowski.
Parameters: Alerts - show alert when an arrow appears Push - send a push notification when an arrow appears (requires configuration in the terminal) PeriodBars - indicator period ArrowType - a symbol from 1 to 17 ArrowVShift - vertical shift of arrows in pixels ShowLevels - show levels ColUp - color of arrow up СolDn - color
An indicator of patterns #1 and #4 ("Broadening Tops" and "Broadening Bottoms") from Encyclopedia of Chart Patterns by Thomas N. Bulkowski. Version 1: bottom, top, bottom, top, top breakout. Version 2: top, bottom, top, bottom, top breakout.
Parameters: Alerts - show alert when an arrow appears Push - send a push notification when an arrow appears (requires configuration in the terminal) Variant1 - show version 1 of the pattern Variant2 - show version 2 of the pattern PeriodBars - indicat
An indicator of patterns #2 and #3 ("Broadening formation right-angled and ascending" and "Broadening formation right-angled and descending") from Encyclopedia of Chart Patterns by Thomas N. Bulkowski.
Parameters: Alerts - show alert when an arrow appears Push - send a push notification when an arrow appears (requires configuration in the terminal) PeriodBars - indicator period K - an additional parameter that influences the accuracy of pattern shape recognition. The smaller the value is, t
An indicator of patterns #13 - #20 ("Double Tops" and "Double Bottoms", types Adam-Adam, Adam-Eva, Eva-Adam, Eva-Eva) from Encyclopedia of Chart Patterns by Thomas N. Bulkowski. Adam - sharp tops/bottoms, Eva - flat ones. Parameters: Alerts - show alert when an arrow appears Push - send a push notification when an arrow appears (requires configuration in the terminal) PeriodBars - indicator period K - an additional parameter that influences the accuracy of pattern shape recognition. The smalle

Implements an oscillator based on a simple comparison of the last two moving average values with improved functionality. As a result, the graph displays the delta of the two moving average values. In the case of a single value, the moving delta is calculated relative to the last two candles, which price of comparison will be specified in the Price parameter. The delta of two values is often used to determine the trend, depending on the length of the moving averages, it can be a longer or sh
An indicator of patterns #9 and #10 ("Cup with handle") from Encyclopedia of Chart Patterns by Thomas N. Bulkowski.
Parameters: Alerts - show alert when an arrow appears Push - send a push notification when an arrow appears (requires configuration in the terminal) PeriodBars - indicator period K1 - an additional parameter that influences the accuracy of recognition and pattern shape (the lower the value, the smoother the cup edge is) K2 - an additional parameter that influences the accuracy o

An indicator of patterns #24, #25, #26 and #27 ("Head and Shoulders", "Complex Head and Shoulders") from Encyclopedia of Chart Patterns by Thomas N. Bulkowski.
Parameters: Alerts - show alert when an arrow appears Push - send a push notification when an arrow appears (requires configuration in the terminal) PeriodBars - indicator period K - an additional parameter that influences the accuracy of pattern shape recognition. The smaller the value is, the smoother the row of peaks/valleys shoul
An indicator of pattern #54 ("Dead cat bounce") from Encyclopedia of Chart Patterns by Thomas N. Bulkowski.
Parameters: Alerts - show alert when an arrow appears Push - send a push notification when an arrow appears (requires configuration in the terminal) PeriodBars - indicator period ArrowType - a symbol from 1 to 17 ArrowVShift - vertical shift of arrows in pixels. Note. Arrows appear on a forming bar and do not disappear.
It cannot be guaranteed that the indicator recognizes the pat
An indicator of pattern #55 ("Dead cat bounce, inverted") from Encyclopedia of Chart Patterns by Thomas N. Bulkowski.
Parameters: Alerts - show alert when an arrow appears Push - send a push notification when an arrow appears (requires configuration in the terminal) PeriodBars - indicator period ArrowType - a symbol from 1 to 17 ArrowVShift - vertical shift of arrows in pixels. Note. Arrows appear on a forming bar and do not disappear. It cannot be guaranteed that the indicator recognize

The QRSI indicator is one of the most important and well-known indicators used by traders around the world. By its nature, the QRSI indicator is an oscillator, that is, it fluctuates in a certain zone, limited by the maximum (100) and minimum (0) values. Specifically, this indicator works according to an accelerated algorithm, but this is not its only difference. This indicator implements a more advanced calculation based on the Relative Strength Index algorithm. The peculiarity of the implemen

Ferramenta derivada do DR Assistant, a versão Lite conta com recursos semelhantes, mas sendo mais específica em sua aplicação, destina-se exclusivamente ao uso para gestão de ordens abertas a partir de suas funções. Deste modo, quaisquer outras negociações ou posições abertas por outras ferramentas ou manuais serão ignoradas pelo Assitant Lite. Os parâmetros e configurações disponíveis, bem como suas principais funções são: - Take Profit e Stop Loss: duas opções de Steps, em pontos, para ambas a

Automatic fibonacci with alerts is an indicator that automatically plots a fibonacci retracement based on the number of bars you select on the BarsToScan setting in the indicator. The fibonacci is automatically updated in real time as new highest and lowest values appear amongst the selected bars. You can select which level values to be displayed in the indicator settings. You can also select the color of the levels thus enabling the trader to be able to attach the indicator several times with d

This is the MetaTrader version of the very popular Squeeze Momentum indicator. It is based of of John Carter's TTM Squeeze volatility indicator, as discussed in his book Mastering the Trade. With this version you can enable notifications when a squeeze is released (push notification, email, or pop-up message). Strategie
Grey dots indicates a squeeze in the current timeframe. Blue dots indicates that the squeeze is released. Mr. Carter suggests waiting till the first blue dot after a grey dot a

RSI Scanner, Multiple Symbols and Timeframes, Graphical User Interface An indicator that scans multiple symbols added from the market watch and timeframes and displays result in a graphical panel. Features: Multi symbol Multi timeframe Alerts and Notifications Live Monitoring Sorting modes One click to change symbol and timeframe Inputs for RSI and scanner settings
FREE

This is MT5 version of ChristMyHedge . It should be referred to as ChristMyHedge-for-MT5.
Like its MT4 counterpart, the EA/signal runs on Daily (D1) time-frame on 12 pairs: GBPUSD, EURUSD, USDCHF, USDCAD, NZDUSD, USDJPY, AUDUSD, GBPEUR, EURJPY, CADJPY, AUDJPY and EURCHF concurrently, with a recommended minimum of 150USD equity per 0.01 lot size.
Default parameters may be OK, and it's best to run on VPS, if you do not have 24/5 Internet and electricity.
However, the newer version of Christ

An anchored Vwap With Arrows is an indicator that includes a moving average weighted by volume that allows you to plot on a bottom or a top. Usually banks and institutions measure an average price, this average price is a price range where they agree to make a trade. Using the logic of anchored vwap with arrows it is possible to understand that if the price breaks the vwap it means that someone with enough buying and selling power has lost control. You can use vwap anchored with arrows in any ti

Horizontal volume bars, Cluster analysis, Volume profile Volume in Range gets information about the accumulated volume in a specified vertical range and period in bars. The received data is then plotted on the chart as rectangular boxes with the volume quantity inside. Usage:- The tool acts as a support resistance levels but most importantly it should be used to check in which direction the price breaks out of the significant levels formed by this indicator and then actions to be taken on correc

Market structures, Market balance, Range breakouts This tools helps to identify areas of market ranges, structures and plots colored boxes on breakout of those areas. User is given the option to receive alerts and notifications on the formation of the blocks. The tool has the ability to become an essential part of a technical trading system or even pure price action trading. Usage:- An essential tool for price action or technical traders. More information in the blog
Trading Strategy The Leicester expert advisors uses three exponential moving averages to determine entry positions. Trend Line Slow Moving Average Fast Moving Average Crossovers between the fast moving average and the slow moving average will create sell signals. If prices are below the trend line then only sell positions will be opened. Vice versa for when prices are above the trend line, only buy positions will be opened. Inputs/Features
Candles after cross - Number of candles to wait before

This indicator is an oscillators that shows the real strength of 8 main currencies in the Forex market. It recreates a basket of the main currencies and applied a True Strength Indicator on each of them. The calculated real currencies are: EUR - USD - GBP - CHF - JPY - AUD - CAD - NZD. It clearly identifies overbought and oversold ares. From reading the oscillator you can choose the right Forex symbol to trade.
Future versions: I am working on adding alarm and a real buy sell signal, choos
Dark Gold is a fully automatic Expert Advisor for Scalping Trading on Gold , Bitcoin , Eurusd and Gbpusd. This Expert Advisor needs attention, in fact presents highly customizable. Dark Gold is based on Dark Support Resistance mt5 indicator (owning it is not necessary) , these Trades can be manage with some strategies. If you Buy this Expert Advisor you can write a feedback at market and get Dark Support Resistance indicator for Free , for More info contact me The basic strate

MT5のエキスパートアドバイザーリスクマネージャーは非常に重要であり、私の意見ではすべてのトレーダーにとって必要なプログラムです。
このエキスパートアドバイザーを使用すると、取引口座のリスクを管理することができます。リスクと利益の管理は、金銭的およびパーセンテージの両方で実行できます。
エキスパートアドバイザーが機能するには、それを通貨ペアチャートに添付し、許容可能なリスク値を預金通貨または現在の残高の%で設定するだけです。 PROMO BUY 1 GET 2 FREE - https://www.mql5.com/en/blogs/post/754725
アドバイザ機能
このリスクマネージャーは、リスクの管理を支援します。
-取引のために -1日あたり - 1週間 - ひと月ほど
制御することもできます
1)取引時の最大許容ロット 2)1日あたりの最大注文数 3)1日あたりの最大利益 4)エクイティを引き受ける利益を設定する
それだけではありません。設定で自動設定を指定した場合、アドバイザーはデフォルトのSLとTPを設定することもできます。

セミオートマーティンシステム
導入
このツールは半自動マーティン取引に使用され、パネルをクリックして注文すると、EAがポジションを管理します トランザクションの方向を決定し、残りはEA管理に任せてください 自動マーティン、設定されたグリッドに従って倉庫を追加し、この機能を無効にすることもできます ワンクリック清算 1つのキーロック機能 時間制御 警告音プロンプト
特性
トレーディングチャート:任意 取引可能な通貨:任意 自動テイクプロフィットクロージング バックテストに使用できます クリアパネルディスプレイ
パラメータ
主な設定パラメータ
LogLevel = LOG_LEVEL_INFO; //ログの書き込みレベル UseAutoMagic = true; //マジックナンバーを使用するかどうか MagicNumber = 6; //マジックナンバー0-2000を設定します ロット= 0.01; //初期取引量 UseMartin = true; // Martin関数を使用するかどうか ブースター= 1.7; //増加の倍数 NetGap = 10;
このスクリーナーを使用すると、選択した期間(時間枠)内に通常よりも買われ過ぎ(成長率)または売られ過ぎ(減少率)の資産を特定できます。 市場は法律によって支配されており、より安く購入し、より高価に販売しますが、自動スキャナーがないと、たとえば今週内に、通常よりも買われ過ぎまたは売られ過ぎの通貨/株を特定することは非常に困難です。現在の時間、または月。 数十または数百の機器が存在する可能性があり、すべてを手動で分析する時間がないことが物理的に可能な場合もあります。これらの問題は、Screenerを使用して簡単に解決できます。 スクリーナーができること スキャナーはどのTFでも使用できます スキャナーは、通貨、株式、暗号通貨、商品、インデックス、およびその他の機器で動作します 資産を特定するロジックは、市場の基本法則に基づいているため、普遍的です。 スクリーナーの助けを借りて、あなたはさまざまな戦略に従って作業することができます、最も一般的なものの1つはポンプとダンプです 各商品の平均値を明らかにする-SoftimoTradeScreenerは、選択したTFの資産の買われ過ぎと売られ過ぎ

作業ロジック この指標の重要性は、「燃料が機器に残っている」量を理解できるという事実にあります。状況を想像してみてください。あなたが半分放電したバッテリーを搭載した車に残した場合、平均して、この量のエネルギーは通常250 kmの車に十分であるため、必要に応じて700kmの距離を超えることはできません。そのため、商品ごとに一定の日次価格変動があり、統計的観察の結果、資産が1日あたり1 ATRを通過する時間の95%、2以上のATRを通過する時間の5%のみであることが明らかになりました。
例、毎日のATR EURUSD = 682ピップ。トレードに参加します。たとえば、TPが500ピップのレベルのブレイクアウトの場合、正しいTPサイズを設定したように見えますが、資産がすでに1日のATRの90%を通過していることを考慮していません。取引が開始された時間、したがって、楽器にはTPを受け取るのに十分なエネルギーがない可能性があります。楽器の残りのチャージが10%しかない場合は、TPを調整するか、取引にはまったく参加しません。
パワーリザーブインジケーターは、計測器が慣性を使い果たした量を
戦略ロジック Pump and Dump for mt5 Expert Advisorは、トレーダーがトレーダーのために作成した完全に自動化されたトレーディングアドバイザーです。 戦略は「より安く購入し、より高価に販売する」です。価格が大幅に上昇/下降した後、注文が開始されます。 ポンプアンドダンプ戦略の基本的な意味は、価格が下がると資産を安く購入し、価格が上がると資産を高く売ることです。 市場での急激な価格変動の後、反対方向に大幅な価格ロールバックが発生し、いわゆる「ヘアピン」が描画され、EAが力強い成長または価格の下落の瞬間を捉え、に基づいて市場に参入することにお気づきかもしれません。これらの信号。ビデオとスクリーンショットで詳しく説明します。
アドバイザの戦略は、iPumpインジケーターを使用した%価格変動の分析に基づいて資産の買われ過ぎ/売られ過ぎゾーンを識別するアルゴリズムに基づいています。インジケーターは資産の買われ過ぎ/売られ過ぎレベルを評価し、これに基づいてアドバイザーは取引された商品の最適な売買ゾーン、そして市場に参入します。
利点 アカウントドローダウン

このスクリプトは、さまざまなウィンドウ関数の重みを評価するように設計されています。これらのウィンドウ機能に基づいて構築されたインジケーターは、 https://www.mql5.com/ru/market/product/72160 からダウンロードできます。 入力パラメータ: iPeriod –インジケーター期間。 iPeriod> = 2 iCenterは、ウィンドウ関数の中心が配置される参照のインデックスです。デフォルトでは、このパラメーターは0です。ウィンドウの中心はインジケーターの中心と一致します。 1 <= iCenter <= iPeriodの場合、ウィンドウ関数の中心がシフトし、その結果、インジケーターのいくつかの特性が変化します。図1では、中心の選択がウィンドウ機能とインジケーターの表示にどのように影響するかを確認できます。このパラメータは、0.5刻みで変更できます。 Histogramwidth-ヒストグラムの幅。 Histogramcolor-ヒストグラムの色。 Showduration-期間を表示します。 スクリーンショット-このオプションを有効にすると、画像
FREE
不採算注文のバスケットを「解決」するためのシステム、ニュースフィルター、他の取引商品のオープンポジションのフィルター、および取引シグナルをテレグラムチャネルに送信する機能を備えたグリッドアドバイザー。
エキスパートアドバイザーは、手または他のエキスパートアドバイザーで開いた取引を損益分岐点にするユーティリティとして、アカウントの不採算ポジションを復元するために使用できます。
線形回帰チャネル内で機能し、いくつかの条件で入力します。信号は、線形回帰チャネルの方向、チャネル幅、指数移動平均の交点、1日の平均ボラティリティ、次数平均を使用します。
主な機能: 戦略に含まれるシグナルの取引 ボタンでの取引 ニュースフィルター 他のトレーディング商品のオープンポジションでフィルタリング アカウントの不採算ポジションの決済 位置平均 ポジションのトレーリングストップ利益 損益分岐点に転送 電報にトレードシグナルを送る 電報にニュースを送る
グリッドステップが構成され、価格が私たちに反する場合、一定数の注文の後、アカウント回復機能(ドローダウン削減)がアクティブになり、最も

ユーティリティMTI(メイン取引情報)-トレーダーの基本的な取引情報を表示します。
スプレッドの平均および現在のサイズ ショートポジションとロングポジションのスワップサイズ 1つの取引ロットに対して1ピップのコスト ストップレベルサイズ(保留中の注文を出すための最小距離) 現在の(赤)終了までの時間と次の(灰色)取引セッションの開始までの時間 現在の取引セッションが終了するまでの時間は赤で表示され、次のセッションが開始されるまでの時間は灰色で表示されます。色は、インジケーターのプロパティで個別に調整できます。 Recommended Robot Scalper - https://www.mql5.com/en/market/product/77108
表示は次の方法で実行されます。
欧州貿易セッション(EU旗) アメリカの貿易セッション(米国旗) パシフィックトレーディング(オーストラリア国旗) アジア貿易セッション(日の丸) 取引セッションの終了と変更の時間を知ることは重要です。なぜならトレーディングセッションの終わりまでに、多くのトレーダーはポジションを修正しま
FREE

あなたは小さなstoplossを持つEAをしたいですか? あなたはちょうど市場に出ているEAをしたいですか?
このEAは、dax(ドイツ指数)、またはDow Jonesのブレイクアウトに作用しています。 それは、市場が開いたときにのみ購入し、10分以下のウィンドウで購入しています。
この戦略(はい、それがあります2で使用することができます異なる戦略3異なるチャート)タイトなストップロスと多くの場合、数秒以内に到達するtakeprofitを持
戦略はよく証明されています。 私は良い結果を得て何年も手動でそれらを使用してきました。 設定ファイルは、私が使用する設定のコメントセクションの下に見つけることができます(あなたが時間をかけてより良い何かを見つけた場合は、TP
このEAの特徴 それだけで一日と戦略ごとに一つの貿易を取ります(時には貿易なし) すべての取引でTPとSLを使用します(SLとTPがタイトであるため、EAに組み込まれています) 買いと売りの逆指値注文の使用の可能性 ノー-マーチンゲール ヘッジなし 裁定なし 複数の取引はありません
プロモーション価格:$
The EA opens and closes new orders on time. It can be used to implement trading scenarios of any complexity by creating a list of tasks. There are two options for completing the task The task is executed on the specified date and time - it is executed once and is removed from the list. The task is executed with repetition on the specified day of the week and time - the task with repetitions is not removed from the list. Panel settings Symbol - select the symbol for the trade function. Time -

Trading has never been easier! Let's check this out! MT4 version: https://www.mql5.com/en/market/product/72153 Strategy There are some news within a day that can make the price jumps up or down very quickly and that is a good opportunity for traders to get some profits. Looking to scalp a news release? Here's how you can do it: Open two stop orders (a buy stop and a sell stop) 3 to 5 minutes before the news release. Place them about 15 to 20 pips away from the current market price. When the ne
FREE
The Martinware Eye Rest Reminder serves to periodically remind traders to rest their eyes without the need for a tool outside MT5.
Input parameters: Periodicity: play the alert every n minutes Alert with sound: define if the alert should include playing a sound Custom sound file: name of the custom sound file to be used instead of the default. It must be inside a folder named "Sounds", this one inside the "Files" folder in the Terminal's MQL5 directory tree. Alert with Alert message: informs
FREE

MT4 indicator version https://www.mql5.com/en/market/product/72342
I personally use this indicator to scalp. Accurate for accessing extremes and supports for buy positions primarily for 1 minute time frames. Other time frames can be used but the levels are different. Its a better oscillator and compare with others to see the difference. Day trade using neuro network concepts. This indicator uses elementary forms of neuro networks to generate signals to buy and sell. Use the indicat

The SMTrendLine indicator is based on the principles of graphical construction of Bollinger bands.
Graphically, the Bollinger is two lines that limit the price dynamics from above and from below, respectively. These are a kind of support and resistance lines, which most of the time are located at levels far from the price.
As we know, the Bollinger bands are similar to the envelopes of moving averages. The difference between them is that the envelope boundaries are located above and below t
FREE

THIS EA IS DESING TO USED IN BTCUSD
Do you want to accompany Criptotrading to the next level of bitcoin trading?
You just have to download it and try it yourself. Also testing it is free. Are you not going to try them?
Criptotrading it is a Secure Automated Software for trade Forex market and indices.
The architecture is a Fully Automatic Autonomous Robot Expert capable of independently analyzing the market and making trading decisions
Criptotrading It is an advanced and profe

This indicator was created based on posts from forex factory thread titled There is no Magic Moving Average - You need only one - by @andose2 a.k.a Andrei Florin. If you want to know about how to use this trading strategy please go and read https://www.forexfactory.com/thread/691864-there-is-no-magic-moving-average-you.
Note: Below are extracts some of the posts .
Estabilish a trend, based on Market Cycles, then go only long in the Markup Phase and only short in the Decline phase ,
FREE

Daily session open lines shows the traders three important trading session opens. By default it is set up to show you: Zero GMT Open Line London Open Session Line New York Open Session Line The default times are set according to GMT+2 and as such you are able to change and customise according to your specific time zone. The Indicator is usefull specially for the trader who trades the London and NewYork sessions.
FREE

The Monthly Weekly Open Line is an indicator that plots: The current month open line that will extend till the last week on the month. Weekly lines that span the look back days period that you have set . Each line will extend from the respective weekly Monday zero GMT till friday of the respective week. Monthly and Weekly open lines can be used to build very powerfull anc consistent trading strategies. They act as natural S/R price barriers.
FREE
Иногда бывает, что наши построения на графике выходят за пределы последнего бара. После выходных, эти построения могут измениться в виду особенностей учета времени в мт5. Данный индикатор поможет решить эту проблему - он проходит по всем графикам и сдвигает дату объекта, которая дальше, чем нулевой бар. После завершения работы индикатор удаляется. Параметры:
Direction - направление сдвига; DaysShift - количество дней, на которые сдвигается дата объекта, правее нулевого бара.
FREE

Imagine what results you could achieve in your manual trading if you had a tool that notifies you of a possible price reversal for all the symbols you are interested in at the same time (futures, stocks, forex or cryptocurrency)?
VSA screener is just the right tool. It was created for traders who value their time and make their own trading decisions on opening or closing a position. The software monitors the presence of trading patterns on the preselected tickers under several timeframes (up t
FREE

High of the Day and Low of the day Time and Price Fractal Studies is an indicator that will help you identify certain patterns that tend to repeat themseleves at certail times of the day or at certain prices.
It is used to study Daily Highs ad Lows in relation to time and price.
You will get to answer certail questions like:
At what time of day does this market usually turn around. At what price does the market turn. Is it at round numbers etc
FREE

A indicator to show saturation in buying or selling With fast and complex mathematical calculations Easily find saturation points for buying or selling Can be used in all symbols and time frames with many signals Can be combined with different indicators and different time frames With simple settings and simple working methods
Features: Can be used on all symbols Can be used in all time frames Can be used in all markets (Forex, stock, etc.) Large number of signals Same performance on all t
Robot functions: 1. TP and SL 2. TSL 3. BE 4. Working time selection function 5. Disconnection of the robot's work after obtaining a given profit or loss. A robot designed to trade on all currency pairs, cryptocurrencies and synthetic indices. Works on any time frame. Tests have shown its great effectiveness in action. If you need more information about the robot, visit my YT channel and use the Telegram messenger: @Mati_FX

The order block locator is powered by three main search algorithms thar can be used to find order blocks. Simple Fractal Search Algorithm Naive Fractal Movers Algorithm
Candle Transition Algorithm You can even combine the power of your 2 favourite algorithms and get the best of both worlds: Mixed Algorithm (Naive Fractal + Candle transition) Mixed Algorithm (Simple Fractal + Candle Transition
Simple Fractal Search Algorithm
The algorithm finds the fractals based on your setting paramers fo

Hi there! Since I am starting commercial and non-commercial product publishing I would highly appreciate: If you like this product, please rate it. That will help to promote not only this product, but indirectly another ones. So, such promotion will help to make some money from commercial products. Thus, I will have opportunity to fund my another directions of trading researches like bot development using mql4 and mql5 programming languages as well as python written products like crypto bots. If
FREE

Time and Price Fractal Studies is an indicator that will help you identify certain patterns that tend to repeat themseleves at certail times of the day or at certain prices. It is used to study Fractal Highs ad Lows in relation to time and price. You will get to answer certail questions like: At what time of day does this market usually turn around. At what price does the market turn. Is it at round numbers etc.
FREE
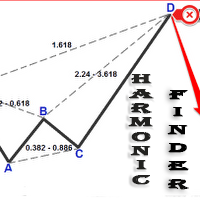
Automatically finding harmonic patterns has been made easy for traders. For those who do not know harmonic patterns : it is a method of technical analysis based on Fibonacci ratios in the markets and patterns made of these. Kind of like patterns such as triangles and double tops, but with precise measurements which makes computerized measuring tools especially appealing for trading these patterns. Some highlights from this Indicator include: Efforts to reduce the amount of screen clutter thro

Треугольным арбитражем называют одновременно открытие ордеров по трем валютным парам. Направление сделок и пары выбираются таким образом, чтобы одновременно открытые позиции страховали друг друга. За счет этого можно открываться достаточно большими лотами, и риск невелик. Варианты треугольников:
EURUSD – USDJPY – EURJPY Ордера, входящие в состав такого треугольника находятся в постоянном движении. Советник анализирует реальные цены на данный момент и просчитывает какими они должны быть. При ра
FREE

This DYJ OonClickClose help you to close all orders having profit immediately with only ONE CLICK, its work is very fast. You can choose which symbol you want or close all symbols so it will helpful for you in your trading to manage trading faster. This EA can quick close all Buy and Sell Orders by a selected symbol or total, And delete all pending orders. It includes dynamic target profit tracking function. The software has manual transaction buttons buy and sell. It is a management softw
MetaTraderマーケットはトレーダーのための自動売買ロボットやテクニカル指標を備えており、 ターミナルから直接利用することができます。
MQL5.community支払いシステムはMetaTraderサービス上のトランザクションのためにMQL5.comサイトに登録したすべてのユーザーに利用可能です。WebMoney、PayPal または銀行カードを使っての入金や出金が可能です。
取引の機会を逃しています。
- 無料取引アプリ
- 8千を超えるシグナルをコピー
- 金融ニュースで金融マーケットを探索
新規登録
ログイン