YouTubeにあるマーケットチュートリアルビデオをご覧ください
ロボットや指標を購入する
仮想ホスティングで
EAを実行
EAを実行
ロボットや指標を購入前にテストする
マーケットで収入を得る
販売のためにプロダクトをプレゼンテーションする方法
MetaTrader 5のための新しいエキスパートアドバイザーとインディケータ - 63

KT Price Border creates a three-band price envelope that identifies potential swing high and low areas in the market. These levels can also be used as dynamic market support and resistance. The mid-band can also be used to identify the trend direction. As a result, it also functions as a trend-following indicator. In addition, its ease of use and more straightforward conveyance of trade signals significantly benefit new traders.
Features
It works well on most of the Forex currency pairs. It

The BSI stands for Bar Strength Index. It evaluates price data using a unique calculation. It displays readings in a separate window. Many financial investors mistake this indicator for the Relative Strength Index (RSI), which is incorrect because the BSI can provide an advantage through its calculation method that the RSI indicator does not. The Bar Strength Index (BSI) is derived from the Internal Bar Strength (IBS), which has been successfully applied to many financial assets such as commodit

The KT Tether Line is a trend-following tool consisting of three indicators that work together to generate trading signals. It can correctly identify market trends while signaling trade entries. It was first introduced by Bryan Strain in the Stock & Commodities magazine in 2000 in "How to get with the trend and out at the end."
The Concept
When a market trend is confirmed, the most challenging part is determining the timing of the entries. This indicator alerts you to potential trend reversal

Overview This expert advisor is based on statistic model created using historical data. Our model lead to prepare parameters to drive Martingale strategy. It plays on USDCAD pair. To work proper with full strategy EA should be able to open total positions of 3.62 lots (sum of all possible open positions at the same time) and some margin for safety. For example it can be approximately at least 1200GBP with 500:1 leverage on account. It must be able to play 0.01 lots positions. Screenshots presen

=== Next price is 299$ === リアルアカウントシグナル - https://www.mql5.com/en/signals/1702554 MT4 エキスパート版 - https://www.mql5.com/en/market/product/86453 時間枠: M1 推奨通貨ペア: EURUSD、GBPUSD、USDCHF、EURGBP、USDCAD、AUDCAD、CHFJPY、EURCHF、USDJPY。
Tsap は、Varko Group Inc チームによる最新の開発です。戦略が夜間の低ボラティリティに基づいている多通貨取引 Expert Advisor。 EA は、リスクの高いグリッド、マーチンゲール、または平均化戦略を使用しません。各ポジションは仮想ストップロスによって保証されています。適応トランザクション追跡アルゴリズムが使用されます。また独自の展開で、スプレッド拡大時の取引や大幅な相場ジャンプをサポート。
推奨事項: Expert を使用する前に、必ず作成者に連絡して、ブロー

ボラティリティ アナライザーはモメンタム インジケーターであり、タイトな取引範囲での値固め後に価格が大きく上昇する傾向を利用します。このインジケーターは、スクイーズが発火したときの動きの予想される方向を示すために、運動量オシレーターも使用します。このヒストグラムはゼロ ラインの周りで振動し、ゼロ ラインより上のモメンタムの増加はロングを購入する機会を示し、ゼロ ラインを下回るモメンタムはショートの機会を示す可能性があります。
期間限定オファー : インジケーターは、わずか 50 $ で無期限でご利用いただけます。 ( 元の価格 125$ )
主な機能 横向きトレンド検出器。 低揮発性検出器。 強気の高値と弱気の高値のボラティリティ検出器。 すべての時間枠とすべてのペアで作業します。 ポップアップ アラートとプッシュ通知アラートを提供します。
コンタクト 質問がある場合、またはサポートが必要な場合は、プライベート メッセージでご連絡ください。
警告 すべてのインジケーターとツールは、公式のメタトレーダー ストア (MQL5 マーケット) からのみ入手できます

The EA for manual trading to manage open positions.The built-in trailing stop has five modes and seven instruments. There is a virtual stop loss and a virtual take profit, which can be freely moved around the chart. With the help of the built-in trading simulator, you can check how the EA works in the strategy tester. Guide to UTrailingMinMT5 can be found in the "Comments" section. In the MT5 strategy tester, manual movement of virtual SL and TP lines according to the schedule does not work! Ben

About the indicator: DALA Forecast is a universal tool for predicting the dynamics of time series of any nature. For prediction, modified methods of nonlinear dynamics analysis are used, on the basis of which a predictive model is built using machine learning methods. To get the trial version of the indicator, you can contact me in private messages.
How to use the indicator: Apply the indicator to your chosen financial instrument or indicator with the settings you need. The prediction will b
FREE

トレーダーは、取引を開始するたびに、自分が得たリスクと利益の機会を判断できるように、自分が行った取引の利益とリスクを知らなければなりません。 この計算を手動で決定することは、特に多くのオープン トレードを行う場合、非常に面倒な場合があります。
Trading Panel Katana は、トレーダーがこれらのニーズを満たすのに本当に役立つユーティリティ ツールです。 市場または保留中の取引を開始し、ロット、ピップ、価格ポジション、米ドルの金額、リスクの割合を自動的に設定できるようにします。
このユーティリティは、正確で使いやすいように設計されています。
トレーディングパネルカタナの主な特徴: - 市場でのオープントレードと保留中 (買いストップ/買いリミット/売りストップ/売り保留中) - ロットサイズ、ピップ、価格、米ドルでの利益損失、および残高からのパーセンテージの決定を自動的に設定できます - 始値、SL、TP の線引きオプション - ラインをドラッグして、価格、SL、または TP を設定します - ペア、スプレッド、ピップバリュー、バランス、エクイティに関する

The indicator works with the objects "Trend Line", "Rectangle", "Text" and allows you to create and copy them from one chart to another.
It is a more convenient alternative to automatic copiers, because it allows you to choose more flexibly what and where should be copied.
Keyboard shortcuts:
'1,2,3,4,5,6' - creating thin horizontal lines (the color is set in the settings), the same with SHIFT - thick line ' ~' - creating a line with a random color ))) '7,8,9' - creating shaded rectangles

Here’s the problem: the default zigzag indicator given in MT5 trading platform does not really capture the most of the highs and lows on chart do draw zigzags. On chart below, notice that some of ther high, low of price have been missed to draw zigzags by this default zigzag indicator (picture 1). It is not so apparent until you compare default zigzag indicator to this SwingZZ indicator. Have a look on picture 2 and 3. The swing zigzag indicator is best because it captures most of the swing high

The movement exhaustion is a color rule that helps indicate when the movement will revert its direction. The darker the color, the greater the probability to revert. The indicator is based on the price statistic. Works on every timeframe, every instrument. Five color options: 0. Natural movement. (Gray) 1 - 4. Movement exhaustion (Yellow to maroon) The trader can use it as reversal or exhaustion signal. In a trend following trade it can be used as an exhaustion signal, indicating the movement ca

Theoretical Foundation The Keltner Channels are channels ploted using volatility deviations above and bellow a moving average. The indicator is an excellent tool to help the trader build trend and mean-reversion strategies. Parameters The Orion Dynamic Keltner allows the user to select the Volatility Calculation Type, being ATR or Average Range (not considering price gaps). Also, the user can select the Calculation Period, Number of Deviations, Moving Average Mode and the Moving Average Ca

Theoretical Foundation Similar to the well-known Average True Range (ATR), the Average Range indicator is a volatility measure that is calculated using only the range of the bars (high – low), not considering the Gaps, as with the ATR. The Average Range can be very useful for day traders as it allows one to get the measure of the volatility of the last N bars. Parameters You can select the calculation period of the indicator.

The utility for manual trading to manage open positions.The built-in trailing stop has three modes and seven instruments: by pips, by bar extremes, by fractals, by volumes, by MA, by Parabolic SAR and by ATR. With the help of the built-in trading simulator, you can check how the EA works in the strategy tester. Guide to UTrailingMiniMT5 can be found in the "Comments" section. Benefits 3 trailing stop modes: normal, total and mobile stop loss; 7 options: by points, by bar extremes, by fractals, b

Normal Parabolic SAR with label of long or short state. Tells also "Parabolic long" and "short". Can be used in multitimeframe layouts together with Swiss HolyGrail indicator or in different timeframes. So, if all the indicators show "long" or "short" you can be sure that the risk of a wrong direction is small. The standard values for Parabolic SAR are 0.02 for step and 0.2 for maximum. You may experiment with changing the maximum to get smother curves. Note that changes in parabolic SAR are la
FREE

Optimized from 2004 to 2022. Optimize further after this date, use monthly or yearly. Experts need optimizing as markets develop new ranges. New Age Bot trades XAU/USD on 5 minute charts. Entry - Bollinger bands and trend trading reversals is used for entries. Stops - Trailing stops are used with ATR. Money - lots Bollinger band period - 20 MA period - 100 Deviation - 2.0 Symbol for build - XAU/USD Time frame for build - 5 minute charts Risk Disclaimer Trading foreign exchange on margin carri
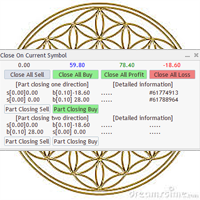
Utility / EA to simplify the exit from the drawdown. Allows you to gradually exit the drawdown correctly, reducing the volume of losing trades. At the same time, profitable trades opened on the same symbol cover losing trades in whole or in part. The volume of partial closing of a losing trade is calculated automatically. Trades opened both in one direction and in the opposite direction are supported. Position Management Closing positions only for purchase, only for sale, only profitable, only
Индикатор отображает изменение баланса В правом нижнем углу окна.
Отображаются следующие периоды Сегодня Вчера 3 дня Неделя 10 дней Месяц 3 месяца Полгода Год Все время Есть возможность выставить расчетное время. Удобно пользоваться для расчетов прибыли/убытков с определенного часа.
Будет полезен например ночным скальперам. Данные совпадают с расчетами отчета в терминалее.
FREE

OPTIMIZE BEFORE BACKTEST AND TRADING Day trade the markets. Any market, any time frame but its recommended to trade 5 minutes for some inputs but experiment with time frames and assets to see the best . It is important to optimize the inputs of the EA before back testing and using. Last month option to a year is recommended.
Parameters for intraday trading are: Weight Weight of signal of the module in the interval 0 to 1. GoodHourOfDay Number of the only hour of day (from 0 to 23) when tra

reguired set file Live Siqnal - is a trading system based on the correlation of several classical indicators with certain parameters to achieve the necessary goals of market entry and exit control. The minimum number of parameters greatly simplifies the work with the Expert Advisor. The strategy is based on a classic overbought/oversold system with the possible influence of market strength on the price movement in a certain direction. Recommendations for trading: - TF H1GBPUSD - leverage 1:500

Optimize for time frame and asset before back test and use, use last year or monthly for parameters. XAU/USD 1 HR recommended. Parabolic works on any asset or time frame. This EA uses parabolic sar as the signal. Percentage of margin is used for entries. So for low risk it would be 1% of margin and for medium risk it would be 5-10% and high risk would be above these amounts. Also taking into account the smaller time frame or larger time frame + asset for risk management assessment.
Risk

Expert advisor は 、 資産 を 監視 し 、 パラメーター の 入力 に 従っ て ルール に こと で 、 予期 し ない 損失 アカウント アカウント を ます ルール に 違反 と 、 、 は 取引 を し ます。 特定 の または 金銭 金銭 金銭 金銭 金銭 金銭 金銭 金銭 金銭 金銭 HIP損失ですべての取引をクローズするか、特定のパーセンテージまたは金銭的利益でクローズするように EA を設定できます。 このユーティリティは、プロップ トレーディング チャレンジでドローダウンを低く抑え、エクイティを保護するのに非常に役立ちます。
私の信号と他の製品はここにあります 応援、プレゼントは購入後ご連絡ください。 パラメーター: 1ペア限定:運用したいペアにEquity Guardを貼る アカウントのすべてのペアについて: Equity Shield TPアットマネー(0:OFF):TPインマネー SL アット マネー (0: オフ): SL アット マネー TP at % at account Equity: TP は、口座の X SL at % acc

マーチンゲール。 「Oberon iMA」 は15の個別のブロック(ミニエキスパートアドバイザー)で構成されており、利益を合計し、時間の経過とともにドローダウンを分配します。
特殊性: 各文字の個別の入力データ。 シンボルは繰り返すことができます(15個の同一のシンボルでさえ互いに別々に取引されます)。 1つの取引口座に、異なる設定で複数の「Oberon iMA」をインストールできます(条件を観察:Magic [i + 1]> Magic [i] +15)。 任意の1つのチャートにインストールされます。 ソフトウェアの処理能力が低い場合、「Every_tick_based_on_real_tick」モード (15 個のシンボルすべてを有効にする) でのテストは困難になるか、メモリ不足のために通貨ペアのクオートの履歴をロード中に終了する可能性があります。 この場合、入力データ(「Trade」パラメーター)の文字数を減らすか、テスト期間を短縮することができます。 しかし、最も正しいオプションは、より強力な仮想サーバー (VPS) をレンタルすることです。 ヘッジ口座の種類。 4 桁の

MT5インジケーター。
この指標は、任意のチャート、任意の時間枠、任意のブローカーで需要と供給のゾーンを検出し、ゾーン化します。 テクニカル分析に最適です。
デフォルトでは、赤い線は強い売りゾーンを示し、緑の線は強い買いゾーンを示しています。 線が引かれると (緑または赤)、99% の確率で価格がそのゾーンに戻って線を閉じます。
入力:
(bool) Four_candle = false : 内部計算に 4 ローソク ルールを使用するオプション。 デフォルトは false に設定されています。 (bool) Five_candle = false : 内部計算に 5 つのローソク足ルールを使用するオプション。 デフォルトは true に設定されています。 (色) Buy_color = Green : BUY シグナル線の色を選択するオプション。 デフォルトは緑に設定されています。 (色) Sell_color = 赤 : SELL シグナル線の色を選択するオプション。 デフォルトは赤に設定されています。 添付のビデオは、インジケーターがこれらのゾーンをユー

このプログラムを使用すると、MetaTrader 4 (MT4) と MetaTrader 5 (MT5) の間でトランザクションを任意の方向に簡単にコピーできます。このプログラムは、「Windows PC」および「Windows VPS」で動作するように設計されています。 あらゆる種類のコピーが可能
MT4 - MT4 MT5 - MT5 MT5 - MT4 MT4 - MT5 *The copier works only on forex and only with currency pairs
※MT4~MT5端末間のコピーには、Trade Copier for MT4 + Trade Copier for MT5の2つのバージョンが必要です。
MT4 - https://www.mql5.com/en/market/product/85792
パラメーター:
WORKING_MODE - 動作モード、信号の受信または送信。 FILE_ID - enter the file name identifier, for example 12345;
P

DESCRIPTION
The EasyFollowerTrader-Bot3-DayTrade indicator only trades with the trend. Thus, the indicator will, at first, observe the trend of three averages synchronous with the selected time-frame. Then the indicator observes the trend of the daily chart. When these two charts are moving in the same direction, we have the highest probability of winnings. We will call this region the region of high probability of gain.
In the region of high probability of gain, the indicator will indicate

DESCRIPTION
The EasyFollowerTrader Bot4 DayTrade indicator always trades with the trend. Thus, the indicator, at first, observes the trend of the average of the highs and lows of the candles of the selected time-frame. Then see if this trend is in line with the trend of the daily chart to operate in favor of the major trend. When these two charts are moving in the same direction, we have the highest probability of winnings. We will call this region the region of high probability of gain.
In

DESCRIÇÃO O indicador EasyFollowerTrader-Bot2-DayTrade opera apenas a favor da tendência. Assim, o indicador, em primeiro momento, observar a tendência de três médias síncrona com o time-frame selecionado. Em seguida, o indicador observar a tendência do gráfico diário. Quando estes dois gráficos estiverem se movimentando na mesma direção, teremos a maior probabilidade de ganhos. Chamaremos esta região como região de alta probabilidade de ganho. Na região de alta probabilidade de ganho, o ind

Simple ATR Modern 市場のボラティリティをより明確に追跡するためのシンプルなツールで、デイトレードやスイングトレードに最適です。 取引を開始する際や初心者にとって最適なインジケーターです。
ビジュアルインジケーターの色: ATR Daily - 青 Volatility Vision インジケーターと組み合わせて分析を強化しましょう。 市場の状況の変動を正確に測定し、デイトレードやスイングトレードの意思決定に不可欠です。 基本的な14日間(設定可能)の単純移動平均の真の範囲インジケーターを利用して正確性を確保します。 取引システムにおける取引開始または終了戦略の実施に理想的で。 ATR インジケーターが他より優れている理由: 簡単に使用できる: ATR インジケーターは設定が簡単で、初心者のトレーダーでも理解しやすいです。 汎用性: デイトレードやスイングトレードのどちらにも適しており、さまざまな取引戦略に柔軟に対応できます。 信頼性: ATR は正確な市場ボラティリティデータを提供し、トレーダーがより賢明な判断を下すのに役立ちます。 カスタマイズ可能: 移動平均期

お得な情報printscreenは、さらなる分析のための口座取引と画像の保存を自動化するために設計されたスクリプトです。 パネルを使用すると、履歴内のトランザクションの検索に関連する技術的な作業の時間を大幅に短縮し、すべての操作パラメータの表示と描画を
このスクリプトはどのようなタスクを解決しますか?:
期間を選択するだけで、スクリプトは指定した期間のすべての取引取引を検索し、価格レベルの表示と取引パラメータを含むパネルを持つ各画像を保 1つの取引のみの情報を保存する場合は、入力パラメータで適切なオプションを選択し、必要な取引のチケット(ID)を入力します。 スクリプトは、/"ターミナルディレクトリ"/MQL5/Files/"ブローカー名"/"アカウント番号"/"ポジションチケット"/"選択したファイルの数はここにあります"の原則に従って、各ファ スクリプトは、あなたのためのトランザクションに必要な情報を収集し、印刷画面上の別のパネルに記録します
スクリプトの操作の順序
スクリプトの実行
端末が取引口座に接続されていることを確認してください。 アカウン

WavePulse EA uses Price Action strategies and a built-in indicator to look for reliable signals with high winrate and low risk. The EA provides a very balanced risk-reward ratio and survives all market circumstances easily - even the most critical ones like Covid-19, Brexit, etc. It uses a martingale strategy to close all trades in profit. For more accurate trades, it is recommended to use the EA on M15 or higher timeframe. Recommend: Time frame: M15, H1. Use VPS with low latency (< 20ms). Use

The Roll the Field indicator displays signals in a simple and accessible way in two colors (when to buy and when to sell is determined by changing the color). Knowing the entry point of each currency is very important for every forex trader. The intelligent algorithm of the indicator accurately determines the trend, filters out market noise and generates entry signals.

IMPORTANT : When testing the EA or running it live, make sure to set "Activate MNG Martingale" to "True"
Hello & Welcome To MNG
MNG is a martingale EA that allows you to configure a lot of features that I'll detail below.
But first, I'd like to insist on the fact that a martingale EA is never safe, no matter if it has a good track record for 5+ years, if it shows incredible backtest results, if it's marketed as the best EA or whatever its price is ($30,000 or $50). A martingale EA might bl
FREE

One of the main definitions for monitoring the currency market is a trend, which is why the Megan indicator was created in order to display the trend in a visual form. Forex indicator Megan is a real trading strategy with which you can achieve the desired results. As soon as the indicator is set, the main indicators will immediately begin to be recalculated at the price of the traded pair, based on the postulates of technical analysis. In addition, when potential entry points are detected, visua

This indicator paints any Inside Bar found on the attached chart in a Dark Gray Colour with Black Borders and Wicks. If there are multiple consecutive Inside Bars, then they would also be successively painted Dark Grey with Black Borders and Wicks as well. You may opt to change the colours set by default in order to better contrast with your chosen background and chart colours. I made this Indicator out of necessity as my trading required it. But I know there may be others out there who may need
"EA Maximum Breakout Scalper" - the scalper uses 2 breakout strategies. 1 - strategy for the breakdown of the nearest support and resistance levels. The system uses the search for extremes using smart technology to recognize high-quality and low-quality breakdowns, with support for filtering extremes. For the training of the adviser, the history of quotations for 22 years was used. 2 - strategy for the breakdown of the nearest candles. A smart technology is used to recognize high-quality and lo

The Average Daily Range (ADR) is an indicator that shows how far a currency pair can move in a day. Automatically displays the upper and lower ADR levels. Automatically calculates the percentage and distance of ADR achieved by the currency pair for the day. Notifies when the price reaches the ADR level. Changes the color and thickness of the ADR line when the price reaches it.

Are you tired of the stress and frustration that come with Forex trading? Introducing G FORCE , the ultimate solution for a seamless and profitable trading experience. This expertly crafted EA (Expert Advisor) is designed to take the emotion out of trading, allowing you to trade with confidence and ease. G FORCE isn’t just another trading robot; it’s your professional trading partner, engineered to generate consistent profits while you sit back and relax. Whether you're new to trading or a seas

Everything is simple. The usual Information indicator.
Shows on the chart: Current spread, buy swap, sell swap, time to close the candle, broker time.
The indicator can be placed at the top right or at the bottom right of the chart.
Most often, the spread is called the difference between the sale and purchase price.
Swap is the cost of transferring a position to the next day.

In this indicator, Heiken Ashi candles are calculated with the most optimal method. You can also customize the results by adjusting the amount of period and method input. But the most important advantage of this indicator is the adjustment of the time frame value. You can use this to calculate the Heiken Ashi chandels to See in time frames with lottery in the lower time chart. In this case, you get the best signal to buy or sell using two or more Heiken Ashi indicators with different timeframes
FREE

F22 Raptor is a highly reliable, low risk EA, based on statistical arbitrage idea. Expert don't use any dangerous methods of money management and suitable for any broker conditions. The Expert Advisor tracks two correlated currency pairs at once and determines the moment, when a strong divergence occurs between the pairs. Then it opens opposite trades for each currency pair. Profit is formed during the reverse convergence of currency pairs. The Expert Advisor dynamically fixes profits and limi

Optimize before use in back test or live for better results for you and don't forget to account for spreads and slippage in optimization. This Expert is for 1 minute charts trading BTC/USD. Bitcoin on 1 minute use MACD, CCI and RSI for entry and exit logic. This EA was back tested and traded out of sample. Each trade has a stop loss and take profit. BTC compared to the indexes and Gold have huge differences, look at the example of traditional investing vs. Bitcoin. Yellow line represents

Boleta para operações Long & Short na bolsa Brasileira B3 exclusiva para o mercado A VISTA com lotes padrão. A boleta calcula automaticamente as quantidades dos ativos (compra/venda) da operação baseado no capital informado. É possível determinar os horários de início e término das operações quando selecionado opção para Day Trade. A boleta pode iniciar e terminar as operações automaticamente baseado em horários. Podem ser definidos altos de Ganho (TP) e perdas (SL) em percentual (%). Basta cli
You need to optimize before back test and use Last Month or Last Year Option in Tester. This is part of this EA, which has more advanced aspects to it: https://www.mql5.com/en/market/product/87051 This Expert work towards a positive expectancy. It take positions in a hedging fashion buy and sell on both sides. A hedge account is needed in order for this EA to do as intended. The EA is based on taking both sides, the random nature of the market and the capability of one side being in a positi

This is a regression tree indicator for MT4/MT5.
This indicator classificate nodes on the time period so that the deviation becomes smaller,
and displays regression line and channel for each node.
It's free!
Attached CartDemo.ex4 and CartDemo.ex5 is a Demo version and has the following limitations:
Method is RandomForest only
Maximum number of bars is 200
Maximum number of trees is 2
Maximum tree depth is 2
Calculated waste lines are shown
Not display correlation coefficients
Fu
FREE
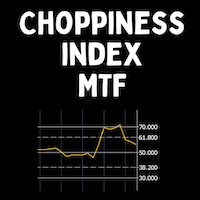
The Choppiness Index was created by Australian commodity trader E.W. Dreiss. It is designed to determine if the market is choppy (trading sideways) or not choppy (trading within a trend in either direction). A basic understanding of the indicator would be; higher values equal more choppiness, while lower values indicate directional trending. The values operate between 0 and 100. The closer the value is to 100, the higher the choppiness (sideways movement) levels. The closer the value is to 0,

この指標は、YouTube チャンネル「The Secret Mindset」のビデオ「A Reliable Scalping Strategy I Discovered After 1 Month of Price Action Trading」で提案された戦略に基づいています。 信号をフィルタリングするための戦略と条件の完全かつ詳細な説明は、ビデオで公開されています。 * YouTube チャンネルの作成者はこのインジケーターの開発とは関係ありません シグナルは他のインジケーターと組み合わせて、各トレーダーの判断によってフィルタリングする必要があります
インジケーター
前のバーの高値/安値範囲内にあるバーは、インサイドバーと呼ばれます。 インジケーターはオプションでこれらのバーをペイントできます 2 つの連続するインサイドバーはチャネルを作成し、多くの場合サポートレベルまたはレジスタンスレベルとしても機能します
信号
インジケーターは、2 つの異なるモードで信号矢印を表示できます。 FAST: バーが閉じるまでシグナルが再描画されるため、トレーダーはシグナル バーがすで
FREE

マーケットステップスは、Gannの時間と価格の相関関係に基づいて設計・構築され、プライスアクション特有のルールによって最適化されたFXマーケット用のインジケーターです。マーケットオーダーフローの概念を利用して、注文が集中する可能性のある価格帯を予測します。
インディケータ・レベルは、それ自体を取引に使用することも、他のストラテジーやインディケータの間違ったシグナルをフィルタリングするための組み合わせとして使用することもできます。すべてのトレーダーは、マルチタイムフレーム(TF)ゾーンと値動きの可能性をチャート上にまとめるために、このような強力なツールを必要としています。テスターモードでは、そのレベルがチャート上でどのように価格を支配しているかを試すことができます。
インジケータの利点
チャートに2つの異なるゾーンを表示し、異なるTFに対してトレンドとレンジ相場を指定することができます。 プライスアクショントレーダーは、異なるTF/プライスゾーンでのオーダーフローを確認したり、FTR(Fail To Return)/FTC(Fail To Continue)を確認するために
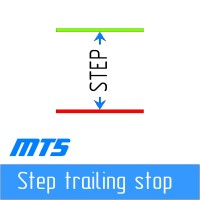
ステップバイステップ「トレーリングストップ」
このユーティリティを使用すると、「トレーリング ストップ」ツールを使用する際に、価格に従って「ストップ ロス」を移動するステップを設定できます。 「MetaTrader」ターミナルで利用可能な「通常の」「トレーリング ストップ」とは異なり、「ストップ ロス」の動きを 1 ピップ単位で設定できますが、この「トレーリング ストップ」は任意の増分で設定されます。 この設定により、価格が一方向に長時間移動した後、小さな修正のために反転し、その後再び同じ方向に移動し続ける場合に、偽のトレンド反転中にポジションを閉じることを回避できます。 可変の「ストップロス」移動ステップで「トレーリング ストップ」ツールの作業を管理しやすくするために、ツールの操作を実装するスクリプトは、開発者の Dmitry Fedoseev によって既存の取引パネル「eInTradePane」に適合されています。 トレーディング パネルのソース コードは、 https://www.mql5.com/en/code/220 で自由に入手できます。 「トレーリングストップ」が追加
FREE

リアルアカウントシグナル - https://www.mql5.com/ru/signals/1679047 MT4 エキスパート版 - https://www.mql5.com/ru/market/product/86048 時間枠: M1 推奨通貨ペア: EURUSD、GBPUSD、USDCHF、EURGBP、USDCAD、AUDCAD、CHFJPY、EURCHF、USDJPY。
蝉 - チーム Varko Group Inc. による最新の開発戦略が夜間の低ボラティリティに基づいている多通貨取引 Expert Advisor。 EA は、リスクの高いグリッド、マーチンゲール、または平均化戦略を使用しません。各ポジションは仮想ストップロスによって保証されています。適応トランザクション追跡アルゴリズムが使用されます。また独自の展開で、スプレッド拡大時の取引や大幅な相場ジャンプをサポート。
推奨事項: Expert を使用する前に、必ず作成者に連絡して、ブローカーのインストールと推奨事項について支援を受けてください。 ブ

Colors generated according to the Height and Depth parameter.
The analysis is carried out following the direction of the price and volume traded if the traded value exceeds the calculation base the system changes the color to green, informing you that the price direction is strong to buy, if the traded value is less than the calculation base the system changes to red, indicating that the price is strong for sale.
FREE
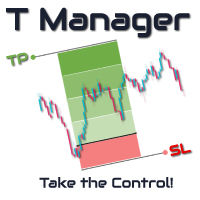
T Manager, the ultimate trade management solution designed by traders for traders. If you are searching for a simple and efficient trade panel, trade manager, or trade assistant, you are at the right place. The market contains a diverse number of those tools , but this one is designed by traders for traders . I designed this tool, and I am using it daily.
Take my advice and stop buying tools blended with un-useful features that you will never use, T Manager provides you with the essential

Este EA posue a opção de compra ou venda, você escolhe. Ele permanece sempre em operação, saindo de um com saldo positivo entra imediatamente na operação proxima. Não possui nenhuma estratégia de entrada com análise de mercado, apenas comprar ou vender a escolha do cliente. Ele tem um trunfo para operar martingale, Não se assuste com os resultados!! Se tiver um bom fundo de investimento usar pode usar essa ferramenta para ampliar o patrimônio. Teste muito este EA e compre sem MEDO.
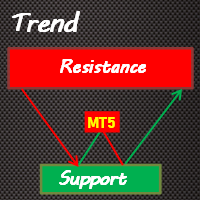
Trend Support Resistance is a fairly simple indicator that provides traders with confirmed immediate support and resistance in whatever timeframe you monitor. It's good for short-term and long-term order blocks. With the default settings, the indicator identifies critical support and resistance areas. Bearish Order Blocks are around the OrangeRed areas while Bullish Order Blocks almost always form near the LawnGreen areas. We have also added a Multi-timeframe feature that can be helpful to allow

66% discount only for the first 5 buyers (4 left), main price: 300 $ Show the signal as a line graph Prediction of 10 future candles and advanced display Prediction of individual candles graphically Can be used in the gold symbol Can be used in 15 minutes time frame Can be used only in gold symbol and only 15 minutes time frame
How the indicator works:
Using complex mathematical calculations, it predicts the future 10 candles. The predictions of this indicator are based on price. Theref

This indicator uses a different approach from the previous version to get it's trendlines. This method is derived from Orchard Forex, and the process of making the indicator is demonstrated in there video https://www.youtube.com/watch?v=mEaiurw56wY&t=1425s .
The basic idea behind this indicator is it draws a tangent line on the highest levels and lowest levels of the bars used for calculation, while ensuring that the lines don't intersect with the bars in review (alittle confusing? I kno
FREE

TransitGhost Signal indicator, this is one of my best forex trading strategy. The strategy is based on the simple moving average cross, 5 SMA AND 200 SMA of which take a longer time to cross. Whenever the is a cross between the 5 SMA and 200 SMA a signal will be given, when the 5 SMA cross the 200 SMA to the upside ,a buying arrow will appear on chart, and push notification(alert) "Buy now, use proper risk management" will be sent on both the MT5 PC and mobile app, and when the 5 SMA cross the 2
FREE

TRAILINATOR is a unique Solution to use different Trailing-Stop Variants and change your settings via Remotecontrol. You configure your Trailing-Stop for a specified Symbol only once. This setting will be used for all your Positions of the same Symbol. Currently we support these different Trailing-Stops: Standard : works like you use in Metatrader Terminal, starts trailing if your profit is greater than trailing stop Start after points : trailing stop will start after your defined points in p
FREE

TRAILINATOR is a unique Solution to use different Trailing-Stop Variants and change your Tradesetup via Remotecontrol. You configure your Tradesetup for a specified Symbol only once. This setting will be used for all your Positions of the same Symbol. Currently we support these Features: different Trailing-Stops: Standard: works like you use in Metatrader Terminal, starts trailing if your profit is greater than trailing stop Start after points: trailing stop will start after your defined poin

Write this EA for my own use. but decided to sell it as well . The EA has a wide variety of uses. Can be set as you wish. But please understand that profits depend on the capabilities of EA users. Not just the EA alone. I try to reduce the difficulty of use. Make EA easier to use and more friendly to investors. I want everyone to try the demo before actually buying it. To make sure this EA is right for you or not. ... About setting up my EA click that youtube link.

Theory VWAP is a volume-weighted moving average, bringing greater relevance to prices. The VWAP base calculation follows the classic formula described in Investopedia ( https://www.investopedia.com/terms/v/vwap.asp ). VWAP = sum(typical price[i]*volume[i]) / sum(volume[i])
Functionalities
Orion Intraday VWAP innovates by allowing the user to choose between the conventional Daily, Weekly and Monthly periods, also having the option of calculating the Intraday indicator, as used in other platfo

Proportional Trade Correction Prop Firm trading MT5
If you found this EA, it's probably because you're in a really specific situation. Here are the conditions if you want to use this EA correctly : - You want to be a prop firm trader. - You want to use signals from MLQ5 market. - You want your trades to be proportional to the signal provider.
If you're smart and you want to leverage your money thanks to prop firm trading without knowing how to trade, here's what you may think : "I will get

The indicator will plot a line on the chart that corresponds to the closing price of the previous day, and based on this, it will plot the percentage levels of change in the price of the asset in question. It can be used on any asset. Period: Determine whether the closing price should be daily, weekly or monthly Minimum percentage: Determine the percentage for the indicator to plot the levels and sub-levels on the chart, eg 0.5 it will plot on the chart a line for every 0.5% variation and the su

Optimize EA before test and buying. Euro King is for trading EUR/USD on 15 min time frames. Optimize to find the best stop loss and take profit for your risk management. This EA does not trade hundreds of times a day. In the test it traded 100 times in a year. Try other time frames to see if there optimizations for different results. The EA uses Bollinger bands, moving averages and RSI for logic in the entry and exits. Martingales are not used and all trades have a stop loss and a take pr

A version based on David Waves' description in his book 'Trade About to Happen' of his adaptation of the Wyckoff wave chart. The indicator directionally accumulates volume, adding to each brick or candle close, with color indication for up and down. it can be used it with tick or real volume, it also changes color when the accumulated value of the previous wave is exceeded, being the trade signal. Yellow color is used for doji candlestick, it will continue with accumulation without zero the sum

Fundamentação teórica A VWAP é uma média móvel ajustada pelo volume, ou seja, o peso de cada preço corresponde ao volume de ações negociadas no período, dando mais importância ao período em que se tenha mais negociações. A Orion Vwap Bands permite que o usuário use plote 8 bandas que podem ser utilizadas como suportes e resistências para o preço. Cada banda é calculada a partir da Vwap Tradicional:
Ex.: Se escolhermos o valor 0.25 para a plotagem da Banda 1, pega-se o preço da Vwap e acrescen

- 50% off - Telegram group : https://t.me/+5RIceImV_OJmNDA0 MT4 version : https://www.mql5.com/en/market/product/84526?source=Unknown%3Ahttps%3A%2F%2Fwww.mql5.com%2Fen%2Fmarket%2Fmy
Master Pullback is a complete system that gives unique trading opportunities and a clear indication of the market: trend, signals as well as stop loss and take profit levels. This system has been designed to be as simple as possible and detects extreme overbought and oversold zones, support and resistance levels, a

EA " Swing trade by porl " can use for EURUSD XAUUSD GBPUSD time frame H1 for good. The default settings can be used for saving ports EURUSD. but the minimum profit If you want high profit You can set the inputs you want. only that the value that is put into the supplied, if managing money in the port To fit, there will be a relatively stable profit. If adjusting the higher lot, the risk will be higher as well, but the profit will come according to the risk we invest. We recommend that every

Double Correlation indicator (free) plots two windowed correlations in a separate window. the size of window is taken as input before the two symbols to correlate to. Two symbols are taken as an input parameters as well as period length. and the two correlations are computed with the currently shown symbol ex: input GBPJPY and AUDNZD. current symbol EURUSD then the following will be computed corr(EURUSD,GBPJPY) and corr(EURUSD,AUDNZD) The indicator can be useful to run a multi-symbol pair trad
FREE
MetaTraderマーケットはMetaTraderプラットフォームのためのアプリを購入するための便利で安全な場所を提供します。エキスパートアドバイザーとインディケータをストラテジーテスターの中でテストするためにターミナルから無料のデモバージョンをダウンロードしてください。
パフォーマンスをモニターするためにいろいろなモードでアプリをテストし、MQL5.community支払いシステムを使ってお望みのプロダクトの支払いをしてください。
取引の機会を逃しています。
- 無料取引アプリ
- 8千を超えるシグナルをコピー
- 金融ニュースで金融マーケットを探索
新規登録
ログイン