YouTubeにあるマーケットチュートリアルビデオをご覧ください
ロボットや指標を購入する
仮想ホスティングで
EAを実行
EAを実行
ロボットや指標を購入前にテストする
マーケットで収入を得る
販売のためにプロダクトをプレゼンテーションする方法
MetaTrader 5のための新しいエキスパートアドバイザーとインディケータ - 59

MACros is based on Exponential Moving Average Crossover:
It can be used for: All Pairs: Forex, Cryptocurrencies, Metals, Stocks, Indices. All Timeframe All Brokers All type of Trading Style like Scalping, Swing, Intraday, Short-Term, Long-Term etc. Multiple Chart
*** MT4 Version-->> https://www.mql5.com/en/market/product/87538
Notification Setting: All type of notifications and Pop-Up available with this Indicator. (Can manually ON/OFF the notification as per requirements.)
Special Not

Symbol: XAUUSD Attach to any timeframe Min deposit: 1500$ - Calculate profit by month
If you want daily trade, this product maybe not suit with you. Because, Too frequent deals may negatively impact copying results
Please use cent account if you not enough money
Important : Please withdraw all profit weekly or monthly
Risk Warning: Trading Forex and Leveraged Financial Instruments involves significant risk and can result in the loss of your invested capital. You should not invest m
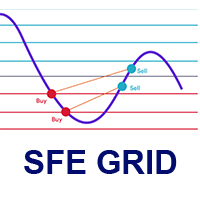
This EA is an Utility for define and execute a grid strategy. Join to the telegram group you can find in my profile page for have access to the different strategies proposed by the SFE community. BACKTEST AND LIVE The EA must be used on a M5 timeframe chart.
The current version works only in the Long side, and with symbols like BTC, ETH, GOLD, Stock Indices, STOCKS.
Do not work on Forex symbols.
This is a deliberate restriction, because the idea behind is use the strategy under 'reas

This indicator draws the high intraday price and the low intraday price of the first n minutes of the day. The chart shows the days with vertical lines and two horizontal lines to indicate the max and the min close price of the n first minutes of the day. The max/min lines start and end with the day calculated. With this indicator you can see how starts the day compared with the previous days. It is valid for any market inasmuch as the start time is calculated with the data received.
Paramete

Expert Advisor for Automatic Stop Loss and Take profit , calculated by Pips and cover all major pairs . you can activated the EA in your chart then place orders manually and the EA will be place TP and SL automatically for all opened orders , covered Buy market , Sell Market , Buy stop , Sell Stop , Buy limit , Sell limit . it is an easier tool that help you manage your order without effort . 10 Pips = 100 Points Pending orders SL and TP will be placed once order is activated . MT4 Version : ht
As traders, we all know that risk management is the most important aspect of profitable trading. So, we need to determine the lot size, every time we need to open a new trade. The FX lot size calculator is a simple tool that will help you to determine your lot size easily without using any third-party service but you will be able to do that by your MetaTrader terminal. LIMITED TIME OFFER: 30$ FOR 10 ACTIVATION.
Inputs:
Maximum_Risk_Prc: To determine your preferred risk%. For example, if your r
作成、探索、獲得! Expert Advisor を使用すると、ツールの価格を平滑化する強力で普遍的な指標に基づいて、完全に自動化された取引システムを構築できます。 EA に統合された一連のルールを使用して、独自の取引システムを作成します。戦略テスターでアイデアをテストします。利益のための実際の取引で、または追加のツールとして使用してください。 2021 年 10 月 19 日、MetaTrader 5 用の完全に無料の UniversalMA インジケーターを公開しました。UniversalMA は、膨大なカスタマイズ オプションを備えた移動平均です。 10種類のスムージング。構築する12の価格オプション。結果の移動平均の離散化の可能性。高速で最適化されたコード。インジケーターは非常に便利であることが判明し、ユーザーは気に入りました。 このインディケータを使用すると、それに基づいて任意の Expert Advisor を制限なしで作成できます。それにもかかわらず、このインディケータに基づいて完全に自動化された Expert Advisor を作成するための膨大な数のリクエストと提案を
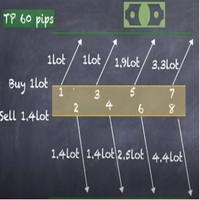
Strategy description can be seen in the attached video( https://www.youtube.com/watch?v=JzN1fEZmc40 ).
This hedging strategy strictly follows what is presented in the video.
The strategy works on any pair of forex, crypto, indices and other derivatives.
Through the settings, you can customize the size of lots, add pairs for operation, and profit and loss points.
The distance between sell and buy orders must be configured according to the number of decimal places of the pairs that will be

The RFOC Mini Chart was created to project a macro view of the market, which the option to select the timeframe of interest other than the main chart, it is possible to include 2 indicators: 1 - Moving average channel On the mini chart, the moving average will be created based on the prices of the selected time frame for the RFOC Mini Chart. The moving average period must be selected in the indicator settings pannel.
2 - Boillinger Band In the mini chart, a boillinger band will be created base
FREE

A professional tool for trading - the divergence indicator between the WPR and the price, which allows you to receive a signal about a trend reversal in a timely manner or catch price pullback movements (depending on the settings). The indicator settings allow you to adjust the strength of the divergence due to the angle of the WPR peaks and the percentage change in price, which makes it possible to fine-tune the signal strength. The indicator code is optimized and is tested very quickly as par
FREE

The purpose of the Combo OnOff indicator is combine differerent tecniques and approachs to the market in order to spot signals that occur simultaneosly. A signal is more accurate if it is validate from more indicators as the adaptive expectations can be used to predict prices.The On-Off feature and alarms help to look for the better prices to enter/exit in the markets
Moving Averages are statistics that captures the average change in a data series over time
Bollinger Bands is formed by upp

Having trouble marking where the various forex sessions start and end? Or perhaps your strategy requires you trade only in a specific session, then this is for you.
The session indicator shades the session you require in a certain color so that you can identify it easily. The sessions shown include: London session, New York session, Asian Session, Asian - London overlap and London - New York Overlap.
Difference source give varying time ranges for the various session, mostly differing by not
FREE

A unique professional tool is a divergence/convergence indicator between MACD and price, which allows you to receive a signal about a trend reversal in a timely manner or catch price pullback movements (depending on the settings). It is indispensable for those who trade divergences manually or with an Expert Advisor. The indicator settings allow you to adjust the strength of the divergence/convergence due to the angle of the MACD peaks and the percentage change in price, which makes it po
FREE

TIO Surfing – это стратегия торговли, которая подразумевает разбиение графика на сектора, поиск важных уровней и потенциально разворотных зон для торговли в этих участках. То есть по сути мы получаем некоторую комбинацию из скальпинга и среднесрочной торговли, что является очень эффективным. В основе работы советника применение секторной торговли. Используя разные периоды, ищутся повторяющиеся паттерны. И затем советник проплывает по волнам секторов от разных периодов на сети ордеров.

The RFOC Mini Chart was created to project a macro view of the market, which the option to select the timeframe of interest other than the main chart, it is possible to include 2 indicators:
In the full version it is possible to include 2 indicators: 1 - Moving average channel On the mini chart, the moving average will be created based on the prices of the selected time frame for the RFOC Mini Chart. The moving average period must be selected in the indicator settings pannel. 2 - Boillinger Ba
FREE

Good money/risk management is more than just position sizing, it's much more. Successful traders analyze your trading activities and keep an eye on your key figures. With the help of AccountMan you can also do this very conveniently, analyze your trading activities for the purpose of professional money / risk management. Evaluate your trades by trade symbol to see if trading is profitable overall with these. Would you like to keep an eye on your individual strategies? e.g. which strategy works b

An easy indicator that simply shows the moment we connect to the market. We can easily see what has happened while we were gone because the line has two different colors that show the start time. It is only that, a visualization aid that allow us to mark the market behavior while it was night time in our country, or if we have stopped several hours. Input: Server start working date: Day of month Month Year Hour Minutes
FREE
This EA is designed to automate Larry Connor’s System TPS - ( Time Position & Scale ) first described in his book “High Probability ETF Trading ” https://www.amazon.com/High-Probability-ETF-Trading-Professional/dp/0615297412 The operation of TPS can be summarized as follows: 1. Trade an ETF or Cash Index 2. The Index trades above its 200-day moving average 3. Open a 10% long position, if the 2-period RSI is below 25 for two days in a row 4. Increase position size by 20

Potential loss on all active and pending trades: if SL levels will be reached (or the current floating loss if the SL level is not set) My #1 Utility: includes 65+ functions, including this indicator | Contact me if you have any questions In the input settings you can adjust: Calculateion method : account currency / pips / points / % of the balance Position on the chart: bottom left / bottom right / top left / top right corner
Font: color, size and style Optionally you can includ

Fast Trade Detector (FTD) - Самый правдивый индикатор, который показывает истинное
настроение Большого Игрока.
На бирже есть Игрок, у которого есть всё для того, чтобы быть в первых рядах в книге торговых
приказов (биржевом стакане). Эти сделки как индикатор рыночного настроения сильного игрока.
Вы поймёте, что всё не совсем так, как представляли раньше. Вам откроются алгоритмы и стратегии
крупного участника рынка. Исполнение индикатора в виде гистограммы в подвале графика. Гистогра

TIO Spread Trading - это торговля разницей между двумя коррелируемыми парами. Советник находит расхождения в двух коррелирующих валютных парах GBPUSD и EURUSD, и торгует третей EURGBP в сторону их обратного схождения, продавая или покупая EURGBP. Коррелирующих AUDUSD и USDCAD, и торгует третей AUDCAD. Коррелирующих AUDCAD и NZDCAD, и торгует третей AUDNZD. Коррелирующих EURUSD и USDCHF, и торгует третей EURCHF.
Советник смотрит корреляцию от разных таймфреймов и открывает сд
Absolute volatility for each day for the last 4 weeks My #1 Utility: includes 65+ functions, including this indicator | Contact me if you have any questions The indicator is displayed in a separate window, it can be moved to any place on the chart. In the input settings you can adjust: Interface theme : dark / white; Calculation method: price, pips, points, % change;
Panel size Font size

TIO Oil - Советник торгует по классическим паттернам. Это смесь паттернов: VSA, зон перекупленности и перепроданности, разрыв импульса и ещё 10 паттернов. В случае дальнейшего движения строится сетка ордеров.
Преимущества: Постоянная работа советника. Не нужно ждать новостей для торговли, или каких-то событий. В отличии от скальперов, TIO Oil работает среднесрочно, и старается забрать всё ценовое движение, а не его часть. Советник не требует быстрого исполнения торговых приказов. Вре

Trailing Stop toolbox MQL5, better and friendly. Trailing Stop tool box using Moving Average, Parabolic SAR, Ichimoku Kijun-sen, trailing stop normal, trailing stop by candle, trailing stop by targets and trailing stop by lowest, highest candle numbers. Manage orders by currency pairs and comments, trailing one or many orders at same time. Mql4 versition: https://www.mql5.com/en/market/product/68181
Workflow: Set your comment, profit, stoploss, lotsize, t imeframes and chose indicator for beg

Monitor your favorite Symbols My #1 Utility: includes 65+ functions, including this tool | Contact me if you have any questions This tool opens in a separate window: it can be moved (drag anywhere), and minimized [v]. You can adjust the Watchlist on the panel: Click [edit list] to add / remove the Symbols from the Watchlist. Calculated value: it may either be the last [closed bar], or the current [floating bar]. Select the [timeframe] for calculation. There are 2 types of the value sorti

This indicator like small script only attach on any chart. It will export All symbol name and property to CSV file. Location at MQL5/File/Data/ Format CSV Pattern like ["Symbol","Category","Sector","Industry","Description"] Example : "USDX","","Indexes","Undefined"","US Dollar Index" "Coffee","","Commodities","Commodities - Agricultural"","Coffee Cash Contract" "Airbnb_Inc_(ABNB.O)","","Communication Services","Internet Content & Information"","Airbnb Inc" "Akamai_Technologies_(AKAM.O)","","Tech
FREE

Good Day,
"Horse Trader" is an Expet Advisor and Trding Robot which is based on Technical Analysis Indicator. This Algorithm is developed with extensive research to give best results over a period of time. It is based of low loss high return principle that helps to cut losses when trade goes wrong and during profits it keeps running a trade so that maximum profits can be taken out through the same. there are two kind of "Horse Trader" algorithms one focuses only on buy side trades with smal

Strategy Name: Horse Trader Robot HT01 Description: Horse Trader Robot HT01 is a fully automated robot. This uses a price action strategy, advanced money management. It is most effective in trend reversal. Maintained excellent risk- reward. Tested in real accounts with profits and guarantee of profit in future. Suitable for both beginners and experienced traders. It will put trade at market price once signal generated. Once trade is activated stoploss is placed as per strategy and take

Tired of complex order placement and manual calculations? Trade Dashboard is your solution. With its user-friendly interface, placing orders becomes effortless, by a single click, you can open trades, set stop loss and take profit levels, manage trade lot size, and calculate risk to reward ratios, allowing you to only focus on your strategy. Say goodbye to manual calculations and streamline your trading experience with Trade Dashboard. Download demo version right now.
You can find deta
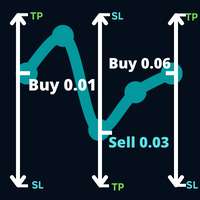
Open a direction on the trade that the market intends to follow and a trade that occurred on your trade trade following a trade that was pending on your trade trade a trade order that was pending on your trade trade operation.
Example: a buy operation with a lot of 0.01 at a price of 0.03 points, buy with a lot of 0.01 at a price of 0.01.0930, then a sell stop order of 0.03 will be decided. a new buy stop order is placed with a lot of 0.06 at a price of 1.0930.
Parameters: Volume ->

Discount on all my products until 01.05. Gold Veritas は、静かな時間のための完全に自動化された外国為替 Expert Advisor です。 アドバイザーの仕事の監視: https://www.mql5.com/en/users/bayburinmarat/seller 正しい GMT 設定: https://www.mql5.com/en/blogs/post/743531 最も理解しやすくシンプルな最適化に必要なすべてのパラメーターは、わずか6つの設定で利用できます.リスクレベルを調整するか、特定のブローカー用に自分でカスタマイズして、アドバイザーを好みに合わせることができます. XAUUSD、XAUJPY、XAUAUD、XAUEUR の 4 の通貨ペアのパラメータが EA コードに組み込まれています。すべてのブローカーが取引用にそのようなペアを提供しているわけではないことに注意してください。デフォルト設定を使用することも、必要に応じて設定を変更することもできます。
利点:
指値注文を使用することが可能です - これ
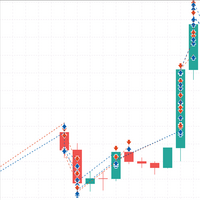
MT4 Version : https://www.mql5.com/en/market/product/87060 Matrix Hacker はヘッジされたアカウント専用で、ランダム ウォークを使用します。過去は関係ありません。 EA は、市場で安定した足場を維持し、アスクとビッドの両方をカバーするように設定されています。トレーダーに応じて、さまざまな量のサイズとボリュームでビッドとアスクを売買します。これは、最適化と過度のレバレッジについての知識が必要なため、初心者にはお勧めできません。小さなピップをスキャルピングし、範囲内に保つための設定を使用することをお勧めします.
この EA は 4 つの取引を開く可能性があるため、これを理解して、入力のサイズが正しいことを確認してください。固定ロット サイズを使用するため、固定ロットでの 4 つの取引を考慮する必要があります。ライブで取引する前に、この EA を最初にデモで使用し、確信が持てるまで増分ロットでのみライブに移行します。マイクロロットごとに1000ドルをお勧めします。デイトレードでは、DMA ブローカーを使用し、ス
5 EMA Scalping Strategy Multi Symbol Scanner
This EA utility will scan all symbols which are selected in marketwatch and alert when such condition is formed in chart when Candle low is above EMA 5 for Sell alert and Candle high is lower from EMA5 so you can be ready before selling or buying for scalping purpose on 5min chart For more details watch attached video Logic : When a candle closes above 5 EMA in 5 mins chart, Wait for its low to break and Sell when low is broken by wick, Your SL sh

快適なFX取引を実現する多通貨取引ロボット。カスタマイズ可能なパラメータは最小限であるため、初心者から経験豊富なトレーダーまで幅広く対応します。取引ロボットを1つの通貨ペア、例えばEURUSDにインストールし、結果を見るだけで、それ以上の操作をする必要はありません。VPSサーバーやブローカーは必要ありません。継続的な最適化を必要としない信頼性の高いボット - 一度インストールし、設定すれば忘れることができます。 *write me after purchase to get the second version as a gift
Signal: https://www.mql5.com/en/signals/1722303 MT4 - https://www.mql5.com/en/market/product/86883
必要条件
M15タイムフレーム
最低入金額 1000ドル
レバレッジ1:500
VPSサーバー
botのインストール方法と設定方法。
1. EURUSD通貨ペアにボットをインストールする
2. セットタイム

KT Stochastic Alerts is a personal implementation of the Stochastic oscillator that provide signals and alerts based on six custom events: Bullish Crossover: When Stochastic main line cross above the signal line. Bearish Crossover: When Stochastic main line cross below the signal line. When Stochastic enter in an overbought zone. When Stochastic exit from an overbought zone. When Stochastic enter in an oversold zone. When Stochastic exit from an oversold zone.
Features
A perfect choice for

XFlow shows an expanding price channel that helps determine the trend and the moments of its reversal. It is also used when accompanying transactions to set take profit/stop loss and averages. It has practically no parameters and is very easy to use - just specify an important moment in the history for you and the indicator will calculate the price channel. This is a demo version limited to CHF currency pairs. Designed to familiarize you with the interactive use of XFlow DISPLAYED LINES ROTATE
FREE

A professional tool for trading - the divergence indicator between the MACD and the price, which allows you to receive a signal about a trend reversal in a timely manner or catch price pullback movements (depending on the settings). The indicator settings allow you to adjust the strength of the divergence due to the angle of the MACD peaks and the percentage change in price, which makes it possible to fine-tune the signal strength. The indicator code is optimized and is tested very quickly as
FREE

Crash Warrior is an automated hands-free robot that uses a very efficient hedging strategy for Crash 1000 Index MT5, advance probabilistic analysis. Effective in the consolidating and trending markets, does not need force optimization, which is the main factor of its reliability and guarantee of stable profits in the future. Suitable for beginners and experienced traders.
Requirements Trading pair -----------> Crash 1000 Index (Only) Time Frame -----------> H1 Minimum Depo
FREE

A professional tool for trading - the divergence indicator between the Stochastic and the price, which allows you to receive a signal about a trend reversal in a timely manner or catch price pullback movements (depending on the settings). The indicator settings allow you to adjust the strength of the divergence due to the angle of the Stochastic peaks and the percentage change in price, which makes it possible to fine-tune the signal strength. The indicator code is optimized and is tested ver
FREE

Stack Manager is a MT5 utility that is built to help traders: manage existing stacked trades (multiple trades opened on the same symbol) copy SL / TP levels to newly opened trades update SL / TP levels for all stacked trades, if one SL or TP level is modified calculate and show global SL / TP in currency and points (for all open trades in a stack) SL / TP autocomplete from phone (if left on a VPS, traders can place orders on a phone and SL / TP levels will be copied from the existing trades)
C

A unique professional tool is a divergence/convergence indicator between MACD and price, which allows you to receive a signal about a trend reversal in a timely manner or catch price pullback movements (depending on the settings). It is indispensable for those who trade divergences manually or with an Expert Advisor. The indicator settings allow you to adjust the strength of the divergence/convergence due to the angle of the MACD peaks and the percentage change in price, which makes it possib
FREE

A professional tool for trading - the divergence indicator between the OsMA and the price, which allows you to receive a signal about a trend reversal in a timely manner or catch price pullback movements (depending on the settings). The indicator settings allow you to adjust the strength of the divergence due to the angle of the OsMA peaks and the percentage change in price, which makes it possible to fine-tune the signal strength. The indicator code is optimized and is tested very quickly as
FREE

Session Killzone Indicator
Indicator that helps you to identify the killzone times of both London and NewYork sessions which usually is the most times for high volatility and taking liquidity from the market. Killzone times are configurable through indicator parameters. The indicator adjusts the range of the killzones based on the daily trading range.
FREE

A professional tool for trading - the divergence indicator between the RVI and the price, which allows you to receive a signal about a trend reversal in a timely manner or catch price pullback movements (depending on the settings). The indicator settings allow you to adjust the strength of the divergence due to the angle of the RVI peaks and the percentage change in price, which makes it possible to fine-tune the signal strength. The indicator code is optimized and is tested very quickly as p
FREE

A unique professional tool is a divergence/convergence indicator between AC and price, which allows you to receive a signal about a trend reversal in a timely manner or catch price pullback movements (depending on the settings). It is indispensable for those who trade divergences manually or with an Expert Advisor. The indicator settings allow you to adjust the strength of the divergence /convergence due to the angle of the AC peaks and the percentage change in price, which makes it possible to
FREE

The Average Daily Range (ADR) is an indicator that shows how far a currency pair can move in a day.
Automatically displays the upper and lower ADR levels.
Automatically calculates the percentage and distance of ADR achieved by the currency pair for the day.
Changes the color and thickness of the ADR line when the price reaches it.
The payment is made in 14 days. It is displayed on timeframes from M1 to M30.
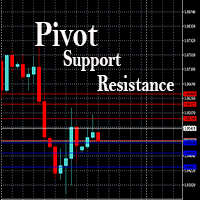
This EA is designed to calculate and draw Pivot Point, Support and Resistance for your selected time frame on the chart.
Works on all currency pair and on any time frames available on MT5.
To make sure the EA works, you need to select the pivot time frame as well as the candle shift that you want to calculate the pivot.
0 = Current candle on chart
1 = Previous 1 candle on the chart

Do you know what is The Blue Ocean Strategy ?
It is when an entrepreneur goes on a brand new market with no concurrence because nobody knows about it. This way, the entrepreneur is in a situation of monopoly and can enjoy this situation as long as nobody comes into the market. And you know what ? This situation is reproducible in bot trading thanks to the Blue Ocean Strategy EA MT5.
I’m a prop firm trader and I use it myself to make all my trades. After many years of use, a friend told m
Algo Bot is an expert advisor that is designed and optimized for GBPUSD. It is extremely easy to use, just open the GBPUSD pair, load the bot and activate Algo Trading. You can leave the default values. This bot does not use any technical indicator, its algorithm is based on price action, placing BuyLimit and SellLimit orders in optimal zones for GBPUSD.
The parameters of the EA are: Magic number: Number to identify the positions of this EA. Points to place the next order: Points at which the
The Indicator assists in decision making along with the user's market reading. By drawing the trend, this indicator becomes very useful on days of high volatility in the market, that is, it offers strategic insights on days of economic data, news or pronouncements. On flat market days it becomes usual to identify possible market reversals. Follow Youtube to understand the most suitable scenarios for its use.

Full Automated Trading panel . it works on any trading instruments: Forex, Stocks, Futures, Indices, CFD, Bonds, Cryptocurrencies; interface minimization function; flexibility of use;
Join my channel and check video of it ===> https://t.me/Ash_TheTrader/4986
Features :
Auto SL and TP Auto Close partial Auto Trailing Session Time Alert Time of trading Alert Profit and Percentage and etc.
FREE

Данный индикатор показывает объем каждого бара (видимый диапазон) в пунктах. Гибкие настройки отображения значений. Возможна настройка параметров показа. Индикатор создавался для личного пользования, анализа графиков. Параметры: Color - цвет текстовых меток; Position - позиция метки: 0 - снизу, 1 - сверху; FontSize - размер шрифта; Angle - угол наклона текста; GapPoints - отступ по вертикальной оси.
FREE

OnBoard stats is a panel that show in a single view a lot of usefull information about working orders and trading account. It has 4 different sub-panels (from left to right): Symbols order statistics : it can be found symbols for which there are orders (market or pendings). Symbol with pendings are colored with "Pendings color". Clicking on a specific symbol row, chart will be changed to that symbol. Current symbol statistics : informations about the "current" symbol, the one which is opened in
FREE

KT XMaster Formula is a buy & sell signal indicator that works magically on most of the timeframes and currency pairs when used correctly.
The indicator uses calculations based on moving averages, RSI, and MACD. It is usually appropriate for scalping and trend trading - whether you are a novice or an experienced trader, the signals generated by this indicator are simple to understand and implement.
Overview The indicator comprises green and red dots arranged in wavy lines. These dots corre
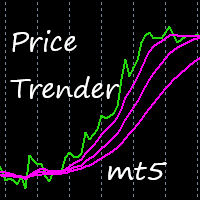
This indicator uses a special algorithm to plot the 4 lines for trading. Great for scalping. Features alerts. Settings for trend filters. How to use: Simply attach to any chart with default settings. Buy when the three pink lines converge below the green line. Sell when the three pink lines converge above the green line. Best results when looking at three or more time frames, and the three blue lines have just converged below or above the green line.
Use as you see fit for your strategy. Best r
The BoomAndCrashEA , based on vector machine learning, is an advanced trading tool that uses the latest advances in computing technology to analyze the forex market and predict future price movements. The Expert Advisor will use vector machine learning to learn huge amounts of historical data and quickly and efficiently detect patterns in the market. It will use a sophisticated and complex proprietary algorithm which uses advanced mathematical calculations to solve complex problems and optimize
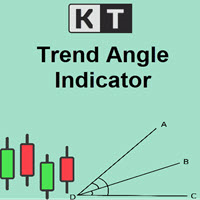
The KT Trend Angle helps to identify ranging and trending markets. The idea is to only enter a trade following the market trend if the slope is steep enough.
An angle is the ratio of the number of bars to the number of points: The bars mean the time offered by standard (M1, M5, etc.) and non-standard time frames. Points represent the unit of price measurement with an accuracy of 4 or 5 decimal places.
Input Parameters Period: An integer value to define the intensity of angled trendlines. A

2 copies left at 49 USD. Next price is 99 USD . set file
- This is a very aggressive trading strategy, based on a modified MACD indicator. It is used to analyze the anomalous zones of the market + author's methodology to restore the critical movement.
The strategy was developed taking into account the movement of the currency pair USDCHF and the best rates of trade just on it.
Recommendations:
- H1 USDCHF - Leverage of 1:500 or higher (ideally 1:1000 or 1:2000) - Minimum deposit 100 uni

KT Forex Blau Balance combines elements of momentum and volatility. It helps you identify entry and exit points.
Blau Balance consists of two moving averages (a slow-moving average and a fast-moving average) intersecting key transition points in market price. The indicator turns green or red when one is above or below the other, signaling to buy or sell trade signals.
It can be used in currency pairs and other markets that your MT4 or MT5 platform supports. Both short-term and long-term tra

The KT De Munyuk is a trend-based indicator that uses Parabolic SAR to identify the market direction. The indicator shows the PSAR in the form of green/red dots using a separate window. Buy Signal: When a green dot appears after a series of at least three red dots. Buy Exit: When a red dot appears on the current or next higher time frame. Sell Signal: When a red dot appears after a series of at least three green dots. Sell Exit: When a green dot appears on the current or next higher

In MetaTrader, plotting multiple horizontal lines and then tracking their respective price levels can be a hassle. This indicator automatically plots multiple horizontal lines at equal intervals for setting price alerts, plotting support and resistance levels, and other manual purposes. This indicator is suitable for Forex traders who are new and looking for chances to make quick profits from buying and selling. Horizontal lines can help traders find possible areas to start trading when the

KT Forex Trend Rider uses a trend following algorithm developed specifically for the Forex market to provide reliable buy & sell signals across the major currency pairs. It works best on major FX pairs and all time-frames.
Features
It comes with a Multi-Timeframe scanner that can search for upcoming signals across all the time-frames. It comes with four preset profiles to facilitate trading for scalpers, tick-trend, swing, and trend traders. It marks the potential reversal points in the mark
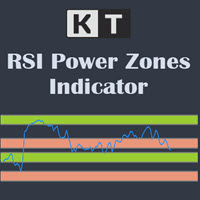
The KT RSI Power Zones divides and shows the movement of RSI into four different power zones to identify the potential support and resistance zones using the RSI.
Bull Support The bull support ranges from 40 to 50. The price is expected to reverse to the upside from this zone.
Bull Resistance The bull resistance ranges from 80 to 90. The price is expected to reverse to the downsize from this zone.
Bear Support The bear support ranges from 20 to 30. The price is expected to reverse to the

KT Price Border creates a three-band price envelope that identifies potential swing high and low areas in the market. These levels can also be used as dynamic market support and resistance. The mid-band can also be used to identify the trend direction. As a result, it also functions as a trend-following indicator. In addition, its ease of use and more straightforward conveyance of trade signals significantly benefit new traders.
Features
It works well on most of the Forex currency pairs. It

The BSI stands for Bar Strength Index. It evaluates price data using a unique calculation. It displays readings in a separate window. Many financial investors mistake this indicator for the Relative Strength Index (RSI), which is incorrect because the BSI can provide an advantage through its calculation method that the RSI indicator does not. The Bar Strength Index (BSI) is derived from the Internal Bar Strength (IBS), which has been successfully applied to many financial assets such as commodit

The KT Tether Line is a trend-following tool consisting of three indicators that work together to generate trading signals. It can correctly identify market trends while signaling trade entries. It was first introduced by Bryan Strain in the Stock & Commodities magazine in 2000 in "How to get with the trend and out at the end."
The Concept
When a market trend is confirmed, the most challenging part is determining the timing of the entries. This indicator alerts you to potential trend reversal
Current strength of the 8 major currencies My #1 Utility: includes 65+ functions, including this indicator | Contact me if you have any questions The indicator is displayed in a separate window, it can be moved to any place on the chart. In the input settings you can adjust: Interface theme : dark / white; Prefix and Suffix, if the currency pairs on your broker have it:
(e.g. if Symbol is "EURUSD .pro ", please set " .pro " as a Suffix); Panel size Font size
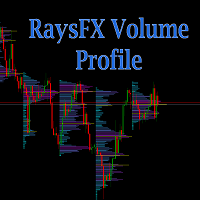
Calculation method The calculation method is summing the number of deals performed at a certain price. Alternatively, the volumes at a certain price can be summed if the real volume type is set in the parameters. The trade data is interpolated based on the most accurate terminal data available (М1 timeframe data). Each bar is divided into several trades based on the estimated price movement inside the bar. This is a distinguishing feature of the product setting it apart from other ones that hav

Supply / demand zones: observable areas where price has approached many times in the past. My #1 Utility: includes 65+ functions, including this indicator | Contact me if you have any questions The indicator shows where the price could potentially be reversed again. Usually, the more times the price has been rejected from the level, the more significant it is. In the input settings you can adjust: Enable or disbale Weak zones; Show or hide zone description; Font size; Set the bas

Harpoon :It is a fully functional automated system that uses a tested strategy to exit statistically significant price levels and adapts to different conditions. This system is adjusted taking into account the delay in the execution of orders at different stages of the transaction. Expert Advisor uses price action to determine levels, which is an undeniable advantage compared to constantly lagging indicators. Signal : https://www.mql5.com/en/signals/1251860
Considering that this expert mus
MetaTraderプラットフォームのためのアプリのストアであるMetaTraderアプリストアで自動売買ロボットを購入する方法をご覧ください。
MQL5.community支払いシステムでは、PayPalや銀行カードおよび人気の支払いシステムを通してトランザクションをすることができます。ご満足いただけるように購入前に自動売買ロボットをテストすることを強くお勧めします。
取引の機会を逃しています。
- 無料取引アプリ
- 8千を超えるシグナルをコピー
- 金融ニュースで金融マーケットを探索
新規登録
ログイン