YouTubeにあるマーケットチュートリアルビデオをご覧ください
ロボットや指標を購入する
仮想ホスティングで
EAを実行
EAを実行
ロボットや指標を購入前にテストする
マーケットで収入を得る
販売のためにプロダクトをプレゼンテーションする方法
MetaTrader 5のための新しいエキスパートアドバイザーとインディケータ - 56

Type(1EMA,2DEMA,3TEMA) FastPeriod SlowPeriod SignalPeriod PriceApplied ( HIGH(H) LOW(L) OPEN(O) CLOSE(C) MEDIAN(HL) TYPICAL(HLC) WEIGHTED(HLCC) )
Deviate Up Deviate Down Deviate Bar
What Is Moving Average Convergence/Divergence (MACD)? Moving average convergence/divergence (MACD, or MAC-D) is a trend-following momentum indicator that shows the relationship between two exponential moving averages (EMAs) of a security’s price. The MACD line is calculated by subtracting the 26-pe
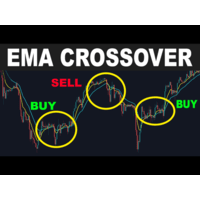
Moving Averages Expert EA is a type of automated trading strategy that utilizes two different moving averages to generate buy and sell signals. The moving averages are based on historical price data, and they are used to identify trends and determine the direction of the market. This EA by default generates buy signals when the fast moving average crosses above the slow moving average , indicating that the market is trending upwards. Conversely, sell signals are generated when the fast moving av

The parabolic SAR indicator, developed by J. Welles Wilder Jr., is used by traders to determine trend direction and potential reversals in price. The technical indicator uses a trailing stop and reverse method called "SAR," or stop and reverse, to identify suitable exit and entry points. The parabolic SAR indicator appears on a chart as a series of dots, either above or below an asset's price, depending on the direction the price is moving. A dot is placed below the price when it is trending u

What Is the Relative Vigor Index? The Relative Vigor Index (RVI) is a momentum indicator used in technical analysis that measures the strength of a trend by comparing a security's closing price to its trading range while smoothing the results using a simple moving average (SMA). The RVI's usefulness is based on the observed tendency for prices to close higher than they open during uptrends, and to close lower than they open in downtrends. KEY TAKEAWAYS The Relative Vigor Index (RVI) is a
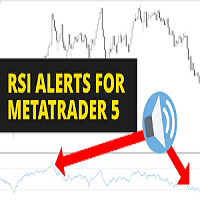
RSI Bot, send alert to mobile, buy when RSI<=20, send alert sell when RSI>=80 you can set parameter RSI in setting Inp_RSI_ma_period = 14; // RSI: averaging period Inp_RSI_applied_price= PRICE_WEIGHTED; // RSI: type of price Inp_RSI_LevelUP = 60; // RSI Fast and Slow: Level UP Inp_RSI_LevelDOWN = 40; // RSI Fast and Slow: Level DOWN Inp_RSI_stringUP ="Signal Sell";// RSI Fast and Slow: Level UP label Inp_RSI_stringDOWN ="Si

Long & Short Based on Cointegration Statistical and Quantitative Long-Short (Pair Trading) approach for long and short positions. Your CPU will always be safe and stable when using Multiple Linear Regression if you have a reliable indicator. Based on the results of this indicator, you can execute a long and short or a long and long/short and short trade between two separate assets. It can show you a Highly informative dashboard based on Cointegration Search you determine, with all statistical d

I developed this vwap with more settings in order to be customized as much as possible. VWAP is a really strong indicator for your trading. It can be used to check if the market is in balance or ranged, and also you can use the levels as support/resistence/target. In the pictures you can see the main settings, and you can select the use of real volume from the broker.
Hope you will find it useful. Many thanks in advance.
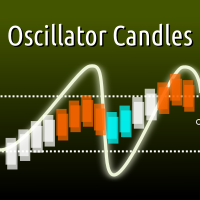
With this indicator you can colorize the candles on your chart based on the output of any oscillator indicator. Supporting both built-in and custom indicators, with the ability to set up to 5 custom parameters, custom color scheme, and upper/lower threshold values. Most built-in indicators in MT5 will be found under "Examples\\" path. For example, to use default RSI indicator, set your indicator path to "Examples\\RSI" in the inputs dialog. Input01-05 sets the custom parameters of your indicator

EMA BASEd ON EMA, ICHIMOKU-Kejun-sen line and MACD input group "RSI Setting" input int Inp_RSI_ma_period = 7; // RSI: averaging period input ENUM_APPLIED_PRICE Inp_RSI_applied_price = PRICE_WEIGHTED; // RSI: type of price input double Inp_RSI_LevelUP = 60; // RSI Fast and Slow: Level UP input double Inp_RSI_LevelDOWN = 40; // RSI Fast and Slow: Level DOWN input string

Fibonacci retracement levels—stemming from the Fibonacci sequence—are horizontal lines that indicate where support and resistance are likely to occur. Each level is associated with a percentage. The percentage is how much of a prior move the price has retraced. The Fibonacci retracement levels are 23.6%, 38.2%, 61.8%, and 78.6%. While not officially a Fibonacci ratio, 50% is also used. The indicator is useful because it can be drawn between any two significant price points, such as

Build your own model to predict averages of turning points of the Triple Moving Average Oscillator. It is simple. Rate me with stars. Just load the indicator Triple Moving Average Oscillator in you platform and choose the period. Scroll through to observe the averages of the highs and lows over a period of time. Add the levels for a buy and a sell on the Triple Machine and this will show the average of highs and lows to look for buys and sell. You can load multiple copies with multiple levels.
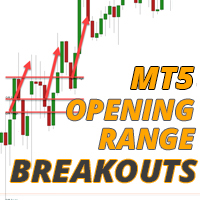
株価指数の開始時に発生する爆発的な動きから利益を得て、毎日実行可能な優位性を手に入れましょう。 オープニング レンジ ブレイクアウト EA は、DAX、DOW、NASDAQ、S&P500 などの主要な株価指数で毎日オープン直後に形成されるトレンドを捉えるために、好みに合わせて微調整できます。 これらのオープンは毎日同時に発生するため、いつボラティリティが発生するかを知ることができ、多くの場合、この EA でキャプチャして取引セッション全体に乗ることができる強いトレンドが形成された直後に発生します。
始値の範囲は、通常、株式市場が開いてから最初の 5 ~ 15 分であり、大規模な市場参加者による最初の注文の後、投機的な取引が開始されます。 開いた後、2 つのうちの 1 つが発生する傾向があります。 1. インデックスが上昇し、反転し、再び反転するレンジまたはローテーション日を取得します。 最近では、戦略と EA が損益分岐点になるか、少額の損失を出すことがよくあります。 2. 何時間にもわたって市場が一方向に動く傾向がある日。 これらは、戦略が実際にバンクし、トレンドに乗って 3

機能
フィボナッチ・リトレースメント・トレーディングのためのインジケータ 1時間、4時間、1日、1週間の前のバーから選択されたバーに基づいてフィボナッチ・チャートが描かれます。 市場価格がフィボナッチ・レベルに触れると、色が変わり、タッチした時間が表示されます。 フィボナッチ・グラフは、-23.6、0、23.6、38.2、50、61.8、76.4、100、123.6のレベルに描かれ、バーが更新されるとチャートがリフレッシュされます。
変数
タイムフレーム:1時間、4時間、1日、1週間から選択されたタイムフレームでフィボナッチ・チャートが描かれます。 FiboWidth:レベルの太さを決定します。 FiboStyle:ピボット・レベルのスタイルを設定します。 TouchedColor:タッチしたときに変わる色です。
エラーがある場合や改善点がある場合はコメントしてください。 評価は開発者にとって大きな助けになります。満足していただける場合は5つ星をお願いいたします。
FREE

トレンドが勃発しているときにアラートを取得します。 この指標は、価格が支配的な傾向の方向に大きな動きをするときに信号を送ります。 これらの信号は、エントリポイント、またはトレンド内の既存の位置に追加するポイントとして機能することができます。
注:以下の傾向は、低い勝率(50パーセント未満)を持っていますが、平均勝利貿易のリターンは、通常、平均負け貿易よりも3-5倍大きいです。
簡単なセットアップ 任意の時間枠で、任意のグラフにドラッグアンドドロップします。 アラートを有効にする(オプション) そして、あなたは完了です! 視覚的および音声的な警告 お使いの携帯電話に直接送信されるアラート お使いの端末に送信されたアラートをポップアッ マルチユース 株,外国為替,オプション,先物 柔軟性 任意の時間枠で動作します
FREE

市場内で開発傾向にアラートを取得するには、この指標を使用してください。
この指標を使用すると、彼らが開発するように、市場で発展している傾向についてのアラートを取得することができるようになります。 この指標は、トレンド内のエントリまたは終了を識別するために使用できます。 この指標は、より高い時間枠からの情報と、現在の時間枠の価格の動きを組み合わせて、買いまたは売りの信号を出力します。 指標は、傾向の変化、または支配的な傾向の継続を識別することができます。
注:トレンドフォローは低い勝率を持っていますが、トレンドのリターンは平均損失の3-5倍の大きさにすることができます。 簡単なセットアップ 任意の時間枠で、任意のグラフにドラッグアンドドロップします。 アラートを有効にする(オプション) そして、あなたは完了です! 視覚的および音声的な警告 お使いの携帯電話に直接送信されるアラート お使いの端末に送信されたアラートをポップアッ マルチユース 株,外国為替,オプション,先物 柔軟性 任意の時間枠で動作します
FREE
トレンドフォローおよび再描画のない外国為替取引ゲージ。
そのシグナルは、完全に自動化された方法で計算および提供され、移動平均の交差に基づいています。 これらのシグナルは単純な売買矢印の形で表示されるため、初心者に優しいツールです。 それにもかかわらず、信号の信頼性は本当にしっかりしています。 あらゆる外国為替取引戦略と組み合わせて使用できます。
トレンド シグナル アラート インジケーターは、あらゆる種類の時間枠と通貨ペアに適合します。 メインの取引チャートに直接表示されます。 デフォルト設定は、入力タブから直接変更できます。
トレンド シグナル アラート インジケーターの詳細 そのインディケータの背後にある主なアイデアは、市場のトレンドとトレードシグナルを示す簡単な方法を提供することです. その結果、初心者と上級トレーダーの両方がツールを利用できます。 スクリーンショットで MT5 でアクティブ化したときにどのように見えるかを見てください。
トレンド シグナル アラート インジケーターの構造 ご覧のとおり、これは、それに応じて取引する売買矢印の付いた単なる線です

このテキストは英語からの機械翻訳です。 英語版 ニュース エクスプローラーは、価格チャート上の経済カレンダー イベント間を移動できるツールです。 ターミナルでフル機能の経済カレンダー。 カレンダー イベント間のクイック チャート ナビゲーション。カレンダーのウェブサイトを開いたり、日付をコピーして貼り付けたり、チャートをそれらの日付まで手動でスクロールしたりする必要はありません。イベントのある線をマウスで 1 回クリックするだけで、チャート上ですべてを利用できます。 市場の反応は、発表時間中の最大の価格アクションとして計算されます。これは、ほとんどのカレンダーで使用される 3 スコアの重要度分類よりもはるかに正確です。それはまさにニュース取引に関連するものです。 イベントのリストは、計算された市場の反応によってソート可能です。何千ものイベントの中から実際に市場を動かしたものだけがテーブルの一番上に表示されます。 時間、国、通貨、タイトル フィルターにより、必要なイベントのみを探索できます。 プログラムを起動します。チャートを M1 に設定し、価格履歴をチェックして読み込み、カレンダーを

スキャルピング プロジェクト EA は、スキャルピング ブレイクアウト戦略に従います。相対的な高値と安値からのブレイクアウトを取引します。エントリーストップ注文は、可能な限り最速の実行のために使用されます。調整可能なトレーリング ストップによって利益を確保できます。
この戦略は小さな平均利益で機能するため、スプレッドと手数料の低いブローカーと取引することを強くお勧めします。ここでは取引コストが重要です。
スクリーンショットに示されているバックテストは、デフォルト設定で行われました。より良いまたはより悪い設定があるかもしれません。無料のデモをダウンロードして、独自のテストを行ってください。
この EA は、マーチンゲールおよび/またはグリッド機能を使用しません。それでも、以下に示すテストは、「低リスク」とは見なされない取引あたり 5% のリスクで行われました。取引資金には責任を持って行動し、失う余裕のある資金のみを使用してください。テストと取引を楽しんでください:)

Astabot is an automatic Expert Advisor for Scalping. This Expert Advisor features a High Operating Frequency. Astabot is based on Bollinger Bands, RSI, Stoc. These trades can be managed with a few strategies. The Expert Advisor is able to get a very high rate of winning trades. 99.9% accuracy. recommendations The recommended time frame is M5 but you can use M1, M15. Expert is designed for XAUUSD. An Ecn broker is always recommended A low latency vps is always recommended. The recommended leverag

About The Product This is an MT5 expert advisor which will let the end user to copy trades from a source mt5 account to N different mt5/mt4 account in the same pc. It is specially useful when you want to copy your trades from an account to several client account or accounts which will have different parameter for those trades. This product provides options to copy trades with different options as well as copy them in reverse. You can try the free trial demo on the link below.
Complete User Gu

"Pattern 123" is an indicator-a trading system built on a popular pattern, pattern 123.
This is the moment when we expect a reversal on the older trend and enter the continuation of the small trend, its 3rd impulse.
The indicator displays signals and markings on an open chart. You can enable/disable graphical constructions in the settings.
The indicator has a built-in notification system (email, mobile terminal, standard terminal alert).
"Pattern 123" has a table that displays signals fr

One of the main Forex secrets is that the majority of these systems don't actually work. They have been developed by marketers, and are designed to sell, and not work. Once you have paid for the signals or automated software, you will not be able to get your money back ,and such tools would hardly bring you any profit. Forex trading may make you rich if you are a hedge fund with deep pockets or an unusually skilled currency trader. But for the average retail trader, rather than being an easy roa

Fractal MA is an indicator to hunt trends and scalp on h1 m30 m15 m5 and m1 works very well for synthetic indices and forex, in eur/usd, usd/jpy pairs, in synthetic indices in Range break 100, boom pairs 300, crash 300, boom 500 and crash 500, volatility 75, it is also programmed to hunt rebounds in m5, it has a profit percentage of 80% You can also trade in the 28 currency pairs
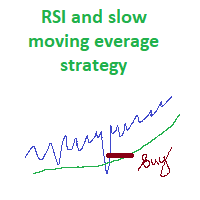
This EA uses 2 indicators: RSI and moving average. Positions opened towards the side of moving average. When price reaches the predefined high RSI value and goes down to the trigger point, then EA opens a sell position. Logic to opening a buy position is the same. Setting input parameters:
This EA uses 2 indicators: RSI and moving average. Positions opened towards the side of moving average. When price reaches the predefined high RSI value and goes down to the trigger point, then EA opens a

Multi trend is an indicator that marks the low and high to be able to do a good scalping, whether it is on the upside or on the downside, it is recommended to use it in h1, m30, m15, m5 and m1, it works very well for synthetic indices and forex in eur pairs /usd, usd/jpy, aud/cad, etc and in synthetics in the pairs Boom 300, crash 300, crash 500 and boom 500, volatility 75, jump 100, jump 75, volatility 10 etc!

Trade on Binance with MT5/MT4 EAs and indicators! GRat_BinanceImport is a tool for manual and automated trading , including ANY available EA, ANY cryptocurrency on the most popular crypto exchange Binance 24/7. Features 1. ALL Binance instruments are available. 2. Import(automatic copying) to the specified Binance currency all trades (made manually or by an EA) from an MT5 account (including demo) by the specified symbol and/or magic number. 3. Import(automatic copying) to the specifie

RSI Professional is based on an oscillator to hunt ranges and trends where you can also see it catches rebounds in the measurements according to the pair, it can be used for forex and synthetic indices, it works in any temporality, in the pairs that I use it are, eur/usd, usd/jpy, usd/chf and gbp/usd, in synthetics in the crash and boom pairs all, volatility 75, jumps, and range break!

The WRLD ZIGZAG, as it says in its name, is taking from candle to candle, it can be used in m1, m5, m15, m30 and h1 to scalp, it also has high and low to capture the next break that can be made, it can be used in synthetic indices as well as for forex too! It works in any type of pair for each market, where you can also add the Critical channel indicator to capture a beautiful profit trend
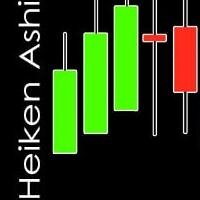
Heiken World is a heikin ashi candlestick strategy, to facilitate the view of the chart and capture trends for all types of pairs, it works perfectly in synthetic indices as well as forex! The strategy consists of taking out the common candles and placing only the Heiken World ones, plus adding some other channel like the Critical Channel since it facilitates where the market is going to bounce and to be able to facilitate the profit, it works for any type of temporality!

PSI tools delivers new special look aimed to bring Detailed Account Statement for all important statistics. The integrated MT4 is not accurate. It does not account correctly for Deposits, Withdrawals and completely ignores cases like hedged trades, break-even trades, other broker related credits, bonuses and so on events and as a result all statistics like draw-down, total trades, average win size, rate and so on are totally skewed. PSI corrects these mistakes. In the example below a demo acc
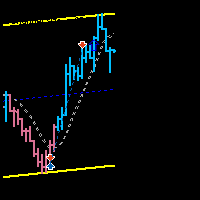
WLRD Trend is an indicator made to hunt trend candlestick trends or spikes in the synthetic index market, recommended to use in boom and crash, it works for any pair as well, but it is specialized in boom and crash as seen in the image, it has a High effectiveness range, it can be used in any temporality from m1 to d1, it also works for the 100/200 range break pair !!!

CCI Professional, has the simple fact of being able to do a scalping or intraday without using any other indicator to take some operation taking advantage of the rebounds in the lines of -200 for long and +200 for short, it is very easy to use and very practical for each market, it can be used for crash and boom since it works very well to hunt spikes, for volatiles and jumps, also for forex. It is used in any temporality.

ZigZag Gold, Complies with the strategy of grabbing rebounds in small time frames, as well as for day trading, it also has a programming to be able to hunt long profit trends, it is used for synthetic, forex and crypto indices, nothing needs to be modified, use it as programmed, in case of crash and boom it is used to catch spikes in the temporality of m1, m5 and m15

Score Gold. simple indicator that tries to show when the price is trending by looking at bullish and bearish days It is used for scalping as intra daily, it works for forex, synthetic indices and crypto synthetics - crash and boom in m1 works well to hunt spikes volatility and jumps Range break too Forex - all pairs Crypto - All pairs! measurements of the one indicated. 7 - 0 and -7 ay is verified where the trend starts!

Step Gold. It is an Echo oscillator for trading synthetic and forex indices at a professional level, grasping long trends, whether long or short works for all seasons also for scalping, very good level in the crash and boom pairs, volatility's , jump in forex pairs, eur/usd usd/jpy, gbp/eur, aud/cad and others! when it hits the ceiling it gives a signal to a short when it hits the floor it signals a long! Enjoy it.

VIP Gold It has the last indicator of the session Gold of the 4! It works in all temporalities. It is an indicator where it marks blocks of structures. the rebounds are on the red line up, and the green line down depending on which pair you use it, It is made for synthetic indices, crash and boom pairs It works as support and resistance also to better find the floor and ceiling of each pair.

ZigZag Emerald The Zig Zag Emerald indicator is based on 4-point patterns The uptrend monotonicity condition begins with appearance of bullish patterns for highs and lows Similar logic applies for the downtrend It is programmed for synthetic indices and forex! It is used in synthetics in volatile pairs and jumps. suitable for all timeframes, both for scalping and intraday.

The MP Andean Oscillator is used to estimate the direction and also the degree of variations of trends. It contains 3 components: Bull component, Bear component and Signal component. A rising Bull component indicates that the market is up-trending while a rising Bear component indicates the presence of down-trending market. Settings: Oscillator period: Specifies the importance of the trends degree of variations measured by the indicator. Signal line per: Moving average period of the Signal line
FREE
ALGOBox is a indicator-sandbox expert advisor which allows for easy implementation of a combination of custom indicators to emulate an ideal manual trading strategy using technical analysis. Trade with an indicator-based strategy in mind to find a profitable setting to run with, perfect for manual forex traders!
This EA is adapted to run with great risk management, using volume, trend-recognition and scaling out to run on a high timeframe setting, using no scalping strategies to jeopardize your

The Bheurekso Pattern Indicator for MT5 helps traders automatically identify candlestick pattern that formed on the chart base on some japanese candle pattern and other indicator to improve accurate. This indicator scans all candles, recognizes and then displays any candle patterns formed on the chart. The candle displayed can be Bullish or Bearish Engulfing, Bullish or Bearish Harami, and so on. There are some free version now but almost that is repaint and lack off alert function. With this ve

Kita Biikin acak saja karena ini adalah Ea untuk percobaan apakah bisa hasil compile SQuant di upload ke MQL5, dan hasilnya ternyata bisa . Find out how to add the product description . Product rating in the Market depends on the built-in editor . If your product has inputs, add them as a list of parameters with descript ou can freely edit data on all tabs. Don't forget to save your changes. Fill in all the information about your Product and send it for the moderator check using the "Ready"
FREE

Please note that the price of the EA will change after every three copies sold. Therefore, the next price will be $290 This is an Neural Network EA which is trained on NZDCAD symbol from 2010 until 2022-12-01 at M15. The EA not using dangerous method like martingale or grid. But you can enable the Martingale method on the EA's inputs.
Every month the trained data would be updated on my server automatically. So the EA need to be updated every month. You have to download every month the new ve
FREE

This is the demo version of SmartVSV Panel. https://www.mql5.com/en/market/product/91131 It is the same as original panel with all graphic objects and settings. Main difference is that you can not trade with this demo, but you can see all orders' parameters such as entry, TakeProfit and StopLoss. Also you can test QuickTrade. All functions are explained with alerts. When you add it to your chart press "I" to call information alert.
FREE

--- Please read before install the DEMO or Purchase! --- To all DEMO users: In order for me to pass the automatic validation tester, I have to modify the parameter. Therefore, if you would like to run the DEMO or backtest in your account for specific currency pair ( preferred EURUSD ) , kindly get the customize set file or the specific input parament from me. Parameter: InitialDeposit: ( Depend on your initial deposit )
yearlyTargetedProfit: 1.3 ( the best option ) [if for demo, kindly put

There are two stages in the market that we call them "Narrow stage" and "Wide stage". We can expect a big move (wide stage) when the price moves sideways within a low-price range followed with a low volatility. Knowing the exact trigger point is the key to success. The symbols that it trades best are in the inputs and it should be run on GBPNZD H1. For a trading reference please follow the signal for this EA: Copy trades of the MT5 iMasterTrader trading signal for MetaTrader 5 - Mihai Onofre
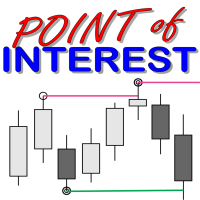
What is a Point of Interest? Traders who follow Smart Money Concepts may call this a Liquidity Point, or areas pools of liquidity have been built up by retail traders for for Big Banks to target to create large price movements in the market. As we all know, retail traders that use outdated and unreliable methods of trading like using trendlines, support and resistance, RSI, MACD, and many others to place trades and put their stop losses at keys points in the market. The "Big Banks" know these me
Xrey SP500 Trend
I would like to offer you the opportunity to create your own system portfolio.
The offer is aimed at all who want to have a diversified portfolio that outperforms the market with significantly lower fluctuation.
therefore I will gradually upload all Exper Advisor, which I use. It should be noted that I run them all together and do not rely on a single strategy. i have additionally checked the individual expert advisors for correlations via quant and calculated the corresp

Obar FX
I would like to offer you the opportunity to create your own system portfolio.
The offer is aimed at all who want to have a diversified portfolio that outperforms the market with significantly lower fluctuation.
therefore I will gradually upload all Exper Advisor, which I use. It should be noted that I run them all together and do not rely on a single strategy. i have additionally checked the individual expert advisors for correlations via quant and calculated the corresponding pos
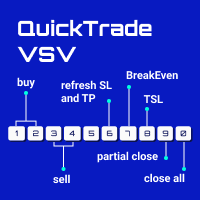
From 0 to 9... the only keyboard buttons you need to trade with this EA!
If I am wrong just write which button should I add in the comment section. I recommend you to test this tool on demo account first. This version of QuickTradeVSV can help you to: 1 - Open buy position with TakeProfit and StopLoss (Lotsize is calculated by your Account Balance and StopLoss). 2 - Open buy position with fixed LotSize. 3 - Open sell position with TakeProfit and StopLoss (Lotsize is calculated by your Account

Inspired investing.com Technical Indicators, this indicator provides a comprehensive view of the symbol by synthesizing indicators including: RSI, StochRSI : have 3 level oversold - red, midle (aqua when upper, pink when lower), overbuy – blue Stoch: oversold – red, overbuy- blue, aqua when main line < signal line, pink when main line > signal line MACD: aqua when main line < signal line, pink when main line > signal line ADX: aqua when line plus > line minus, pink when line plus < line minus
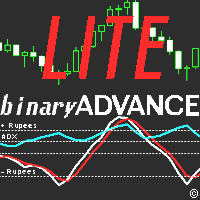
This is a Lite version of my Binary Wave Advance Oscillating indicator: https://www.mql5.com/en/market/product/90734 Free for a limited time! It reduces the less useful indicators, while keeping it's predictive modifications to make each indicator within better than their stock counter part. I reduced it and made it simpler, in the hopes it would be less overwhelming and more approachable. Contains: ADX Chaikin Money Flow Index Each have separate smoothing controls to tame faster periods, as we

This is similar in it's idea as the Binary Advance/Lite indicator, but this is intended to use as a levels indicator, as well as trend reversal and how ranging the market is. It takes several useful indicators and combines them in such a way as to declutter your charts, yet prove even more useful together, than separate. RSI, RVI, DeMarker, MACD are added together then multiplied by ATR and StdDev to reveal multiple factors: How far the price has changed, and as the price slows down and reverses

Daily Range Breakout EA is a breakout strategy with buys when close of current bar is lowest in past N bars and price of next bar is greater than close of previous bar. Condition for sell trades are the opposite. The idea is based on Larry Williams Smash Day strategy. I trade this strategy live and it works in multiple markets. It works best in Daily timeframe. Not Martingale/Grid Strategy. Real result with stop loss. You can reproduce the result for Gold using the default parameters. IMPORTANT!

Представляем вашему вниманию уникальный торговый советник, разработанный специально для торговли криптовалютой. Этот советник использует передовые технологии анализа рынка и сочетает в себе четыре уникальных индикатора для определения направления тренда, анализ поведения толпы, а также чтение стакана цен на бирже через API ключи. Советник прошел многократное обучение, чтобы изучить и применять лучшие стратегии торговли.
Основные Характеристики
Четыре Уникальных Индикатора Советник используе
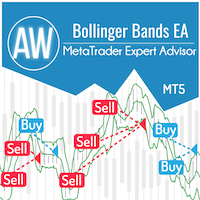
標準のボリンジャー バンド インジケーターのシグナルに基づいた完全自動化された取引ロボット。 EA には、自動ロット計算とインテリジェントなトレーリング システムのための機能が組み込まれています。市場が反対方向に動く場合、指値注文からの平均化システムが適用されます。 MT4 version -> HERE 利点:
全自動システム カスタマイズ可能な指標パラメータ 組み込みの自動ロット計算 直感的なセットアップ 倍率設定 トレーリングシステム内蔵 ストラテジー:
インジケーターの主なアイデアは、平均線からの急激な偏差を検出することであり、戻った瞬間に、インジケーターは平均値に戻るように信号を出します インジケーターは 3 本の線で表示されます。中央の線は移動平均線です。上下の線は、特定の数の偏差(たとえば、2)だけシフトされた中央の線であり、偏差の大きさはボラティリティによって調整されます。バンドの幅はボラティリティに基づいて調整され、幅は最も安定した期間に減少します。ボリンジャー バンドは、95% が存在するべき回廊を作成します。 価格と 5% だけがそれを超える

AI ハイゼンベルクは、ニューラル ネットワークと特定の設計モデルに基づく自己学習をベースにした万能取引ロボットで、市場を分析して最適な取引決定を下すことができます。 追加の RSI インジケーターを使用して、価格逆転のシグナルとなる可能性のある取引を除外します。 注意!!! - 購入後、ギフトを受け取るには個人的なメッセージを書いてください: VIPチャットへのアクセス 最適な設定 もう一人のアドバイザーをプレゼント AI ハイゼンベルクには次の機能と利点があります。
自己学習: ハイゼンベルグ AI は過去の取引データから継続的に学習し、そのアルゴリズムを市場状況の変化に適応させます。 トレンド、出来高、移動平均、確率論などのさまざまな要素を考慮できます。 利食い: AI ハイゼンベルグは、損失を出してもポジションを閉じることも、所定の収益性レベルに達すると利益を上げることもできます。 これにより、長期的な一方向の値動きの中でも安定した利益を得ることができます。 ストップロス: AI ハイゼンベルクは、一定の収益性レベルに達したときに勝つか利益を上げた場合、ポジションを閉じるこ

EA が何を提供するのかを最初から明確にするために、 製品のブログ (マニュアル) を最初から最後まで読むことをお勧めします。 このエキスパートアドバイザーは、価格とオシレーター/インジケーターの間に乖離が発生する時期を特定します。これは、通常/古典的な (トレンド反転) ダイバージェンスと隠れた (トレンド継続) ダイバージェンスの両方を識別します。需要/供給ゾーン、RSI、ボリンジャー、ストキャスティクス、移動平均 (通常の MA およびハル MA)、ADX、およびボリューム フィルター オプションがあり、最も強力なセットアップのみを除外することができます。デフォルト設定は EURUSD H1 に最適化されています (以下のスクリーンショットを参照してください)。 EA には、1 つのチャートから複数のシンボルを取引する可能性があります。このオプションは 4 つの異なる方法で使用できます。
[気配値表示] ウィンドウに表示されているすべてのシンボル 入力パラメータで指定される記号 ダイアログボックスで選択したプリセットファイルのシンボル 事前定義されたフォルダー内のプリセッ
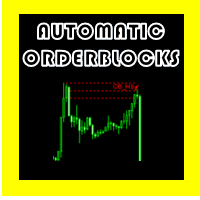
AUTOMATICS ORDERBLOCKS OSW
(メタトレーダー5)
このインジケーターは、いくつかの事前に確立されたルールの下で注文ブロックを表示する役割を果たします。
>以前の衝動を壊す衝動があること。
>それが見つかった場合、形成されたローソク足パターンを見つけ、最も効率的な方法で場所の高値と安値を計算し、オーダー ブロックの高値と安値を作成します。
>注文ブロックが作成された後、インジケーターは、ローソク足が注文ブロックの上下の線を横切るかどうかを常にチェックして、シグナルの可能性があることを示すアラートシグナルを生成します。
>インジケーターによって提供されるシグナルは、他の戦略のように 100% 効果的ではないため、手動のテクニカル分析を併用することをお勧めします。
> PC、モバイル、メールの 3 種類のアラートが生成されます。

このインジケーターは、チャート上のすべての注文 (トランザクション/注文ラインにクローズ) に対して既に設定した TP および SL 値 (その通貨で) を表示し、すべての注文の利益と損失を見積もるのに大いに役立ちます。また、PIP 値も表示されます。表示されている形式は、「利益または損失の通貨値 / PIP 値」です。 TP 値は緑色で表示され、SL 値は赤色で表示されます。 ご質問や詳細については、fxlife.asia@hotmail.com で販売者にお気軽にお問い合わせください。 (そして、近日中にインジケータに追加される次の機能は、「自動または半自動の TP および SL 設定」であり、お客様は無料で更新バージョンを入手できます。よろしくお願いします。) (または、表示に何か機能を追加すべきだと思われる場合は、お気軽にお申し付けください)

"Panel Partial Closure" ユーティリティ パネルは、利益のあるポジションをすばやく部分的に決済することを目的としています。パラメータは「 部分閉鎖 #1 」と「 部分閉鎖 #2 」の 2 つだけです。任意のシンボルと任意の「マジック ナンバー」で機能します。つまり、このユーティリティは主に手動取引を対象としています。 使い方: たとえば、「EURUSD」、「Jump 100 Index」、「XAUUSD」(金)に複数のポジションを持っているとします。ユーティリティは利益が最大のポジションを見つけます - スクリーンショットでは、これは "Jump 100 Index" シンボルの "Sell" ポジションで、出来高が 0.05 ロットで、利益は 2.59 です。 最初のボタンは 0.01 ロットを部分的にクローズし (この値は「 部分クローズ #1 」パラメーターから取得されます)、2 番目のボタンは部分的に 0.03 ロットをクローズします (この値は「 部分クローズ #2 」パラメーターから取得されます)。
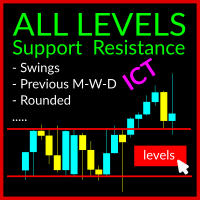
The Swing Levels Support and Resistance Indicator is a robust tool designed for MetaTrader 5 traders (also available for MT4). It aids in identifying crucial market levels where price direction may change by showcasing: Swing High and Swing Lows across all timeframes Previous Highs and Lows for Day, Week, and Month US Midnight level and Yesterday Midnight Level US Preopen 8:30 AM Level Rounded Levels This indicator features a toggle button, enabling you to display or hide these levels on the ch

The Magic SMMA indicator is of great help in determining trend direction. It can be an excellent addition to your existing strategy or the basis of a new one. We humans can make better decisions when we see better visually. So we designed it to show a different color for rising and falling trends. Everyone can customize this in the way that suits them best. By setting the Trend Period, we can optimize it for longer or shorter trends for our strategy. It is great for all time frames.
IF YOU NE

The Candle Countdown Timer for MetaTrader 4 (also available for MT5) is a vital indicator designed to help you manage your trading time effectively. It keeps you updated about market open and close times by displaying the remaining time before the current candle closes and a new one forms. This powerful tool enables you to make well-informed trading decisions. Key Features: Asia Range: Comes with an option to extend the range. Broker Time, New York, London Time: Displays the current broker time
FREE

The Magic SMA indicator is of great help in determining trend direction. It can be an excellent addition to your existing strategy or the basis of a new one. We humans can make better decisions when we see better visually. So we designed it to show a different color for rising and falling trends. Everyone can customize this in the way that suits them best. By setting the Trend Period, we can optimize it for longer or shorter trends for our strategy. It is great for all time frames.
IF YOU NEE

The Magic EMA indicator is of great help in determining trend direction. It can be an excellent addition to your existing strategy or the basis of a new one. We humans can make better decisions when we see better visually. So we designed it to show a different color for rising and falling trends. Everyone can customize this in the way that suits them best. By setting the Trend Period, we can optimize it for longer or shorter trends for our strategy. It is great for all time frames.
IF YOU NEE

The Magic LWMA indicator is of great help in determining trend direction. It can be an excellent addition to your existing strategy or the basis of a new one. We humans can make better decisions when we see better visually. So we designed it to show a different color for rising and falling trends. Everyone can customize this in the way that suits them best. By setting the Trend Period, we can optimize it for longer or shorter trends for our strategy. It is great for all time frames.
IF YOU NE

3 in 1 : Report + monitoring + sending messages (Telegram, ...) to optimize trading and use of advisors.
Monitoring:
Panel on the chart
Sending messages to Telegram Sending messages to Email
Sending Notifications
Sending pop-up messages
Sound notifications when the established Profit/Loss levels are exceeded
Monitoring is activated by pressing the Start button.
Profit for the period by currency pairs, hours and Magic number for the current account. Forms four tables: by symbols, by magi

Forex Trade Manager MT5 simplifies managing open orders in MetaTrader 5. If you open a new order, the manager automatically sets Stop Loss and Take Profit. When price will move, then the program could move Stop Loss to Break Even (stop loss = open price) or continuously moving Stop Loss (Trailing Stop) to protect your profits. Forex Trading Manager is able to control orders for only current symbols (where EA works) or for all opened orders (regardless symbol) and hide the Stop Loss and Take Prof
FREE

A trend expert with a trained neural network. It works according to the strategy of averaging trading positions. Parameters Minus - decrease a take profit when opening a new order
InpStepMinus - take profit level decrease step for an order grid in points
TakeProfit - profit in points for the main grid of orders
StopLoss - limitation of losses in points
Distance - the distance to ope

Key Price Levels Indicator Indicator that shows the highs and lows for the significant price levels for past periods that could be potentially considered as reaction levels. The indicator displays the following price levels: Yesterday high and low The day before yesterday high and low Two days back high and low Last week high and low Last month high and low Last three month high and low (Quarter) Last year high and low
FREE
MetaTraderマーケットは、開発者がトレーディングアプリを販売するシンプルで便利なサイトです。
プロダクトを投稿するのをお手伝いし、マーケットのためにプロダクト記載を準備する方法を説明します。マーケットのすべてのアプリは暗号化によって守られ、購入者のコンピュータでしか動作しません。違法なコピーは不可能です。
取引の機会を逃しています。
- 無料取引アプリ
- 8千を超えるシグナルをコピー
- 金融ニュースで金融マーケットを探索
新規登録
ログイン