YouTubeにあるマーケットチュートリアルビデオをご覧ください
ロボットや指標を購入する
仮想ホスティングで
EAを実行
EAを実行
ロボットや指標を購入前にテストする
マーケットで収入を得る
販売のためにプロダクトをプレゼンテーションする方法
MetaTrader 5のための新しいエキスパートアドバイザーとインディケータ - 43
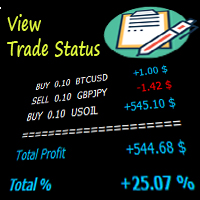
This indicator will help you have a better visualization of the status of your open trades. You can see profits or losses in USD or %, as well as a total of all trades and the percentage of profit or loss according to your account size. You can change the font size and color. I hope you find it useful and it makes monitoring your trades easier. This indicator adjusts to the size of your screen and will be positioned in the bottom right corner of your screen for better convenience.

BestPointOfInitiation是一个很好的短线交易指示器,能与 ShortBS ( https://www.mql5.com/zh/market/product/96796 )完美的配合,可以很好的指出最佳的buy和sell位置,指标不含有未来函数,不会重新绘制,不仅能够应用到自己的手动交易过程中,还能完全可以写入到自己的EA中。(如果你感觉到这个指标能够帮助你进行更准确的交易,请帮忙给个好评,希望我的作品能够帮助更多多有需要的人) ===================参数列表===================== fastPeriod: 9 slowPeriod:30 PassivationCoefficient:5 =================参考使用方法=================== 此指标可以适用于任何交易品种,能够用在任何周期。

This indicator shows both GMT time and your broker's time on the chart.
Simply attach the indicator to a chart, and you will see the GMT time and your broker's time displayed in the top left corner, as shown in the screenshot. By using this indicator, you can always stay informed about your broker's time, which is especially useful during daylight saving changes.
You won't have to worry about whether your broker follows the US or EU schedule, as the indicator automatically adjusts to reflect a
FREE

it depends on ATR period to get swing points to help make better trading decisions blue dot and red dot is the default color scheme of course you can change it later if you'd like you can change the following : ATR PERIOD sending notifications number of times to send notifications sending notifications to your smart phone that's it very simple to use just drag and drop and follow the trend

it depends on channels and moving average in sketching the chart in two colors the default colors are gold and light blue to highlight the area of downtrend and the area of uptrend TO ADJUST THE INDICATOR YOU CAN CHNGE THE FOLLOWING: 1- the look back period which affects the length of the moving average 2- the multiplier which affects the point of swing in the trend 3- the channel shift which affects how close the line is moving to the price the default settings are the best for the indicator B
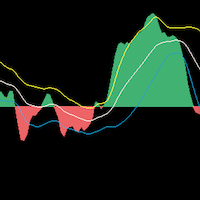
TradingDirection是一个针对中长线交易的趋势指标。在图上你能很清晰的看到什么时候是上涨趋势,什么时候是下跌趋势,同时在趋势中,你能看到很明显的补仓位置和减仓位置。同时它与 BestPointOfInitiation( https://www.mql5.com/zh/market/product/96671 )指标可以形成完美的配合,两个指标相互配合更能很好的把握开单时机。 ===================参数列表===================== fastPeriod: 9 slowPeriod:30 PassivationCoefficient:5 =================参考使用方法=================== 此指标可以适用于任何交易品种,能够用在任何周期。
This is a modern MACD indicator based on regular MACD indicator. It also has alert system included. This indicator gives you alerts when base line of MACD indicator crosses above or below Zero level so you can look for Buy or Sell opportunity. Available Alerts: 1. Audible Alerts on Chart / Trading Terminal window. 2. Alerts on your email. 3. Alerts on your mobile phone. Type of Alerts Explained: 1. Audible_Chart_Alerts - Audible alerts and Popup message on your computer’s tr

Bears Graph is a fully automatic, professional trading robot. Designed specifically for the foreign exchange market GBPUSD, time frame M30 . This EA does not need to configure parameters. Ready to work on GBPUSD M30 . You only need to decide on the choice of the lot. Default lot is 0.1 points. Trade smarter and safer with Bears graph! Our revolutionary trading EA has a smart algorithm which detect the trend, filter out market noise and make the most accurate decisions. Enjoy maximum capital

ShortBS是一个很好的短线交易指示器,能很好与 BestPointOfInitiation ( https://www.mql5.com/zh/market/product/96671 )配合,能让你找到最合适的buy和sell位置,指标不含有未来函数,不会重新绘制。是一个针对(如果你感觉到这个指标能够帮助你进行更准确的交易,请帮忙给个好评,希望我的作品能够帮助更多有需要的人) ===================参数列表===================== maPeriod: 25 slowPeriod:20 fastPeriod:10 stepPeriod:5 =================参考使用方法=================== 此指标可以适用于任何交易品种,能够用在任何周期。
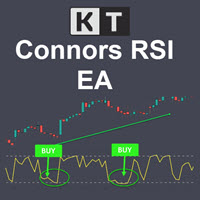
KT Connors RSI Robot trades market turning points by detecting price bar consolidation within overbought/oversold levels. This is done using the Connors RSI oscillator. A highly respected trader and analyst, Larry Connors, developed and tested it.
It's a highly effective tool for short-term trading on mean reverting trading instruments.
Recommendations Symbols: USDCAD and EURCAD Timeframe: 15 Minutes. Account Type: Any Leverage: 1:100 Download the SET files in the comments sectio
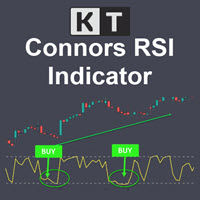
KT Connors RSI is a modified and more advanced version of the original Connors RSI developed by Larry Connors. It was designed to help traders generate trade signals based on short-term price movements.
The Connors combine the standard RSI calculation with two additional elements: a short-term RSI, ROC, and a moving average.
Features Provides more transparent and more actionable buy and sell signals using the overbought/oversold zones. Incorporates short-term RSI and moving average, provid

Signal : https://www.mql5.com/en/signals/1925481
Signal : https://www.mql5.com/en/signals/1925156 What Are Order Blocks Forex? Order blocks in trading refer to a situation where central banks or large financial institutions accumulate large quantities of a particular asset through one big order. They are supply or demand zones in which big players can find the comfort of placing large buy and sell orders and completing a big, very big transaction . But, banks and financial institutions cannot

Slopes are an increasingly key concept in Technical Analysis. The most basic type is to calculate them on the prices, but also on technical indicators such as moving averages and the RSI.
In technical analysis, you generally use the RSI to detect imminent reversal moves within a range. In the case of the Blue indicator, we are calculating the slope of the market price and then calculating the RSI of that slope in order to detect instances of reversal.
The Blue indicator is therefore used

If you are using naked eyes to find candlestick patterns on your chart it's a good thing but it requires your time and attention and still you miss some patterns here and there. Don't worry! This indicator will help you to find "Harami Candlestick Pattern" on your chart very easily. *Note: Default inputs are set for EURUSD H1 (1 hour) timeframe. This is an alert system which gives you alerts whenever harami candlestick pattern happens. Types of alerts it can give you are: 1. Audible Alerts - Thi

ABOUT LWANDLE V3 This EA is the scalping and price action EA which is very good on trading in binary.com best results where achieved on JUMP 10 AND VIX 75 (1S)
BEST TIMEFRAME M1 TIMEFRAME AND USE PERIOD M15 for candle momentum, it is very rare to reach 0.32 lot when martingaling. only one trade at the time while produce nice results. HOW TO SET UP THE EA Take Profit must be higher than the Stop Loss trailing stop must be equal with SL recommended broker trailing step must be almost equal with

You can use an expert advisor or a trading tool called a "forex robot" to carry out trades in your absence. These tools enable you to make trades while you're working, asleep, or doing other things. Like other artificial intelligence platforms, they have some benefits and issues that you should be aware of.
If you're prone to trade when your emotions get the better of you, an EA removes that factor from your trading. If you use an EA, your fears and drive for more profit won't affect your choi

Multi-currency and multitimeframe Heikin Ashi indicator. Shows the current state of the market. On the scanner panel you can see the direction, strength and number of bars of the current trend. The Consolidation/Reversal candles are also shown using color. You can specify any desired currencies and periods in the parameters. Also, the indicator can send notifications when the trend changes or when reversal and consolidation candles (dojis) appear. By clicking on a cell, this symbol and period wi

時間を節約し、より正確な意思決定を Sweet VWAP で このツールのパワーをテストしたい場合、 MetaTrader 5 用の無料のアンカード VWAP インディケーター をダウンロードできます。 このインディケーターは独立して動作するだけでなく、無料版 Sweet VWAP の拡張機能でもあります。 無料版をクリックすると、マウスポインターで見える VWAP が固定されます。そして、固定されるのはこのインディケーターであり、その機能をすべて備えています。 このインディケーターは Sweet VWAP と完全に統合されています。これは MetaTrader 5 用の無料のアンカード VWAP インディケーターです。 機能 アンカーする時間 これは VWAP をアンカーしたいローソク足です。これは Sweet VWAP(無料版)が自動的に行います。チャートでクリックするだけです。 取引量の種類 取引量の種類を選択するか、自動にしておくことができます。自動の場合、ブローカーがこの情報を提供している場合、取引アセットの実際の取引量を優先して使用します。 VWAP の平滑化メソッド 単純

ツインピークインジケーターMT5へようこそ --(ダブルトップ/ボトム)-- ダブルトップアンドボトムインジケーターは、市場の潜在的な反転パターンを特定するために設計されたテクニカル分析ツールです。
これは、価格がほぼ同じ高さの 2 つの連続した山または谷を形成し、その後、反対方向に価格が変動した領域を特定します。
このパターンは、市場が勢いを失いつつあり、トレンド反転の準備ができている可能性があることを示しています。 ※購入後、 説明書と手順ガイドをお送りしますのでご連絡ください。 特徴:
チャートの自動注釈: インディケータはチャート上のダブルトップとボトムのパターンを自動的にマークします。 使いやすさ: このインジケーターはユーザーフレンドリーで、MT5 プラットフォームのどのチャートにも簡単に適用できます。 カスタマイズ可能: インジケーターにはカスタマイズ可能な設定があります カスタマイズされたアラート 。 あらゆる楽器で動作します。 このインジケーターを他のテクニカル分析ツールと組み合わせて使用すると、トレンドの方向と反転パターンの潜在的な強さを確認

私たちの多くは、VPSを使用して24時間365日取引EAを実行していますが、これらの端末が稼働しているかどうかを監視するにはどうしたらよいでしょうか。
もし、クラッシュしたり、アップデートのためにシャットダウンしたらどうする?そのような場合、どのように通知されるのでしょうか?
そこで、ハートビート・モニタリングの出番です。
24時間365日、すべての端末とVPSを監視することができるのです。
では、そのために必要なものは何でしょうか?
1.プロフェッショナルな監視サービスである Cronitorの 無料ユーザー アカウント 。
2.VPS上のチャート上で動作する本ツール。 MT5や接続の問題が発生した場合、メールにて通知されます(より多くの通知方法があります)。
私たちはこの技術的ソリューションを、重要なバックエンドインフラの監視に使用しているので、信頼性と有用性は実証済みです。
私のパートナーのブログ:Daniel Steinで 完全なチュートリアルをお読み ください。
もしご希望であれば、 Nodepingサービス (有料)をご利用ください。

独自の専門家と最適化を作成することに関心がある必要があります。 セットファイルは付属しません。 遺伝子最適化テスターの力を利用して、自分の取引を強化します。
Alpha Generation は、Awesome Oscillator、Bulls Power、Commodity Channel Index、Envelopes、Moving Average Convergence Divergence、Moving Average、Parabolic SAR、Relative Strength Index、Stochastic Oscillator、Williams Percent Range などの一連のテクニカル インジケーターを使用して、取引シグナルを生成します。
EAには、口座残高のパーセンテージに基づいてポジションのサイズを決定する固定証拠金管理システムも含まれています。 コードには各入力パラメーターの詳細なコメントが含まれており、ユーザーはこれをカスタマイズして EA を特定の取引戦略に適応させることができます。 インジケーターのさまざまな組み合わせにより、無数のシグ
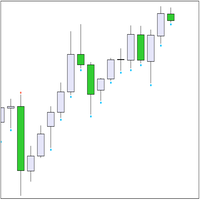
トレンド指標「トレンド2移動平均」は、「トレンドUP」と「トレンドDN」の2種類の矢印で計算結果を表示します。 アローズ「トレンドアップ」 描かれています に 価格 '低い' バー , あ アローズ「トレンドDN」 - に 価格 '高い'。 トレンド検索アルゴリズムは、バーの価格と 2 つの「移動平均」インジケーターの値の分析に基づいています。トレンドの方向は、現在の (ゼロ) バーで計算されます。したがって、完全に形成されたバーからのバー #1 からのシグナルを使用することをお勧めします。 トレーディングでのインジケーターの使用. トレンド インジケーターを使用すると、リスクの高い戦略 (シグナルが現在のバーから取得される場合) とリスクの低い戦略 (シグナルがバー #1 から取得される場合) の両方を使用できます。バー #1 からのシグナルに基づく戦略を以下に説明します 。 生成されたシグナルを待ちます( 現時点では 新しいバーの出現、バー #1) を見る必要があります 。 もしも
ICT Template Indicator visualizes and automatically updates all important ICT elements for Scalpers, Day and Swing traders. It allows you too keep your chart clean and bring any elements by just one click to the buttons. Thanks to mobile notifications on external liquidity levels, you will not miss any opportunity and you don't have to sit behind the screens whole day. Each element has fully customizable colours, width, line types, max timeframe to be shown etc... so you can really tweak your ch
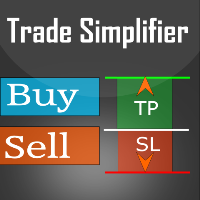
Trade simplifier is a trade panel that simplifies trade opening. It is simple and easy to understand, with key features to ease trading. Features include:
Order type selection Fixed lot entry from the chart user interface Easy Take profit entry field on the chart user interface Visual take profit selection and adjustment via the line that appears when you click the Take Profit button Easy Stop loss entry field in points on the chart user interface Visual Stop Loss selection and adjustment vi
FREE

It contains four major utilities: ZeroRisk Trade Pad to open and manage trades, ZeroRisk Manual Trader , a ssistant for manual traders to control the trading plan and prop firm rules, ZeroRisk Algo Trader , assistant for algo traders to control and monitor EAs and ZeroRisk Telegram Signal Provider to send manual or EA signal to telegram. This assistant supports news filter from top 3 trusted news website ( Investing.com, Daily FX , Forex Factory ) and auto GMT offset from Worl

Sometimes the market becomes volatile and we need algorithms that operate this volatility regardless of its direction. This system tries to take advantage in moments of high volatility.
It has 5 levels of input filters that it is recommended to adjust depending on the volatility, the average value would be mode 3, below the sensitivity decreases, above it increases.
You can download the demo and test it yourself.
Very stable growth curve as result of smart averaging techniques. "Safety
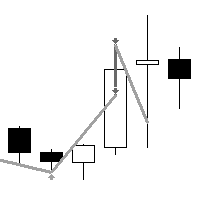
"AV BuyLow SellHigh EA" is an Expert Advisor for MetaTrader 5, which was created from the simple "AV Preview".
The original idea was to buy lower and sell higher from the last entry price. On request, I have developed it further and tried to remove its trend weakness. This EA is only the Minlot version to try out.
Strategy:
The size of a displayed rectangle is used to decide whether range trading is to be carried out (sell above, buy below) or trend trading (buy on rising, continue se
FREE

Are you looking for a cool expert where you can manage your orders easily and fast? I have good news because by using Rapid Trade Manager you can: calculate the risk per trade (percentage or fixed amount) manage your open orders individually choose from a variety of features such as: Take Profit, Partial Close, Stop Loss, Trailing Stop, Break Even, Close All and Close Order. Note! Doesn't work in the Strategy Tester If you are interested check out my videos for more. More info about the Rap

uGenesys AI - 90% Accurate Daytrading Indicator
Introducing the ultimate forex trading indicator system, uGenesys AI, powered by cutting-edge AI technology and advanced analytical techniques, including Time-Series Analysis and Genetic Algorithms. Our AI-powered trading system leverages the power of time-series analysis to identify trends and patterns in historical price data, allowing traders to make informed predictions about future market movements. By analyzing vast amounts of data, our sys

Introducing "Congestion Breakout MT5" - the indicator that helps you identify congestion zones in your chart and alerts you when the price breaks through them. Traders know that congestion zones can be key areas of price action and can indicate potential turning points in the market. However, spotting these zones and anticipating breakouts can be a difficult and time-consuming task. That's where "Congestion Breakout" comes in. This powerful indicator uses advanced algorithms to analyze the pri

Outside day trading strategy looks for a specific pattern in the price chart of a security.
The pattern is characterized by a larger range than the previous day, with the high of the day higher than the previous day's high and the low of the day lower than the previous day's low.
Works with many symbols, such as BTCUSD, GBPUSD,USDCAD, oil, gas, and others. PLEASE RATE! Thank you very much!
FEATURES:
- Real Strategy - Daily Bar Strategy - Exit the trade if the day was profitable - ATR multip
FREE

To get access to MT4 version please click here . This is the exact conversion from TradingView: "SwingArm ATR Trend Indicator" by " vsnfnd ". Also known as : "Blackflag FTS" by "Jose Azcarate" This is a light-load processing and non-repaint indicator. All input options are available except multi time frame. Buffers are available for processing in EAs. Extra option to show buy and sell signal alerts. You can message in private chat for further changes you need.

A heatmap is a graphical representation of data in two dimensions, using colors to display different factors. Heatmaps are a helpful visual aid for viewers, enabling the quick dissemination of statistical or data-driven information. The MP Heatmap indicator provides a graphical representation of the relative strengths of major currencies compared to others, organizing data from pairs into color-coded results and producing a clear overview of the entire Forex market. The MP Heatmap indicator dis
FREE

This Rocket Breakout Strategy for NASDAQ index is a trading strategy that focuses on breakouts from a range based on previous days, using a volatility filter to identify pre-breakout situations and a trend filter. This strategy employs a stop loss and profit target approach to manage risk, with higher profit targets for long entries and lower for short entries. The strategy also includes an end-of-week exit to avoid exposure to weekend news events. Percentage-based position sizing is used for

Indicator ICT Implied Fair Value Gap (IFVG) is an important part of the Smart Money Concepts (SMC) system. It looks for and shows on the chart a modern pattern - the Fair Value Gap ( FVG ). This pattern is a three candlestick imbalance formation based on the discovery of a mismatch between supply and demand. This happens when the price moves quickly in one direction without encountering resistance. The result is a "gap", which can be filled in later. The indicator finds this pattern using the up

Copy trades with ease using the MetaTrader5 trade copier - the quickest and easiest way to copy transactions between different MetaTrader 5 accounts! This innovative tool allows you to locally copy trades in any direction and quantity, giving you full control over your investments.
Attention!
You need to download the Trade Copier Slave mq5 file as well to run this EA. Download it from here https://www.mql5.com/en/market/product/96541
Designed to work on both Windows PC and Windows VPS, t
FREE
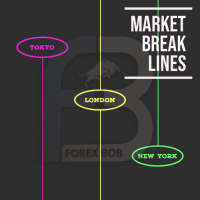
Market Break Lines is an utility tool to create a partition line at market openings/closings of Tokyo/London/NewYork sessions. This will help you to compare the market movements, volatility variations between the different markets.
Inputs: Inputs are simple to feed the time of Tokyo/London/NewYork sessions as per your broker server time Change Color and width of partition lines You can enable or disable any line (Hide/Show).
Please don't forget to support by giving handsome reviews/rating
FREE

The euro index (Euro Currency Index, EURX) is an average indicator of changes in the exchange rates of five currencies (US dollar, British pound, Japanese yen, Swiss franc and Swedish krona) against the euro. Displays a Eur X chart in a seperate window below the main chart. YOUR BROKER MUST HAVE THESE SYMBOLS FOR THE INDICATOR TO WORK Based on EUR/USD, EUR/JPY, EUR/GBP, EUR/CHF and EUR/SEK All these pairs must be added to Market Watch for the indicator to work correctly As this is calculated usi
FREE

Copy trades with ease using the MetaTrader5 trade copier - the quickest and easiest way to copy transactions between different MetaTrader 5 accounts! This innovative tool allows you to locally copy trades in any direction and quantity, giving you full control over your investments. Designed to work on both Windows PC and Windows VPS, this program is versatile and adaptable to your trading preferences. Whether you prefer to work from your desktop or a virtual private server, the MetaTrader5 trade
FREE

Displays symbol tabs for easy access when trading, symbols that are coloured are symbols you have trades running on.
The indicator immediately shows the specified currency pair in the open window after clicking it. You no longer need to open a new window to view each chart thanks to the indicator. Additionally, it enables traders to concentrate on their trading approach by just keeping a small number of charts displayed.
FREE

Indicator details The Moving Average Retracement Boundaries(M.A.R.B) shows the average retracement level above or below the given moving average.It shows the first upper boundary (which is the average retracement above the moving average ),the second upper boundary (which is double the first upper boundary),the first lower boundary (which is the average retracement below the moving average) and the second lower boundary (which is double the first lower boundary).
How to use it 1.It can be used
FREE
This EA using linear regression strategy, EA can identify key price points—entry price, stop-loss price, and exit prices. Price and time period determine the system parameters for linear regression, making the method universally applicable. Linear regression is the analysis of two separate variables to define a single relationship and is a useful measure for technical and quantitative analysis in financial markets. Requirements and Recommendations EA specifically for the USDJPY pair on the H4

This EA uses 3 custom indicators consisting of Gann HiLo, ADX, Heiken Ashi Indicator. Gann used angles and various geometric constructions to divide time and price into proportionate parts. Gann indicators are often used to predict areas of support and resistance, key tops and bottoms, and future price moves. Gann studies have been used by active traders for decades, and even though the futures and stock markets have changed considerably, they remain a popular method of analyzing an asset's dire

This is a simple arrow system based on MACD indicators Main/Base line and MACD Levels. It gives you alerts when MACD's Main Line crosses above/below certain level. Which type of alerts available? 1. It paints on chart Up/Down Arrows. 2. Popup message and sound alert in trading terminal window. 3. Push notification or Alert on your android and ios mobile phones (requires MT4 or MT5 app installed!)

An Opening Range Breakout (ORB) EA is an automated trading system that is designed to trade a financial instrument based on a specific strategy called an Opening Range Breakout. The strategy is commonly used by day traders in the financial markets, particularly in the stock market. The Opening Range Breakout strategy is based on the idea that the first few minutes of the trading day can be particularly volatile, and that a significant move in the price of a stock or other financial instrument ca

Simple supply and demand indicator which should help identify and visualize S&D zones. Settings:
Color for supply zones, color for demand zones - default colors are set for dark (black) background.
Number of how much zones should be created above and below current price - value "3" means there will be 3 zones above current price and 3 zones below current price. Principle:
When price creates "V", reversal zone is registered. Rectangle filled based on zone type (supply / demand) is drawn if pri
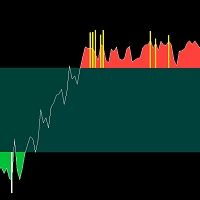
BS Trend Line是一款很好的买卖指示器,不含有未来函数,不会重绘,新版本已经加入了更好的过滤算法,开单成功率有了很大的提高,是一个很好的波段交易提示器,尤其是配合 SourcePoint 会有更明显的效果,它能帮你过滤掉接近70%以上的无效交易信号。 ===================参数列表===================== timeframe:M1
gip:30 sip:6 up line:80 down line:20 ===================使用方法===================== 配合 SourcePoint 使用时, SourcePoint 的参数 fastP: 96
slowP:208 avgP:72

This is a simple arrow system based on Engulfing Candlestick Pattern. It gives you alerts on your smartphone when there is an engulfing candlestick pattern happens. Which type of alerts available? 1. It paints on chart Up/Down Arrows. 2. Popup message and sound alert in trading terminal window. 3. Push notification or Alert on your Android and IOS mobile phones (requires MT4 or MT5 app installed!) *Note: Use it on higher timeframes like H4 (4 hours), D1 (1 Day) then find trade opportunities on s

Displays trends in current chart. You can display trends of multiple timeframes in one chart by inserting this indicator as often as you want. Key features: displays trend line by finding highs and lows counts number of high/low of current trend in different color (long/short) allows you to display multiple timeframe trends in one chart Settings: Indicator Name: if you want to show M5 and H1 on one chart add TITrend twice to your current chart and rename M5 to "TITrendM5" and H1 to "TITrendH1" C
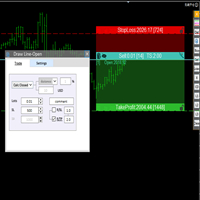
交易者的最佳伙伴! 基本使用设置 基本: 支持语言的选择切换(目前支持中文和英文) 自动识别语言 划线交易
支持英文中文自动选择,自动识别.
1.划线交易 ( 支持拖拉,支持多个订单线 ) 2.手数管理: 两种手数计算模式 ①资金的风险比例,例如设置风险百分比为1的时候,1万美金可交易1手. 计算手数 = 资金(净值或者余额或者剩余保证金) * RISK /10000 ②按亏损金额计算,本设置需要配合止损设置, 计算手数 = ( 当订单被初始下单设置的止损所止损的时候所亏损金额 计算得到的手数,小于最低手数会等于最小手数) ; 3.盈亏比等设置,
设置部分 1. 自动吸附最近高低点 2.高低点偏移 3.自动选择订单习惯 4.SL TP设置方式 5.语言设置

O "Ouro Trader" é um robô financeiro projetado para ajudar investidores e traders a tomar decisões de investimento mais consistentes e lucrativas no mercado de ouro. O robô utiliza algoritmos avançados de análise de dados para analisar as tendências do mercado de ouro em tempo real e fornecer informações sobre quando comprar, vender ou manter ativos de ouro. Com o "Ouro Trader", os investidores podem se beneficiar de anos de experiência e conhecimento de especialistas em investimentos, sem prec
FREE

The Turtle EA is a fully automated robot that uses a very efficient strategy and good money management. These are the suggested Settings: EA for trading long term, Best Results Starting from 2023 Lot Amount suggested use the Dynamic Position Size and Risk % per trade. Trade XAUUSD, USDCHF on 5m, settings for XAUUSD are the standards of the program, for USDCHF are the comments near the inputs The screenshots are based on a backtest using Real Tick data on a 1000$ account on a 3 months backtest d

My Grid expert advisor for MT5 is a safe and good-quality tool that uses advanced algorithms and technical indicators to automate Grid trading strategies. It offers flexible customization options and can handle both trending and ranging markets on the EURUSD and other pairs. With its take-profit levels, trailing stops, and lot size management, it ensures the safety and profitability of your trading account.
The EA is plug and play, set file is in the comment section. Account monitoring: htt

SqueezePlay is an EA that trades four indicator, it is optimised for trading DOGE coin, its secret is in the closing of the trades. The take profit and stop loss squeeze the trade untill a profit or loss is determined. With the SqueezePlay EA we squeeze out the profits to its maximum potential. So choose the SqueezePlay EA for your arsenal of EAs for your best chance at EA profits.

IMPORTANT: Blocks&Levels Alerts MT5 indicador.
Gives you the ability to easy draw Blocks and Levels (support and resistance) using key shortcuts and Alerts when price touch them. Please use it and give me feedback!! It really helps! Thank you very much! DESCRIPTION:
Blocks&Levels Indicator, has useful key shortcuts for draw Levels, Blocks Zones, change chart Time Frames, Select or Deselect all drew objects. SETUP: Just install the Indicator on the Chart
Open and navigate Indicator propert

This EA works best on EURUSD pair in M15 time frame . EA is equiped with very low drawdown to return ratio settings . For any additional quaries telegram contact is given .
telegram link : https://t.me/Ari_407 .
To properly test the EA in mt5 strategy tester select deposit balance 10000 and M15 timeframe and select EURUSD pair and run the backtest from 01/01/2022 to current date. Lot size may be configured depending upon user needs. Other settings are not to be changed .

Bot to attach to any different chart than the one using to get the orders and send them to telegram Inputs: Telegram Bot Token, Telegram Chat ID Sends Open Price, Order Type, Lots, Take Profit and Stop Loss instantly after the trade is executed. Easy to SetUp and to use My other Bot for XAUUSD and USDCHF: https://www.mql5.com/en/market/product/94001 Just remember to go to Tolls->Options->ExpertAdvisors->Allow Web Request for listed URL: https://api.telegram.org/
Xignal-Codingでは、トレーダーのマーケットでの成功を支援することに情熱を注いでいます。そのため、最新作のSimple CCIトレーディングロボット/ツールを共有できることをうれしく思っています。このロボットの主な目的は、CCIインジケータを理解し、自分の選択した取引資産でそれを有効利用するための安全で信頼できるツールでトレーダーに力を与えることです。 Simple CCIを使用することで、取引戦略を完全にコントロールできます。トレンドの継続戦略として使用するか、売り買いのオーバーソールドとオーバーボウトレベルを簡単に取引するためのミーンリバージョン戦略として使用することができます。単にCCIレベルと購入と売却の注文に対するクロッシング方向を選択してください。ロボットには、どの資産にも適応できるダイナミックでユニバーサルな方法でストップロスとテイクプロフィットレベルを設定するためのATRオプションも含まれています。 Xignal-Codingでは、良いトレーディングロボットはすべて安全でセキュアである必要があると考えています。そのため、Simple CCIを信頼できるツールに
FREE

VWAP バンド ビジュアル スタイル 1.0 金融市場指標は、トレーダーや投資家が金融市場で分析および意思決定を行うために使用する不可欠なツールです。 VWAP とボリンジャー バンドは、トレーダーが市場のトレンドと価格の変動性を測定するために使用する 2 つの人気のあるテクニカル分析ツールです。この製品では、2 つの指標を組み合わせて、市場の動向とボラティリティを包括的に分析する独自の製品を作成することを提案します。この製品は、データ主導の分析に基づいて情報に基づいた意思決定を行いたいトレーダーや投資家にとって理想的です。
発散戦略は、トレーダーが市場の潜在的なトレンド反転を特定するために使用する一般的なテクニカル分析手法です。この戦略は、価格の動きとテクニカル指標の間の相違を特定することに依存しています。このセクションでは、ビジュアル スタイルとボリンジャー バンドを使用した発散戦略について説明します。
たとえば、ビジュアル スタイルとボリンジャー バンドを使用した発散戦略は、トレーダーが市場での潜在的なトレンド反転を特定するために使用する一般的なテクニカル分析手法です

Williams Wizard は、市場向けに設計された自動取引システムであり、健全な取引原則に基づいて構築されています。そこにある他の多くのシステムとは異なり、グリッドシステムやマーチンゲール戦略に依存していません。これは、しばしば危険で予測不可能な取引につながる可能性があります.代わりに、この取引システムは、市場の勢いを測定し、潜在的な売買の機会を特定するのに役立つ、信頼性が高く効果的なテクニカル指標を使用します。 USDJPY 4 時間でこのエキスパート アドバイザーを使用することをお勧めしますが、もちろん、他の勢いのある取引ツールでも使用できます。表示されているバックテストは、2019 年から 2023 年までの USDJPY 4 時間で行われます。デフォルト設定から変更された唯一の入力パラメーターは、固定ロット サイズを使用する代わりに、取引ごとに固定口座残高の割合 (1%) を危険にさらすことでした。
FREE
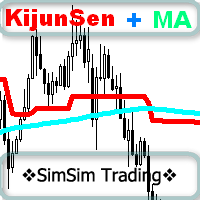
非常にシンプルですが効果的な指標です。
これは、一目インジケーターの KijunSen ラインと、このラインの構築平均 MA に基づいています。 売買シグナル: これは 2 本の線の交点です!!!
私自身、取引には一目指標の基準線をよく使用します。価格が高ければ購入のみを検討し、販売のみが低ければ購入を検討します。
そして、基準線を平均して基準線MAラインを形成した後、2つのラインの交点が現れました。これは、取引のシグナルの増幅として解釈できます。
インジケーターの MT4 バージョンへのリンク:
https://www.mql5.com/ru/market/product/96120
指標パラメータ:
基準線 - 基準線の計算期間。
KijunSen_MA - KijunSen MA の計算期間。
MethodMA - KijunSen MA の価格を計算する方法。
サウンド - 基準線と基準線MAの交差点警報音。
PushMobil - 携帯電話への通知。
エキスパートアドバイザーと通信するための指標バッファ。
バッファ番号で。

このツールは、ポジションにストップを配置します
Metatrade Strategy Tester ですばやくテストします。 ロング ポジションの場合、ストップは最後の底になります。 または、ショート ポジションの場合、ストップは最後のトップになります。
さらに、このツールはオープン ポジションのトレーリングを管理します。 常に最後に形成された高値または最後に形成された底にストップを置きます
上値と下値を作成するには、このリンクからダウンロードできる無料のインジケーター「サポートとレジスタンス ライン」を使用します: メタトレード 5 の無料の上下インジケーターをダウンロード
このツールは、挿入された資産のすべてのオープン ポジションのストップを移動します。

Real Spinning Top Indicator
It detects accurate spinning top on chart with balanced body and wick height ratio which is the true meaning of spinning top which differs it from Hammers and Doji or Null Candlestick.
This indicator plots an wingdings icon at number of spinning tops found on the chart.
Settings include
Number of Bars : To adjust search on number of bars
Color of Icon :change color of icon
Icon code : change code of wingdings for icon
FREE
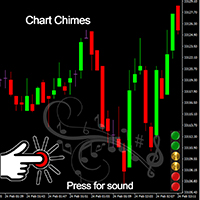
Chart Chimes のご紹介 - 取引を音の交響曲にする MT4/MT5 インジケーター! 一日中チャートを見つめるのにうんざりしていませんか? 取引中に気分を高揚させるために、ちょっとした気晴らしが必要ですか? まあ、Chart Chimes があなたをカバーしてくれます!
チャート チャイムを使用すると、そのボタンを押すたびに楽しい音が聞こえ、あなたの顔が笑顔になり、足元がスキップされます。 勝利を収めたトランペットや穏やかなハープの音を背景に取引をすることを想像してみてください - それはあなた自身の個人的なオーケストラがあなたを応援しているようなものです!
しかし、Chart Chimes は楽しい気晴らしだけではありません。取引中に集中して関与し続けるのに役立つ強力なツールです。 サウンドをカスタマイズする機能により、取引スタイルや好みに合った独自のサウンド環境を作成できます。 あなたのストップロスに固執するためのちょっとしたリマインダーが必要ですか? 審判の笛を模した音を設定してみませんか。 または、花火の音で取引の成功を祝いたいと思うかもしれません - 可
FREE

** All Symbols x All Timeframes scan just by pressing scanner button ** *** Contact me after the purchase to send you instructions and add you in "Channel Scanner group" for sharing or seeing experiences with other users. Introduction: The Channel pattern is described as the area located between two trend lines. This area is used for a measure of a trading range. In this case, the upper trend line connects price highs while the lower trend line connects price lows. Also when it comes to

CZSC フラクタル型インデックス
特徴:
包含関係の徹底処理を実施
上下分類かどうかの判断にはEAコールを利用すると便利で、「株の教え93 2つのテーブルとトレンド構造の内部の関係2」でステータスを判断すると便利です。
上下の分類を矢印で表示
可能なペンをさまざまな色で表示する
隣接する 2 つの K ラインの包含関係は次のように定義されます。K ラインの最高点と最低点はすべて隣接する K ラインの範囲内にあり、この K ラインと隣接する K ラインは包含関係です。
K-lineチャートでは、関係のあるK-lineをよく見かけますが、包含関係にある2本のK-lineを1本のK-lineにまとめる、いわゆる包含処理です。
定義: 3 つの連続した K ラインを含めて処理したもので、中央の K ラインの高点が最も高い場合、この組み合わせはトップ タイプと呼ばれます。
定義: 包含処理後の 3 つの連続した K ラインで、中央の K ラインの最低点が最も低い場合、この組み合わせはボトム タイプと呼ばれます。
EA によって呼び出されるインジケーター

この指標は、1 日のうちで最大の取引活動の時間を決定するように設計されています。 この計算の後、インジケーターは最も重要な取引レベルを構築します。 これらのレベルを実際の値動きと比較することで、市場トレンドの強さと方向性に関する情報を得ることができます。
指標の特徴 時間枠は D1 未満である必要があります。 推奨される時間枠: M15、M30、および H1。 H1 を超える時間枠は、非常に大まかな状況を示す可能性があります。 また、M15 未満の時間枠を使用すると、取引が短期間で急増する可能性があります。 指標は過去のデータに敏感です。 したがって、チャート ウィンドウに少なくとも 50,000 バーを設定することをお勧めします。
指標パラメータ 基準 - 取引活動を計算するための基準期間を設定します。 day - 取引活動は、時刻を考慮して計算されます。 week – 取引活動は、時刻と曜日を考慮して計算されます。
Width - 線幅。 ClrMean、ClrUp、および ClrDn は、中間、上位、および下位の取引レベルの色です。 Style1 - Style5

序章
Deriv AlgoTraders EA (ボット) は、一貫した利益を上げながら取引資本を維持することを目標に、長年の経験を持つ熟練した市場の専門家によって設計および開発されました。 これは、実世界またはシミュレートされた市場から派生した幅広い資産を提供する証券会社である Deriv Limited が提供する MT5 プラットフォームで動作します。 このタイプの市場の利点のいくつかは、年中無休で利用できることと、経済ニュースや活動からの影響が限られていることです。
将来のユーザーのための詳細
Deriv AlgoTraders EA (ボット) は、BOOM & CRASH 1000/500/300 合成インデックスのみで取引します。
一度に取引できるインデックスは 1 つだけで、一度に最大 2 つの取引 (売買) が可能です。
EA は、配置した TF に関係なく、1 M のタイムフレームで取引されます。
ドローダウンを制限するための回復のためのインテリジェントなヘッジ戦略を使用して、安全なゾーンでスパイクを辛抱強くキャッチしようとします。

"Terminator Trades " EA robot, built on the powerful MQ5 code, is designed to simplify the process of closing your positions and pending orders. You can adjust if you want close all the trades or by specific symbols. With just a single click on a button, you can efficiently manage your current positions, ensuring that you never miss an opportunity to terminate a trade. Close Trades , Delete Pending Orders with Terminator Trades.
FREE

Make grid trading safe again | Built by a grid trader >> for grid traders. Walkthrough Video <== Get Grid Rescue up and running in 5 minutes This is MT5 version, click here for BlueSwift GridRescue MT4 (settings and logics are same in both versions) BlueSwift Grid Rescue MT5 is a risk management utility MT5 EA (used together with other grid trading experts) that can help you trade aggressive grid / averaging / martingale systems with manageable drawdown, therefore
MetaTraderマーケットが取引戦略とテクニカル指標を販売するための最適な場所である理由をご存じですか?宣伝もソフトウェア保護も必要なく、支払いのトラブルもないことです。これらはすべて、MetaTraderマーケットで提供されます。
取引の機会を逃しています。
- 無料取引アプリ
- 8千を超えるシグナルをコピー
- 金融ニュースで金融マーケットを探索
新規登録
ログイン