YouTubeにあるマーケットチュートリアルビデオをご覧ください
ロボットや指標を購入する
仮想ホスティングで
EAを実行
EAを実行
ロボットや指標を購入前にテストする
マーケットで収入を得る
販売のためにプロダクトをプレゼンテーションする方法
MetaTrader 5のための新しいエキスパートアドバイザーとインディケータ - 18

Equity X è una utility che chiude tutte le posizioni ed eventuali ordini pendenti ad un importo prestabilito, è possibile fissare il bilancio del tuo conto quando il netto e uguale o superiore oppure uguale inferiore all'importo desiderato Ha integrato un sistema per la notifica mobile instantanea che genera il messaggio ad operazione avvenuta Uno strumento che permette di ottimizzare al massimo il rendimento del tuo investimento, è possibile utilizzarlo anche come gestore virtuale di take prof

The Bullish Harami candlestick pattern is formed by two candles. Here’s how to identify the Bullish Harami candlestick pattern: The first candle must be bearish and have a big body The second candle must be small and bullish The second candle is inside the body of the first candle This 2-candle bullish candlestick pattern is a reversal pattern, meaning that it’s used to find bottoms. For this reason, we want to see this pattern after a move to the downside, showing that bulls are starting to

The Tweezer Bottom candlestick pattern is formed by two candles. Here’s how to identify the Tweezer Bottom candlestick pattern: The first candle is bearish The second candle is bullish The lows from both candles should be pretty much at the same level This 2-candle bullish candlestick pattern is a reversal pattern, meaning that it’s used to find bottoms. For this reason, we want to see this pattern after a move to the downside, showing that bulls are starting to take control. When a Tweezer Bott

The Three Outside Up candlestick pattern is formed by three candles. Here’s how to identify the Three Outside Up candlestick pattern: The first candle is bearish and small The second candle is bullish and engulfs the first one completely The third candle is bullish and closes above the other ones This 3-candle bullish candlestick pattern is a reversal pattern, meaning that it’s used to find bottoms. For this reason, we want to see this pattern after a move to the downside, showing that bulls are
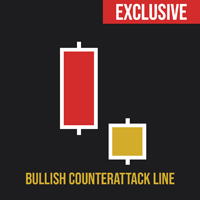
The Bullish Counterattack Line candlestick pattern is formed by two candles. Here’s how to identify the Bullish Counterattack candlestick pattern: The first candle is bearish and big The second candle is bullish and small There’s a gap between the close of the first candle and the open of the second candle They both close at the same level This 2-candle bullish candlestick pattern is a reversal pattern, meaning that it’s used to find bottoms. For this reason, we want to see this pattern after a

The Dragonfly Doji candlestick pattern is formed by one single candle. Here’s how to identify the Dragonfly Doji candlestick pattern: The candle has no body The wick at the bottom must be big At the top, it should have no wick, or be very small This 1-candle bullish candlestick pattern is a reversal pattern, meaning that it’s used to find bottoms. For this reason, we want to see this pattern after a move to the downside, showing that bulls are starting to take control. When a Dragonfly Doji cand
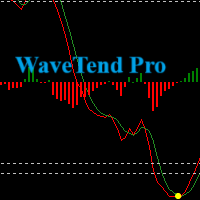
Introducing our Wave Trend Oscillator Indicator , exclusively designed for MetaTrader 5 . This advanced tool is a must-have for traders who seek precision and efficiency in their trading journey. Our oscillator is built on the principles of wave trend analysis , capturing the ebb and flow of market trends with unparalleled accuracy. It helps traders identify potential buying and selling points based on market wave patterns, enabling you to stay ahead of the market. One of the key features of ou
Subscribe to the 'MA7 Trading' channel to receive notifications about new programs, updates and other information. Ask questions in the profile on the MQL5 .
Description of work
The 'MA7 Agave' indicator is based on the standard Average Directional Movement Index (ADX) indicator. Shows the intersection of the +DI and -DI lines. Detailed information about the 'MA7 Agave' indicator.
Indicator settings
General settings: ADX period - Average Directional Movement Index indicator period.
'MA7

Our goal is to empower every trader with their own unique trading system.
Indicator - Red-Green Series
Ultimate simplicity: Red for uptrend, green for downtrend! It can be used independently or in combination with other indicators. This is a red-green indicator based on the crossover of two moving averages. We have more indicators in store and will be adding them gradually. Friends who make a purchase are kindly requested to contact us after their purchase.
In the world of financial tradi

MT5TradePanel_V1 The panel supports market and pending orders Closing of positions by order type -trade -statistics - risk management - Trailing Stop -select the variant of risk calculation FIXED_LOTS, // fixed lots RISK_MONEY, // lots based on money RISK_RATIO // risk percent of account - percent of loss warning -percent od loss close all -show symbol info
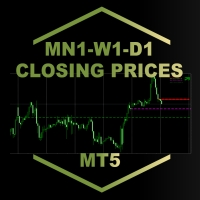
MN1-W1-D1 Close Price Indicator to Index Trading for MT5
The indicator draws lines to the close prices of the last closed bars of monthly, weekly and daily timeframes. Observably, these prices are significant support and resistance prices at major indices, like Nasdaq, DAX. The info panel always shows the prices relative to each other in the correct order. If the current price is the highest - i.e. higher than the last monthly, weekly and daily closing price - it is in the first row. The lowest

This indicator show Gann Swing Chart (One Bar) with multi layer wave. 1. Wave layer F1: Gann waves are drawn based on candles. SGann wave(Swing of Gann) is drawn based on Gann wave of wave layer F1. 2. Wave layer F2: Is a Gann wave drawn based on the SGann wave of wave layer F1. SGann waves are drawn based on Gann waves of wave layer F2. 3. Wave layer F3: Is a Gann wave drawn based on the SGann wave of wave layer F2. SGann waves are drawn based on Gann waves of wave layer F3. ---------Vi
FREE

Introducing the Accelerator Divergence Indicator, a powerful tool designed to enhance your Forex trading experience. This innovative indicator is specifically crafted to identify market divergence, providing traders with valuable insights for more informed decision-making. The Accelerator Divergence Indicator utilizes advanced algorithms to detect divergence in the market, visually guiding traders with precision-drawn lines that highlight key points of interest. Divergence occurs when the price
FREE

Baby WPR opera automáticamente en base al algoritmo oscilador WPR. Es capaz de llegar a generar resultados alcistas en las pruebas realizadas con el par de FX GBPUSD en el marco temporal H1 Se puede testear en otros instrumentos ajustando sus diversas opciones. Diseñado para operar con un capital mínimo de 100 USD y un apalancamiento de 1:30 Ideal para los iniciados. Con Baby WPR no esperes grandes beneficios con la configuración conservadora por defecto, por el contrario habrán DD significativo
FREE

Introducing the Engulfing Goddess Metatrader 5 (MT5) Indicator , a revolutionary tool designed for traders who seek to harness the power of candlestick patterns in their trading strategy. This indicator is built on the principles of engulfing candlestick patterns , a popular method used by successful traders worldwide. Our Engulfing Goddess Indicator stands out with its ability to detect various kinds of engulfing patterns . It employs a range of filters, providing you with a comprehensive anal

Exclusive FOREX account HEDGE FuzzyLogicTrendEA is based on fuzzy logic strategy based on analysis 5 indicators and filters.
When the EA analysis all this indicators, it decides, based on its fuzzy strategy, which trade will be better: sell or buy.
As additional functions, it´s possible defines spread maximum, stop loss and others.
Recomm. Symbol: EURUSD, AUDUSD, GBPUSD, NZDUSD, USDCAD, AUDCAD, EURCAD e USDJPY
Recomm. timeframe: H1.
Backtest were done on EURUSD, H1, 01/07/2023 - 26/0

This indicator helps you identify support and resistance levels. Also it adds break points when level is broken. Price sometimes goes back to break point. It has 4 technical parameters and 4 buffers for expert advisors. Buffer indexes: 0 - Resistance, 1 - Support, 2 - Resistance break point, 3 - Support break point". Number of Levels: Determines how many levels are on graph ( if 3 - 3 levels of support and 3 levels of resistance) Tolerance in percentage %: This parameter is used to filter out

Introducing UJ Master EA, a simple yet powerful Expert Advisor for trading the USDJPY pair! Developed, tested and traded by a team of experienced traders with trading experience of over two decades. Prop-Firms Ready Easy To Set up Not sensitive to broker conditions UJ Master EA is updated every 3 months to get the best results!
UJ Master EA utilizes a complex price action strategy and smart money concepts, following strict mechanical rules. For the best possible results, follow these st

Introducing The Day Trader System: Your Shortcut to Day Trading Success! Are you a day trader seeking simplicity without compromising profitability? Look no further! We present The Day Trader System – your go-to solution for identifying lucrative opportunities in the fast-paced world of Forex. Simple Yet Powerful: The Day Trader System is a straightforward yet highly effective indicator designed exclusively for day traders. Say goodbye to complexity and hello to a system that simplifies
FREE

Что показывает на графике индикатор TrendBreak? 1 — рисует линию тренда до максимальных максимумов в 100 баров. 2 — рисует линию тренда до максимальных максимумов в 30 баров. 3 — рисует линию тренда до максимальных минимумов в 100 баров. 4 — рисует линию тренда до максимальных минимумов в 30 баров. И эти линии указывают на сжатие тренда. Также индикатор выбирает 100-й бар и рисует ровную линию к максимуму и минимуму.
FREE

ACCOUNT FLIPPER EA A trading bot for GBPUSD Lot size is calculated by multiplying the lot factor by each 1000 USD on account. Advisable to use account sizes of USD 1000 and above. Account types: Hedge accounts, Standard accounts are preferred i.e. no commissions, Use well regulated brokers eg ICMarkets. all this provides room for the strategy to work smoothly for stabilized results and removing the possibility of the model crashing. ADJUST The Time settings to your own time zone because the
FREE

O Chart Control é um indicador que permite de forma rapida e pratica alterar o timeframe e ativo do grafico, possibilitando que voce possa fazer todas as suas analises em apenas um grafico sem precisar abrir vários, além disso voce pode escolher o entre os temas claro e escuro para o qual melhor se adapta a sua preferencia.
MT4: https://www.mql5.com/pt/market/product/112155
FREE

The underlying strategy of this indicator is based on identifying momentum in the market and attempting to capture the direction of the trend through transitions between bullish and bearish moments. Utilizing bands around the RWMA allows for identifying potential overbought and oversold situations in the market.
1. Calculation of the Range Momentum Index (RMI): The RMI is based on a combination of the Relative Strength Index (RSI) and the Money Flow Index (MFI), both of which are momentum ind
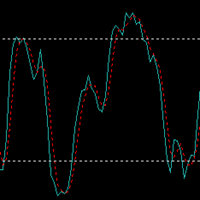
Simple EA with two indicators (SMA + STOCHASTIC) and Grid. The Expertadvisor opens positions in the direction of the trend when the lines of the Stochastic indicator intersect in the swing high or swing low area. It then uses a simple grid strategy if the position turns into a loss. Grid levels can be defined specific to the market.
It depends on your personal preferences and the respective market which parameters should be set and how. You have to test it yourself. The EA is programmed in suc

Introducing the True Currency Strength Indicator - Your Ultimate Guide to Market Mastery! Are you tired of guesswork when it comes to trading? Ready to elevate your trading strategy to a whole new level? Look no further! We present to you the True Currency Strength Indicator - the game-changer in the world of Forex trading. Unleash the Power of Multi-Currency Analysis: Gain a competitive edge with our revolutionary indicator that goes beyond traditional single-currency analysis. The Tru
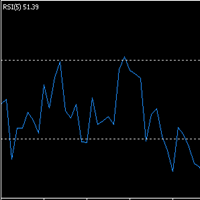
Simple EA with two indicators (SMA + RSI) and Grid. The Expertadvisor opens positions in the direction of the trend when the RSI line turns above 80 or below 20. It then uses a simple grid strategy if the position turns into a loss. Grid levels can be defined specific to the market.
It depends on your personal preferences and the respective market which parameters should be set and how. You have to test it yourself. The EA is programmed in such a way that optimization runs consume little time.
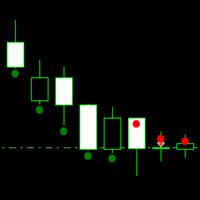
Simple EA with an self-made indicator and Grid. The Expertadvisor opens positions when the market behavior changed from bullish to bearish or vice versa. To determine the market behavior the indicator simply measures how many points it has moved up and down for the last X candles.
It then uses a simple grid strategy if the position turns into a loss. Grid levels can be defined specific to the market.
It depends on your personal preferences and the respective market which parameters should be

A very simple position sizing calculator to help traders calculate the right lot size per trade. It also places the order with one click. All inputs can be edited. So if you want to change the SL or TP or the lot size, you can do so before placing an order. The inputs are the following: SL - stop loss in pips (not points). set to 0 before placing an order to not add SL. TP - take profit in pips (not points). set to 0 before placing an order to not add TP. RISK - dollar amount to risk. i

Recommended currency pairs: USDJPY, CADJPY, EURJPY. and other. Recommended optimization: It is recommended to do balance max optimization or complex criterion max optimization . Min 1/ 2 year in M15/M30/H1. Other recommendations: const_lot_or_not - true - lot is constant, false lot is variable, Trailing_stop - true recommended, stop_loss_on_off - true recommended, take_profit_on_off - false recommended, max of open positions - 1 - 5, max_Analyzed_Bars - from 1 to 50 every

Now, you have your own AUTO-CLOSE program ! Once your account target or drawdown hits, all open orders will be closed automatically. ========================================== INPUTS: Account target: Put the exact account target. Once the equity hits it or went above that, all orders closed. Please add buffer to consider slippage. Use fixed value or dynamic value: Choose whether you will need a fixed value or dynamic value for drawdown. DYNAMIC SETTINGS: Equity-based or Balance-based drawdo

TRADE BOT X A trading bot for XAUUSD,GBPUSD,US-30 index. Risk levels can be adjusted using the coefficients, but also adjust the maximum drawdown as you increase the coefficients Advisable to use account sizes of USD 500 and above. Account types: Hedging accounts, Standard accounts are preferred i.e. no commissions, Use well regulated brokers eg ICMarkets. all this provides room for the strategy to work smoothly for stabilized results and removing the possibility of the model crashing. ADJUST
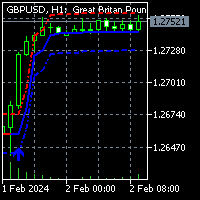
To get access to MT4 version please click here . This is the exact conversion from TradingView: "HalfTrend" by "Everget". This is a light-load processing indicator. This is a non-repaint indicator. Buffers are available for processing in EAs. All input fields are available. You can message in private chat for further changes you need. Thanks for downloading

The TradeQL Indicator is a customizable tool that highlights specific trading patterns on candlestick charts. Users can define patterns through TradeQL queries, which the indicator then applies to the chart, visually representing matches and captured groups. Ideal for identifying complex trade setups in real-time.
TradeQL queries are specified using the TradeQL Language. See https://github.com/abdielou/tradeql for more details. This language is expressed as a regular expression. The language a
FREE

Data Extractor (DE) is designed to extract symbol price movement data and save it to file. It's a simple tool, designed to be used in combination with other software.
SETTINGS (INPUTS) Period_in_days - How many days of data for Data Extractor to process (including non-work days). File extension - Defines the type of file in which data will be saved. CSV is readable for a human, HST and BIN are binary data intended for machine reading. File name (without extension) - User defined part of file
FREE

Delving deep into the sphere of finance and trading strategies, I decided to conduct a series of experiments, exploring approaches based on reinforcement learning as well as those operating without it. Applying these methods, I managed to formulate a nuanced conclusion, pivotal for understanding the significance of unique strategies in contemporary trading.
FREE

Uncover high-probability opportunities in trending markets with the Brilliant Entries Indicator. Its clear visual signals can be followed and incorporated with market structure to provide you with accurate entries. Give it a try and gain an edge in your trading strategy.
It can be used on it's own but i highly recommend to used it as part of a wider strategy to provide you with confluence.
It works on all timeframes but will work very good doing market structure 2 x timeframes higher and t
Prop Drawdown Manager is a sophisticated utility tool designed to assist traders in effectively managing and minimizing the impact of drawdowns within their forex trading accounts. Drawdowns, which represent the reduction in capital from peak to trough, are an inevitable aspect of trading, but they can be detrimental if not managed properly. This utility provides traders with a suite of features aimed at controlling drawdowns and preserving trading capital: 1. Drawdown Thresholds : Traders can

Introducing Time Trading EA
Your reliable and customizable trading assistant! This Expert Advisor (EA) is designed to open an order every day at a specific time, allowing you to test any trading idea with ease and efficiency. With Time Trading EA, you have full control over your order parameters, including the order direction (buy or sell), lot size, stop loss (SL), and take profit (TP). All these parameters are pre-set but fully adjustable to suit your trading strategy. Try Time Trading EA

The "Takeandstop" script is a powerful tool designed to streamline your trading workflow by automatically setting Take Profit (TP) and Stop Loss (SL) levels on your MetaTrader 5 chart. This script is particularly useful for traders who want to efficiently manage their risk and reward without the hassle of manually calculating and entering these levels. Key Features: Effortless TP and SL Placement: With a few clicks, the script allows you to set predefined Take Profit and Stop Loss levels for you
FREE

EA の暗号通貨ライブティックデータの買値と売値および予約の深さ
利用可能な交換所:
1. Binance Spot (アクティブなチャートウィンドウで注文帳深度をサポート) および先物 (複数の注文帳深度をサポート)
2. Kucoin スポットと先物、アクティブなチャート ウィンドウでオーダーブックの深さをサポート
3. Bybit 先物およびインバース先物ティック データ ビッド アスク 最後
今後の取引所: OKX、MEXC など。
特徴 :
1. 買い値と売り値情報を含むライブティックデータ
2. 最高入札額と注文数量、ユーザーは設定から深さを有効/無効にできます
3. 履歴のロード: 始値高値安値終値値とティック値データを更新します
4. 履歴の自動更新:MT5ターミナルを再起動すると不足しているバーを埋める
5. 暗号データのストラテジーテスターを使用して、暗号シンボルティックのエキスパートアドバイザーであらゆる戦略をバックテストできます
6. このユーティリティは外部 DLL ファイルをロードする必

This indicator finds Double Top and Double bottom Example : What is Double Top When price establishes a new high and then falls, then reverse to the same candle area of High then its considered a valid double top and vice versa for double bottom. 1. It plots and high and low on visible chart if ChartChange is set to true else it searches on new bar opening
2. If there is double top and double bottom found in visible chart window then it plots a line 3. It has options to customize text color, te
FREE

ハンマー ローソク足パターンは 1 本のローソク足によって形成されます。 ハンマーローソク足パターンを識別する方法は次のとおりです。 キャンドルは小さいボディです 下部の芯は本体に比べて大きくなければなりません 上部には芯がないか、非常に小さい 体の色は関係ない この 1 本のローソク足の強気パターンは反転パターンであり、底値を見つけるために使用されます。 このため、私たちは下落後にこのパターンを確認し、強気派が主導権を握り始めていることを確認したいのです。 ハンマー ローソク足パターンが適切な位置に表示されると、次のような表示がされることがあります。 下降トレンドの終わりと上昇トレンドの始まり 引き戻しの終わり、上昇トレンドの再開 38ドル (残り1部)次回価格138ドル
EA Hammer GA は、通貨ペア、指数、金属、商品、暗号通貨など、あらゆる種類のシンボルで動作します。 Guardian Angel EAのチャンネル: ここをクリック GA EA を購入すると、ボーナスとして、選択した他の GA エキスパートを入手できます。 *(MQL経由ではなく、取引端末からの

の 強気エングルフィングローソク足パターン 2 本のキャンドルによって形成されます。 強気エングルフィングローソク足パターンを識別する方法は次のとおりです。 最初のろうそくは弱気でなければならない 2番目のろうそくは強気でなければならない 2番目のキャンドルの本体は1番目のキャンドルの本体を覆う必要があります この 2 本のローソク足の強気パターンは反転パターンであり、底値を見つけるために使用されます。 このため、私たちは下落後にこのパターンを確認し、強気派が主導権を握り始めていることを確認したいのです。 強気エングルフィング ローソク足パターンが適切な位置に表示されると、次のような表示がされることがあります。 下降トレンドの終わりと上昇トレンドの始まり 引き戻しの終わり、上昇トレンドの再開 38ドル (残り1部)次回価格138ドル
EA Hammer GA は、通貨ペア、指数、金属、商品、暗号通貨など、あらゆる種類のシンボルで動作します。 Guardian Angel EAのチャンネル: ここをクリック GA EA を購入すると、ボーナスとして、選択した他の GA

の 貫通ローソク足パターン 2 本のキャンドルによって形成されます。 ピアシングローソク足パターンを識別する方法は次のとおりです。 最初のろうそくは弱気でなければならない 2番目のろうそくは強気でなければならない 2 番目のローソク足の始値は 1 番目のローソク足より低くなければなりません (そこにギャップがあります) 2番目のキャンドルの終値は、最初のキャンドルの実体の50%レベルを超えている必要があります。 この 2 本のローソク足の強気パターンは反転パターンであり、底値を見つけるために使用されます。 このため、私たちは下落後にこのパターンを確認し、強気派が主導権を握り始めていることを確認したいのです。 ピアシング ローソク足パターンが適切な位置に表示されると、次のような表示がされることがあります。 下降トレンドの終わりと上昇トレンドの始まり 引き戻しの終わり、上昇トレンドの再開 EA Piercing GA は、通貨ペア、指数、金属、商品、暗号通貨など、あらゆる種類のシンボルで動作します。 ***Buy Piercing GA EA and you could

黄金パターンは、フィボナッチ数列の黄金比に基づいた 3 本のローソク足の構成です。
黄金比は1.618です。 その変動には、0.618、2.618、および 3.618 が含まれます。 このインジケーターでは、2.618 で最高の結果が得られます。
ゴールデン パターンは通常のローソク足とそれに続く大きなローソク足で構成され、終値は最初のローソク足の少なくとも 2.618 倍になります。
強気のゴールデンパターンは強気のローソク足で作られているのに対し、弱気のゴールデンパターンは弱気のローソク足で作られています。
シグナルに加えて、推奨されるエントリーラインが青い線として描かれ、最後の 2 本のローソク足に広がります。
そのパラメータは次のとおりです。
フィボナッチ比率 (0.618、1.618、2.618、3.618 など) 上記のシグナルの Wingdings コード、つまり弱気シグナル (スクリーンショットの Wingdings テーブルを参照) 上の信号の色 (弱気) 以下のシグナルの Wingdings コード、つまり強気シグナ

Gold Gridscalping is designed with a Moving Average and MACD indicator for entry points.
If you have suggestions or criticism, or additional features and indicators, please submit them via comments or reviews. I will fix it in the next version.
Recommendations: Currency pair: GOLD/ XAUUSD Timeframe: M5 Minimum deposit gold/xauusd : $1000 ($2000 recommended) Account type: standart, Raw, or zero spread accounts IMPORTANT: It is very important to use LOW SPREAD accounts for best results !
FREE

Crash Spike master is the future for trading Crash markets. It has been designed to run on Crash 300 , 500 and 1000 markets on the 1 minute timeframe. It has 2 different trading modes (Aggressive and Normal) Aggressive mode will plot Yellow and blue arrows. 2 different conditions to help you make the right choice. Enter first trade on yellow arrow and second trade on blue candle. SL in this mode will be 10 Candles from the blue arrow. Normal mode will only plot red arrows on the chart. This mode

HAshi-EはHeiken-Ashiシグナルを分析する強化された方法です。
説明
HAshi-Eは、Heiken-Ashiシグナルを分析するための強化された方法です。HAshi-Eは、Heiken-Ashiシグナルを分析するための強化された方法です。HAshi-Eは、Heiken-Ashiシグナルを分析するための強化された方法です。伝統的なローソク足チャートとは異なり、ヒーケンアシのローソク足は過去のバーの平均値を使って計算されるため、よりスムーズで解釈しやすい視覚的表現が可能です。
その主な利点は、ほとんどの人が本来の読み方をしない理由でもあります。Heiken-Ashiローソク足には平均値に関する情報が含まれており、通常、資産ローソク足の前に配置されているため、色や形に惑わされ、不適切な時間帯や遅い時間帯にエントリーやエグジットを行う人をよく見かける。
HAshi-Eは、伝統的なHeiken-Ashiインジケータの改良版です! HAshi-E(チャート版)の特徴: 同じデータを異なる角度から見る HAshi-Eは、伝統的なHeiken-Ashiローソク足だけでな

Spike Hunter has been developed for Crash and boom markets.
Spike Hunter does not repaint.
Also please download SPIKE HUNTER(B)-boom and SPIKE HUNTER(B)-crash from the comments section to assist with extra confirmation Buy Signal ; Make sure that the trend for boom is Uptrend on 15 and 30min. Use the SPIKE HUNTER(B)-boom on your chart. Once the Up arrow comes on and the SPIKE HUNTER(B)-boom line color is blue then its the best time to trade. Sell Signal ; Make sure that the trend for crash

Designed by Welles Wilder for daily commodity charts, the ADXW is now used in various markets by technical traders to assess the strength of a trend or even a trend for short- or long-term trades.
The ADXW uses a positive (DI+) and negative (DI-) directional indicator in addition to its trend line (ADX).
According to Wilder, a trend has strength when the ADX signal is above 25; the trend is weak (or the price has no trend) when the ADX is below 20. The absence of a trend does not mean that

Master Nasdaq FTMO MT5 is a very accurate expert advisor for Nasdaq/ US100/ USTEC/ NAS100/ NDX index. This EA is designed with MACD divergence, RSI divergence, RSI, Moving Average, and other secret indicator/ method for entry position. This EA is a single entry method use stop loss and take profit with ATR.
Propfirm & FTMO no longer supported, I am sorry about that.
This EA has been rigorously tested at several backtest levels, but past results do not guarantee future results. Please do y
Introducing our Rejection Block Scanner – a powerful and intuitive tool designed to revolutionize your trading by effortlessly identifying key rejection zones across various timeframes. This cutting-edge scanner is crafted to cater to both beginner and experienced traders, offering unparalleled insights into potential market turning points.
**Key Features:**
1. **Multi-Timeframe Analysis:** Uncover opportunities on a grand scale! Our Rejection Block Scanner meticulously scans multiple timef
FREE

Simple Trading Panel is a manual tool for safe trading. Monitored by the mentor and indicators. This panel has many useful settings to take your trading to the next level.
Simple Trading Panel offers features:
Adjustable stop loss, take profit, volume, trailing stop with profit in percent, risk ratio, news filter and much more. Test results Simple Trading Panel does not work in the strategy tester!
Recommend Account type: Hedging, Zero, Micro, Standard, Premium or ECN Brocker with low spr
FREE

Functional in the Forex market. Functional on the B3 market - Bolsa Brasil Balcão. Motivation The Price Guide indicator is a tool that helps you insert support and resistance points at the chosen price and in the quantity you want, it depends on the agility of its configuration. This DEMO version will work on the Meta Trader 5 Demo account and Strategy Tester. Get the Full version that works with a Real account click: https://www.mql5.com/pt/market/product/111897 Operation The methodology publi
FREE

Functional in the Forex market. Functional on the B3 market - Bolsa Brasil Balcão. Motivation The Price Guide indicator is a tool that helps you insert support and resistance points at the chosen price and in the quantity you want, it depends on the agility of its configuration. This FULL version will work in Meta Trader 5 on all accounts and Strategy Tester . To test on the DEMO account , download the free version at: https://www.mql5.com/pt/market/product/111620 Operation The method

The Adaptive Market Navigator(AMN) EA is an automated trend-based trading advisor combining the advantages of ATR, Bears Power and Moving Average indicators. The used strategy is well suited for both beginners and experienced traders.
The minimum deposit is $100 for a 1:100 leverage.
I recommend to use a 1:100 ECN account with a low spread and a fast VPS.
Optimized for EURUSD pair on 1H timeframe.
Due to the simplicity and convenience of this EA every user can give it a try and choose t
Master Engulfing is designed with a moving average indicator to see trends, RSI and CCI to see momentum, and engulfing candles for entry points. Master Engulfing is a very accurate expert advisor for gold and all pair currencies. This EA has a lot of tools for entry position, you can make grid/ averaging or single entry, it's your choice.
Requirements :
Currency pair: XAUUSD/GOLD and ALL PAIR CURRENCIES Timeframe: M5 Minimum deposit currencies : $250 ($500 recommended) Minimum deposit gold/

Stat Monitor is a good information indicator.
Benefits of the indicator: The indicator provides useful information - the current spread, the cost of one lot of the symbol, trading leverage and the recommended lot size for trading. You can use the indicator on the MetaTrader 5 trading platform of any broker. The indicator provides useful information.
Version of the Stat Monitor indicator for MetaTrader 4 I wish you all good luck in trading and stable profit!
FREE

O indicador é uma ferramenta desenvolvida para o MetaTrader, projetada para auxiliar na análise detalhada do comportamento do preço em relação a uma média móvel específica. Ao ser anexado ao timeframe diário, o ele realiza cálculos e monitora, em timeframes menores, quantas vezes o preço toca determinados níveis de afastamento durante o dias além de calcular a média dos toques.
MT4: https://www.mql5.com/pt/market/product/111706
FREE

Master Bollinger Bands is designed with a bollinger bands indicator for entry points.
Please give me 5 stars reviews, than I will be maintain & update this free EA for longtime or all of time. I am promise.
Recommendations:
Currency pair: ALL PAIR CURRENCIES Timeframe: M5 Minimum deposit currencies : $250 ($500 recommended) Minimum deposit gold/xauusd : $1000 ($2000 recommended) Account type: Raw or zero spread accounts IMPORTANT: It is very important to use LOW SPREAD accounts for best
FREE

Flat è una utility pensata per chi ama operare con take profit e stop loss virtuali ed ordini di copertura come sistema di protezione del capitale, ma a volte ad esempio la notte non è possibile operare quindi si è costretti ad intervenire nel momento e nel modo sbagliato Facciamo un esempio, dopo aver ricevuto un segnale ti posizioni sul mercato con una posizione Long ma il mercato a bassi volumi e comprendi che il tuo posizionamento è valido ma bisogna attendere più di quanto pensavi fosse ne

Profit X invia notifiche sul tuo dispositivo mobile mantenendoti aggiornato sul profitto dei tuoi investimenti anche nei momenti in cui non puoi fisicamente controllare i mercati, ad esempio quando sei alla guida, sul posto di lavoro, in una riunione o con amici, con parenti e non puoi distrarti Può essere disattivata e attivata ed è possibile scegliere la frequenza del aggiornamenti in minuti, ore, giorni, settimanale o mensile La configurazione e personalizzazione è molto semplice, di default
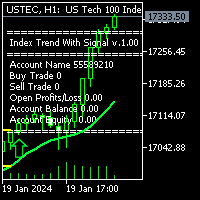
Description: Index Trend with Signal: is the Best working on DE40, USTEC, US30, US500 index on H-1 time chart with default settings. You don't need to change any settings. Easy to install and ready to start working. First of all this Index Trend with Signal Indicator is Non-Repainting, Non-Redrawing Indicator, which is best tool for Index Traders. For limited time only 50% OFF, Now 51$ only. 10 purchases left & the price increases to 30$ and final price will be 300$
Contact me right after t

Vision è un indicatore professionale che legge i dati storici del periodo impostato e in base a tali elabora una previsione scrivendo l'andamento sul grafico, l'impatto visivo eccellente rende chiaro l'andamento del prossimo trend e mette a fuoco il prezzo d'ingresso il posizionamento di ordini e la distanza per SL e TP, di default è impostato con un rapporto bilanciato 24 a 24 ciò significa che in base alle ultime 24 candele prevederà scrivendo sul grafico l'andamento delle 24 candele successi

**MT5** Elevate your risk management game with Equity Savior, the go-to Expert Advisor designed to safeguard your equity during prop firm challenges. This powerful yet user-friendly tool lets you choose your preferred trading session, set a maximum lot size, and establish a daily trade limit effortlessly. Key Features: Session Selection: Tailor your trading approach by selecting specific sessions, aligning with your strategy and prop firm challenge requirements. Max Lot Size Control: Take co

The Morning Star candlestick pattern is formed by three candles. Here’s how to identify the Morning Star candlestick pattern: The first candle must be bearish The third candle must be bullish The second candle must be small compared to the others, like a Doji or a Spinning Top The color of the second candle doesn’t matter Ideally, the body of the second candle shouldn’t overlap with the bodies of the other two candles This 3-candle bullish candlestick pattern is a reversal pattern, meaning t

The Three White Soldiers candlestick pattern is formed by three candles. Here’s how to identify the Three White Soldiers candlestick pattern: Three consecutive bullish candles The bodies should be big The wicks should be small or non-existent This 3-candle bullish candlestick pattern is a reversal pattern, meaning that it’s used to find bottoms. For this reason, we want to see this pattern after a move to the downside, showing that bulls are starting to take control. When a Three White Soldi

The White Marubozu candlestick pattern is formed by one single candle. Here’s how to identify the White Marubozu candlestick pattern: One single bullish candle The body must be big The wicks should be small or non-existent This 1-candle bullish candlestick pattern is a reversal pattern, meaning that it’s used to find bottoms. For this reason, we want to see this pattern after a move to the downside, showing that bulls are starting to take control. When a White Marubozu candlestick pattern ap

The Three Inside Up candlestick pattern is formed by three candles. Here’s how to identify the Three Inside Up candlestick pattern: The first candle must be bearish The second candle must be bullish The close of the second candle should ideally be above the 50% level of the body of the first one The third candle should close above the first one This 3-candle bullish candlestick pattern is a reversal pattern, meaning that it’s used to find bottoms. For this reason, we want to see this pattern
MetaTraderマーケットはMetaTraderプラットフォームのためのアプリを購入するための便利で安全な場所を提供します。エキスパートアドバイザーとインディケータをストラテジーテスターの中でテストするためにターミナルから無料のデモバージョンをダウンロードしてください。
パフォーマンスをモニターするためにいろいろなモードでアプリをテストし、MQL5.community支払いシステムを使ってお望みのプロダクトの支払いをしてください。
取引の機会を逃しています。
- 無料取引アプリ
- 8千を超えるシグナルをコピー
- 金融ニュースで金融マーケットを探索
新規登録
ログイン