YouTubeにあるマーケットチュートリアルビデオをご覧ください
ロボットや指標を購入する
仮想ホスティングで
EAを実行
EAを実行
ロボットや指標を購入前にテストする
マーケットで収入を得る
販売のためにプロダクトをプレゼンテーションする方法
MetaTrader 5のための新しいエキスパートアドバイザーとインディケータ - 122

Melhor regra de coloração pra RENKO no MT5. Lucre de forma simples no mercado Brasileiro e também no Forex. Gatilhos precisos, indicando ótimos pontos de compra e venda no mercado.
Pode ser utilizado no Mini Dólar e Mini índice Pode ser utilizado no mercado Forex.
O indicador contém a regra de coloração aplicada ao RENKO.
O indicador permite a alteração dos parâmetros: período e tamanho do renko
O indicador permite a alteração das cores dos renkos.

ThanosAlgotrade is an automatic trading advisor for obtaining stable profits over a long period of time. Does not require manual intervention. Designed to work in the MT5 terminal on "hedge" type accounts , the Adviser needs to be installed on the EURUSD currency pair chart on the M1 time frame and enable auto trading.
Monitoring of the adviser's work can be viewed here

This is a customizable three moving averages indicator useful in crossover trading technique. Yo can set various parameters such as calculation methods (exponential, simple, etc.), period and price type for each MA separately from one input dialog.
Parameters: Period <1,2,3> - Period of a moving average Shift <1,2,3> - Shift of a moving average Method <1,2,3> - Method of calculation for each moving average set separately Applied Price <1,2,3> - Set price type for calculations for each movi
FREE

A utility to close all positions and orders with one simple click at once.
Various options are available to filter or select orders and positions : Type of orders/positions : Buy / Sell / Buy Limit / Sell Limit / Buy Stop / Sell Stop Symbol Selection : All / Chart Symbol / Custom Symbols. You can enter custom symbols separated by comma. (for example you can enter EURUSD,GBPUSD,AUDJPY) Order Open Type : Manual Opened / Opened by EA Magic Number : You can enter more than one magic number separat

Before you buy a night scalper please be aware of the risks involved: Past performance is no guarantee of future profitability (the EA could also make losses). The backtests shown (e.g. in screenshots) are highly optimized to find the best parameters but therefore do not give a realistic prediction of future profitability. Any mean reversion can get caught on the wrong side of a fast movements due to unexpected news or flash crashes. This strategy will always use a stop loss, but still executi
Binary Options Assistant (BOA) KAM Signals Indicator provides signals based on gkNextLevel Binary Options Strategy. Indicators: 3 Moving Averages & Stochastic
Stop missing trades, stop jumping from chart to chart looking for trade set-ups and get all the signals on 1 chart! U se any of the BOA Signals Indicator with the Binary Options Assistant (BOA) Multi Currency Dashboard . All BOA Signal Indicator settings are adjustable to give you more strategy combinations. The signals can be seen v

The Moving Average
( https://www.youtube.com/c/TheMovingAverage/ )
inspired to create All in One 4MA-s with his color setting.
It Put up 4 Smoothed Moving Averages
With Arty chosed colors.
You can modify the settings / Parameters of the indicator
It's easy to use don't have to waist time to set up all 4 MA-s
just put this up.
Hope its helpfull and Arty don't mind it.
You can donate my work here:
https://discotechnika.hu/MQL/PayPal_Donate.jpg
or here
PayPal.Me/HunSkippy
FREE

En este producto se utiliza una estrategia de trading con unos de los indicadores comúnmente utilizados en el mercado, esto en conjunto con una solida experiencia del mercado en la que se observa el cambio de tendencia con un respectivo cruce de los indicadores. El precio a su vez tiene que estar alineado con los indicadores de tal manera que todo este acomodado. A su vez esta estrategia tiene un trailing stop fijado a 100 pips.
PARAMETROS: inp5_VolumeSize: Se recomienda su uso en 0.1 para c
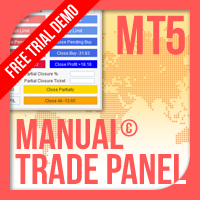
手動トレードパネルEAMT5 は、MT5で見つけることができる最も簡単で使いやすいトレードパネルです。追加のウィンドウやパネルを開く必要なしに、すべてのオプションと機能が1つのサーフェスにあります。これは、注文管理、リスク計算、部分閉鎖、アカウント保護ユーティリティのすべてを1つにまとめた、非常に便利なインターフェースです。
Manual Trade Panel EA MT5 を使用することで、従来の手動取引方法よりも何倍も速く正確に取引することができ、取引の決定に集中するためのより多くの時間と明確な心を得ることができます。
アカウントの保存は私たちの最優先事項であるため、 手動取引パネルEA MT5 は、アカウントが利益を得るか停止した後、すべての未決済の取引を閉じ、すべての保留中の注文を削除し、EAが添付されているすべてのターミナルチャートを閉じることができる優れたアカウント保護ユーティリティでもあります損失の公平性に達しました。これは、利益条件で非常に便利であり、エクイティが希望のストップロスレベルを下回ったときに、取引口座をさらなる損失から救うことができます。 ヒント
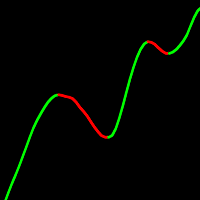
巨大なカスタマイズオプションを持つ移動平均。 スムージングの10種類。 構築するための12の価格オプション。 結果として生じる移動の離散化の可能性。 クイックコード。 制限なしに専門家で使用する能力。 UniversalMA指標は、現代の取引で使用される最も一般的な建設方法を組み合わせたものです。 したがって、多くの異なる指標を持つ必要はもはやありません。 指標ベースのエキスパートアドバイザー 移動平均は、設定された期間にわたる商品の平均価格を表示する価格ベースの遅れ指標です。 基本的に、移動平均は、チャートを解釈しようとすると、"ノイズ"を滑らかにします。 移動平均は、勢いを評価するだけでなく、傾向を確認し、サポートと抵抗の領域を特定するための良い方法です。 移動平均を使用する方法の巨大な様々ながあります。 以下は、最も一般的な使用方法の例です:移動平均の方向(この方法を使用する主なルールは、移動平均の一般的な方向を追跡することです:それは市場 この動きの方向にのみ取引を行う価値があります。 このような単純なルールは、移動平均法を短期予測のための便利なツールにします)、価格チャートで
FREE

The robot uses one of the most known and used indicators in the world
BOLLINGER BANDS
There are two trading strategies: Upper or Lower Band Break and; Bollinger Band Entry.
Know our products
Position openings are based on the parameters identified as signals.
This Expert Advisor (EA) works on HEDGE (Forex, etc.) and NETTING (Bovespa, etc.) accounts, but manages only one position at a time.
The filters are used to increase the accuracy of the signals and if activated and not met

ボリンジャーバンドとストキャスティクスとの戦略取引
ボリンジャーバンドは主にトレンドを追うために使用されます。
オープン保留中の注文の購入または販売のための確率的メインラインおよびシグナルラインの使用
フィボナッチは目標利益、サポート、レジスタンスレベルの価格を使用しています
アドバイザAuto3MProMT4はVPSで動作できます。
MT4 version : Auto3M Pro MT4
特徴 マーチンゲールなし ハードストップロスと各ポジションの利益を取る ボリンジャーバンドによる柔軟なストップロス、固定小数点、以前の高さまたは低さ、フィボナッチレベル 柔軟な固定小数点間で利益を取り、フィボナッチレベルで利益を得る 固定小数点間の柔軟なトレーリングストップとストップレベルの乗算 資金管理 ニュースフィルター 保留中の注文をインターバル時間で自動的に削除 保留中の注文には買いストップと売りストップ機能を使用します 自動チャートにフィボナッチ、ボリンジャーバンド、ストキャスティクスを追加 市場が閉じる前に利益を閉じる バランスによる動的ロットサイズ ヘ

EEVCC Hedge
プロモーション価格:$ 59アクティベーション:10 序章 これは双方向(同時に購入と販売)のグリッドヘッジ取引EAです 長期の確定オファーは有益です 同時に複数の通貨で使用できます 安全な利益計算方法 特性 トレーディングチャート:H1 推奨通貨:EURGBP、EURUSD 最低入金額:3000USD、推奨10000USD、セントアカウントの場合は100USD 推奨ブローカー:RofoForex、Exness、およびレバレッジが高くセントアカウントを持つその他のプラットフォーム リンク: https://www.mql5.com/ja/users/maxlake/seller パラメータ UseAutoMagic = true;自動マジックナンバーを使用するかどうか MagicNumber = 2; UseAutoMagic = falseマジックナンバーを設定します ロット= 0.01;初期取引量 LotFactor = 1.8;グリッド乗算の倍数 NetGap = 300;グリッド距離 TakeProfit = 450; Take Profit Stab

EAはストキャスティクスオシレーターインジケーターに基づいて注文を開始します。すべてのインジケーターパラメーターを構成および最適化できます。
EAは、このインジケーターを操作するための2つの戦略を実装しています。 インディケータのメインラインが買われ過ぎ/売られ過ぎのレベルに達するとすぐに取引を開始します。 買われ過ぎ/売られ過ぎゾーンのインジケーターチャートのメインラインによって反転パターンが形成されたときに取引を開始します。 同時に開かれる買い注文と売り注文の数は別々に設定されます。このおかげで、EAはトレンドの方向にしか使用できません。 オプション TRADING TIME -取引時間管理 UseTradingTime -取引時間を有効にする TimeStartTrading -取引開始時間 TimeEndTrading -取引終了時間 MONEY MANAGEMENT -お金の管理パラメータ Lot -ロットサイズ MaxBuyOrders -同時に開いている買いポジションの最大数 MaxSellOrders -同時にオープンしている売りポジションの最大数 TAKEP

The Fara Expert Advisor with a drawdown of 6% for 3 years shows itself best on the EUR/USD H1 pair. It uses only three indicators "Moving Average", "Bollinger Bands" and "Top Bottom Price" . Each trade is protected by a Stop Loss and Take Profit. In the parameters of the Expert Advisor, you can change the lot size, as well as the values of indicators, Stop Loss and Take Profit, if necessary. Below is the testing statistics for 3 years. Other product: https://www.mql5.com/ru/users/rev

ボリンジャーバンドとストキャスティクスとの戦略取引
ボリンジャーバンドは主にトレンドを追うために使用されます。
オープン保留中の注文の購入または販売のための確率的メインラインおよびシグナルラインの使用
アドバイザAuto3MLiteMT4はVPSで動作できます。
Pro version MT4
Pro version MT5
特徴
マーチンゲールなし ハードストップロスと各ポジションの利益を取る トレーリングストップ 保留中の注文をインターバル時間で自動的に削除 保留中の注文には買いストップと売りストップ機能を使用します 取引戦略
AUTO3M Lite MT4は9通貨ペアEURUSD、GBPUSD、AUDUSD、NZDUSD、USDCHF、USDCAD、USDJPY、EURJPY、GBPJPYで取引されています
保留中の注文の購入停止または販売停止のみを使用します。
ストキャスティクスは、相場分析と新しいバーでの分析にのみ使用されます。
確率的メインラインが90を超え、ビッドが90未満の場合、アッパーバンドは注文待ちの売りストップを準
FREE
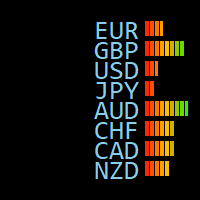
導入 これは、トレーディングアシスタント、情報パネルインジケーター、総通貨統計、アカウント統計、位置情報、サーバーと現地時間、通貨の強さ、Kラインの残り時間、サポートとレジスタンスのライン、サーバーのタイムオフセット、通貨の変動レートなどの機能です。 すべての種類の口座と通貨に使用できます。 優れたパフォーマンス、ごくわずかなリソース 位置、色、フォントサイズをカスタマイズできます 任意のモジュールを個別に表示または無効にすることができます
特性
1.通貨統計
デイリーオープン、ハイ、ロー、クローズ デイリーライン当日の高値-安値 デイリーラインの昨日の高値-安値 5日間の平均変動 10日間の平均変動 20日間の平均変動 50日間の平均変動 その日の上昇と下降 その日の上昇と下降のポイント 現在のスプレッド 通貨と現在の価格
UseSidebar = true; SideFontSize = 10; XLocation = 90;水平方向の位置 YLocation = 20;垂直位置 SideXGap = 90;水平方向の間隔 SideYGap = 19;垂直方向

1.このEAは、出口戦略(リバース/ヘッジ)マーチンゲールを備えた自動テイクプロフィット、ストップロス、トレーリングストップ&プロフィットロックです。
2. PCチャートまたはモバイル取引(VPSの場合)のいずれかでの手動取引に適しています
3.変数入力はピップ単位です
4. 1番目の位置は自分で手動で開きます(購入/販売)。その後、TP、SL、TS、プロフィットロックが設定されます。
5.最初の手動取引(失敗)がトレンドに反する場合、2つの出口戦略があります。
(a)リバースマーチンゲール(売り)は、最初の手動取引(買い)がSLに当たったときにアクティブになります。
(b)最初の手動取引(購入)がSLにヒットすると、ヘッジマーチンゲール(購入)がアクティブになります。
*最初の手動取引(売り)がSLに当たったときはその逆です。
6.トレーリングストップとトレーリングステップは、最初の手動取引がトレンドに入ったが突然逆転したときにアクティブになります。
7.利益ロックは、同じペ

Entry upon breakout of daily volatility. Exit using a trailing stop. Deposit recovery function after drawdown. No risky strategies. You can work with a minimum initial deposit of $10. There is a version of this robot for the MT4 platform Day and Trail MT4
Strategy.
The entry is performed in case of a breakdown of the extremum of the previous day. This usually happens when market volatility increases, so in the event of a breakout, the price travels a significant distance. The robot tracks

RENKO Reversal by StockGamblers Actually working RENKO in MT5. Uses "custom symbols" for drawing. You can apply any indicators with complete peace of mind. The movement of the last price is displayed in real during the formation of the "brick". Put the script in the MQL5/Experts folder. More precisely: C:\Users\user\AppData\Roaming\MetaQuotes\Terminal\terminal_number\MQL5\Experts Settings: ValuePerBar - height of the "brick" in points revCandle - multiplier for the height of the turning "brick".
FREE

https://t.me/mql5_neuroExt actual version Signal https://www.mql5.com/ru/signals/1511461
You can use any tool. The bases will be automatically created at the start of the Learn. If you need to start learning from 0 - just delete the base files. Initial deposit - from 200 ye. Options:
DO NOT ATTEMPT TO TEST WITHOUT NEURAL NETWORK TRAINING!
it is enough for the balance graph after training to be horizontal.
generating a training base is extremely simple.
there is a ready-made training
FREE

BigPIPS EA is an Expert Advisor based on special mathematical analysis and smart modeling of market and signals independent of timeframe. The EA has a powerful calculation engine that can predict market movement over 1000 pips (10000 points). The EA signal engine does not need any optimization and there are no settings for signal. All settings of EA are for Money Management.
The EA works with a low margin level and thus has low risk. The EA can trade on all Forex Pairs, Cryptos, Stocks, Indi

As you know, the main invariable indicator of all traders is the moving average; it is used in some way in most strategies. It is also obvious that this indicator is capable of showing good entries in every local area. For which it usually needs to be optimized or just visually adjusted. This development is intended for automatic optimization of the indicator. Once placed on the chart, the indicator will automatically re-optimize itself with the specified period ( PeriodReOptimization ) and dis

Moving Average Convergence/Divergence — схождение/расхождение скользящих средних — технический индикатор, разработанный Джеральдом Аппелем (Gerald Appel), используемый в техническом анализе для проверки силы и направления тренда, а также определения разворотных точек. Встроенный в MetaTrader 5 индикатор MACD не соответствует задумке автора (Gerald Appel):
-линия MACD графически изображена в виде гистограммы, однако гистограммой отражается разница между линией MACD и сигнальной линией;
-сигнал
FREE

A simple price action indicator to highlight inside and outside bars (candles) with colors. It is possible to choose what type of bar can be highlighted among: inside, ouside or both. It is can be possible to choose a first specific color for the shadow and the border of bars (candles), a second specific color for high/bull bar (candle) and a third specific color for down/bear bar (candle)
FREE

The QRSI indicator is one of the most important and well-known indicators used by traders around the world. All signals are generated at the opening of the bar. Any closing price or zero bar prices are replaced with the corresponding price of the previous bar in order to avoid false results. This indicator is suitable for those who are interested in the classic calculation method but with improved functionality. There is a version for both MT4 and MT5.
By its nature, the QRSI indicator is an
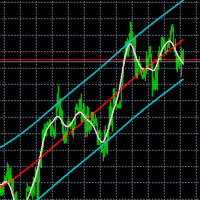
Flex channel - indicator plots channel using Hodrick-Prescott filter. Hodrick-Prescott filter is the method of avreaging time series to remove its cycling componets and shows trend. Settings HP Fast Period - number of bars to calculate fast moving average
HP Slow Period - number of bars to calculate slow moving average
Additional information in the indicator Channel width - channel width in pips at first bar MA position - fast moving average position in the channel in persentage
Close positio

This indicator is a very simple indicator that draws candlesticks on a chart. However, it is possible to draw not only on the main chart but also on several sub-charts. In addition,it is possible to draw different symbols and timeframes from the main chart. features. 1. any symbols 2. any timeframes 3. two candle type(normal and heikin ashi) 4. many candle colors(intersection with ma_1) 5. pivot line (ver1.2) In case of positive candle, FULL : change color if low is over ma_1 PARTIAL :
FREE

723% de lucro desde Janeiro de 2021 até Agosto de 2021
Opera exaustões de preço, detectando momentos de sobrecompra ou sobrevenda do ativo para o dia. Parametrizado para abrir apenas 1 ordem por dia, diminuindo sua exposição e com pouco custo de taxas de corretagem de sua corretora. Assertividade de 69% em suas operações. Rendimento médio mensal de 14,6% de 01/01/2018 até 2022 Investimento mínimo recomendado : R$2.000,00 para 1 mini contrato.
Parâmetros prontos para rodar no mini índice futu

Catch major price movements, early in the trend. Alerts you to enter at the likely beginning of a trend, and if it's incorrect, quickly alerts you to exit to limit any loss. Designed to capture large, profitable price movements, with early entrance to maximize your returns. As shown in screenshots, typical behavior is several quick entrance/exists with small loss , and then capture of a large trend with high profits . The Instantaneous Trend indicator is a lag-reduced method to detect price t

"Driver Road Bands" indicator that is designed to be used in the 1H, 4H and 1D timeframes in the most ideal way. If we compare timeframes to roads and streets; main streets and highways with high traffic volume are similar to high-time timeframes in technical analysis. If you can interpret the curvilinear and linear lines drawn by this indicator on the graphic screen with your geometric perspective and develop your own buy and sell strategies; you may have the key to being a successful trader.
FREE

Selling price at $128 for 5 copies. Next selling price will be at $198.
TLDR: The legendary Scalp Nightingale utilizes an in-house developed signal guided by trend anchorage to perform night scalping on multiple currencies. There are a few different trading modes available depending on the user’s risk appetite. Try it, love it, own it…!
Back test results are shown in the Screenshots. Back test period start from Jan 2018 until the date of the EA is published. History is not cherry picked! Th

MT4/5通用交易库( 一份代码通用4和5 ) #ifdef __MQL5__ #define KOD_TICKET ulong #define KOD_MAGIC long #else #define KOD_TICKET long #define KOD_MAGIC int #endif class ODLIST; #import "K Trade Lib Pro 5.ex5" //祝有个美好开始,运行首行加入 void StartGood() ; //简单开单 long OrderOpen( int type, double volume, int magic, string symbol= "" , string comment= "" , double opprice= 0 , double sl= 0 , double tp= 0 , int expiration= 0 , bool slsetmode= false , bool tpsetmode= false ); //复杂开单

with JR Trend you will able to enter and exit every trade with just a signals appear no need for any strategy just flow the indicator it work on all pairs and all Timeframe i usually take a look on higher timeframe and return to the lowest timeframe and make an order with indicator signals you can see the amazing result so you can depend only on it intraday or swing as you wish
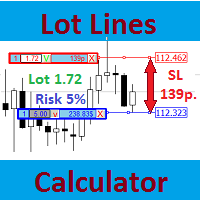
Большинство профессиональных трейдеров декларируют строгое соблюдение управления рисками. Этот простой инструмент разработан для быстрого расчета размера лота, чтобы торговать в соответствии со следующими базовыми правилами риск-менеджмента: Максимально допустимый риск устанавливается как фиксированный процент от общего количества средств на счете (например, 1-2%). Риск измеряется расстоянием в пунктах между открытием ордера и установленным стоп-лоссом. Так как для новичков всегда затруднительно
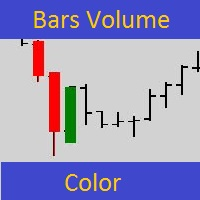
Все знают какую большую роль играют объемы в трейдинге. Основной индикатор объемов чаще всего находится в дополнительном окне и визуально плохо воспринимается. Этот простой инструмент разработан для быстрого и наглядного представления заданного объема непосредственно на графике с котировками для лучшей наглядности. Можно сразу оценить в каких местах на графике сконцентрировались большие объемы. Индикатор подкрашивает свечи по заданному объему от хая или лоу свечи до цены закрытия свечи. Если све

Use for EURUSD H1 is very good for low drawdown and high profit. Can use original data for trade if you want high profit you can adjust new data and test before run. Can run it minimum capital 500 USD but you increase capital you can safe very good for port. We recommend that you run it on port standard not run on port raw spread because your profit will decrease. If you run port on swap free is very good for you.

Entry Point EA 10 copies out of 10 left at $799 Next price --> $1467 Entry Point EA is the advanced scalping system which utilizes smart entry/exit algorithms with sophisticated filtering methods to identify only the safest entry points during calm periods of the market. This system is focused on a long-term stable growth. It is a professional tool developed by me years ago that is constantly updated, incorporating all the latest innovations in the trading area. Nothing fancy here, no testi

We use Price Action and Japanese Candlesticks at important price zones and standard times to open positions and use Risk/Reward: 1/2 - 0.2%/trade. Recommended symbol: EURUSD, GBPUSD, AUDUSD, USDCAD, USDJPY, GBPJPY, EURJPY. Contact me: Gmail: fifund.cuscare@gmail.com, Facebook , Twitter , Instagram . Product: Metatrader4 , Metatrader5 . Broker references: Exness , ICMarket , FBS .
FREE

Little Swinger (Best choice for passive income lovers)
Developed by RobotechTrading key features:
Financial Freedom Back testing results will match with real live trading results Proper TP and SL Controlled Risk Highly Optimized settings Running on our Real Live Accounts Little Risk, Little Drawdown, Little Stress, Little BUT stable income, just set and forget. Strategy:
Not Indicator based No Martingale No Grid No Repaint strategy Safe and Secure calculation of Live data and than t
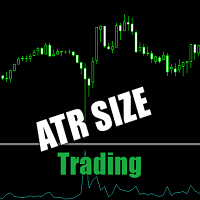
EA uses the value of the ATR indicator as a decision to open a trade, very useful to trade in the first moment of a big movement, because the ATR indicator is able to track the size of the movements in the period chosen by the user. The user includes the period of the indidacor ATR and the value/size that it is of interest to open a trade, the operation will take place in same direction of the signal candle.
EA utiliza o valor do indicador ATR como decisão para abrir uma operação, muito útil

Auto Order Block with break of structure based on ICT and Smart Money Concepts (SMC)
Futures Break of Structure ( BoS )
Order block ( OB )
Higher time frame Order block / Point of Interest ( POI ) shown on current chart
Fair value Gap ( FVG ) / Imbalance - MTF ( Multi Time Frame )
HH/LL/HL/LH - MTF ( Multi Time Frame )
Choch MTF ( Multi Time Frame )
Volume Imbalance , MTF vIMB
Gap’s Power of 3
Equal High
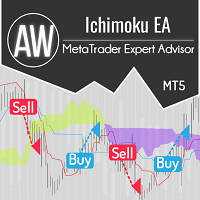
AW 一目均衡表インジケーターからのシグナルに基づいて取引する AW 一目均衡表EAは、一目均衡表インジケーターからのシグナルに基づいて取引します。この完全自動取引ロボットは、柔軟な設定と多くの操作シナリオを備えています。この製品には、自動ロット計算、仮想テイクプロフィット、バスケット内の最初と最後の注文をクローズする機能など、多くの便利な機能が組み込まれています。 問題解決 -> ここ / MT4バージョン -> こちら / 手順 -> ここ 利点:
シンプルで直感的なセットアップ 平均化戦略を使用する機会 最初の注文を最後の注文でカバーする 自動ロット計算 カスタマイズ可能なインジケーターパラメータ 3種類の通知: プッシュ、メール、アラート 戦略: アドバイザーは、「シグナル」セクションでインジケーターの設定に従って実装されたさまざまな戦略に取り組むことができます。 - 先行クラウド ブレイクアウト - 前のローソク足のクラウド先行スパンが考慮されます。クラウドが上から下へブレイクアウトした場合は売りシグナ

トレンド検出インジケーターはあらゆる戦略を補完し、独立したツールとしても使用できます。
インジケーターの操作に関する推奨事項、コメント #8 でダウンロードできます
利点
使いやすく、不要な情報でチャートを過負荷にしません。 あらゆる戦略のフィルターとして使用できます。 利益を得るのとストップロスを設定するの両方に使用できる動的なサポートとレジスタンスのレベルが組み込まれています。 ローソク足が閉じた後、インジケーターの色は変わりません。 株式市場、指数、石油、金、およびすべての時間枠で機能します。 トースト通知、電子メール通知、プッシュ通知、サウンドアラートの機能があります。 私の他の開発はここで見つけることができます: https://www.mql5.com/ja/users/mechanic/seller 入力パラメータ Alert-オン/オフ。アラート; Push Notification-オン/オフ。プッシュ通知; Mail-オン/オフ電子メール通知; Fibo 1,2,3,4,5,6,7,11,21,31,41,51,61,71-動的サポートと抵抗

Binance Future用のMt5ボット(エキスパート)
システムはBinanceFuture市場で稼働しています。
独自のコードに簡単に統合して、操作を自動化できます。
手動操作パネルが利用可能です。
ヘッジmod互換。
すべての操作は画面から手動で行うことができます。
これは、同時に多くの暗号通貨を制御するための最も効果的な方法です。
画面はバイナンス画面のテンプレートタイプです。 リンクからテンプレートファイルをダウンロードできます。
https://drive.google.com/file/d/1WHqGhym0QIK31l7kwfit9_tXb7YbqSuT/view?usp=sharing
このプログラムはインストールが必要です。
https://www.mql5.com/tr/market/product/68694
https://www.mql5.com/tr/market/product/73887
パラメーター
APIキー=バイナンスAPIキー
シークレットキー=バイナンスシークレットキー

ストラトの取引戦略 についてまだ学んでいない場合は、今すぐグーグルで検索してください。時間を無駄にしないことを約束します。使用するかどうかに関係なく、いくつかの新しいトリックを学ぶことができます。 OK、これで TheStrat とは何かがわかったので、このインジケーターが何をしてくれるかを理解できるようになります。 主な機能
つまり、インジケーターは次のことを行います。 サポートされているすべての時間枠の時間枠の連続性を表示 デイトレーダーとスイングトレーダーの2つのタイムセットビューをサポート 連続する 4 つの時間枠で完全な時間枠の継続性が適用されている場合に表示します 各時間枠の現在のろうそくの状態を表示します すべての時間枠で現在のパターンがあれば表示します 有効なパターンと実行可能なパターンの両方を表示 5 秒ごとに更新 (1 秒から設定可能) パネルをクリックして、選択した銘柄と時間枠のチャートを開くことができます チャートを開くために使用するチャート テンプレートを選択できます 表示するグループとそのグループ内のシンボルを選択します インジケーターは、ブローカーがサ

Expert Advisor は、積極的な取引向けに設計されています。 Expert Advisor には、トレンドの方向を決定するための新しい方法が備わっています。 EA は損失のないシステムで最小限の利益で取引し、すべての取引を制御します。
私たちのコミュニティの電報チャンネル - https://t.me/EAQuantumLab アドバイザーへの詳細な手順は、リンク https://eaquantumlab.com でご覧いただけます。 実際のシグナルはここから入手できます: https://www.mql5.com/en/users/vitalvasa/seller
取引に推奨されるペア EURUSD / GBPUSD / XAUUSD / USDCAD / NZDUSD / AUDUSD / EURJPY / 期間 M30 - H1 最低口座残高 1,000 ドル (1 ペアあたり) ロット計算 入金 $1000 ごとに 0.01 ロット 最小スプレッド
指示に従ってアドバイザーを設定してください!!! 重要な情報です! 最初の 2 週間は、デモ口座または

Dark Power is an Indicator for intraday trading. This Indicator is based on Trend Following strategy, also adopting the use of an histogram to determine the right power . We can enter in good price with this Indicator, in order to follow the strong trend on the current instrument. The histogram is calculated based on the size of the bars and two moving averages calculated on the histogram determine the direction of the signal
Key benefits
Easily visible take profit/stop loss lines Int

作業ロジック
ストップアウトユーティリティは、ストップアウトレベルまで残っているポイント数を示すシンプルですが非常に便利なインジケーターです。
その利点は、多くのトレーダーが利益を追求して取引する際のリスクを故意に過大評価し、利用可能なマージンを最大限に使用するという事実にあります。この場合、ブローカーがあなたのポジションを強制的に閉じることができる場所を知ることは非常に重要です。
チャートにインジケーターを配置するだけで、買いまたは売りのオープンポジションに応じて、チャート上にこの取引の価格の境界マークが表示されます。
ポジションを開くまで、ラインはチャートに表示されません。
チャートに線が表示されない場合、これはユーティリティが機能しないことを意味するものではなく、おそらく取引のリスクが最小限であり、預金が大きい場合は、ストップアウトラインをはるかに高く探す必要があります/現在のリスクではストップアウトから遠く離れているため、トレードよりも低くなります。
ご不明な点がございましたら、ディスカッションセクションにご記入ください。幸せな取引。 Recommen
FREE

アラートアップ-メタトレーダー5のダウン
このインジケーターは、価格がUPラインとDOWNラインの間のゾーンを離れたときにアラートを生成します。
次のようなさまざまなタイプのアラートを生成できます。
>サウンド
>メッセージボックス
>エキスパートボックスのメッセージ
>メール(以前に構成済み)
>プッシュ通知(以前に構成済み)
線は、線のプロパティからではなく、インジケータのプロパティから構成する必要があります。これは、線のプロパティから行うと、フィノナッチが影響を受ける可能性があるためです。
設定の中で、色、線のスタイル、幅を変更できます。 線は、線のプロパティからではなく、インジケータのプロパティから構成する必要があります。これは、線のプロパティから行うと、フィノナッチが影響を受ける可能性があるためです。
設定の中で、色、線のスタイル、幅を変更できます。

[ MT4 Version ] Only the next 10 units at current price! Final price: $299 How to trade using Order Blocks: Click here Discover the future of trading with Order Block Indicator , meticulously crafted for traders who demand unparalleled accuracy and customization. Whether you're scalping or swing trading, this tool is your gateway to mastering Order Blocks and Supply and Demand Zones—critical areas where price reversals often occur. Why Choose Order Block Indicator? Transform Your Trading Strate

1. What is this. This is a very rigorous indicator to show different market trading sessions. It shows the main markets: NewYork, London, Frankfurt, Sydney, Wellington, Tokyo. Very important: Different markets have different start and end dates for daylight saving time, and the trading session of a market can vary depending on daylight saving time and winter time. Also, the daylight saving time system is different for countries in the northern hemisphere and southern

The multi-currency indicator Currency Strength Index Plus can be set on the chart of any of the 28 currency pairs formed by 8 currencies (USD, EUR, GBP, AUD, NZD, CAD, CHF and JPY), for example, on EURUSD, H1. The indicator is designed to determine the direction of strength of each of the 8 currencies relative to each other. Using the strength and its direction of two opposing currencies, it is possible to make a currency pair with the best trading potential. Currency indices have flexible smoot

1. What is this. This is a very rigorous indicator to show different market trading sessions. It shows the main markets: NewYork, London, Frankfurt, Sydney, Wellington, Tokyo. Very important: Different markets have different start and end dates for daylight saving time, and the trading session of a market can vary depending on daylight saving time and winter time. Also, the daylight saving time system is different for countries in the northern hemisphere and southern hemisphe

The Asian Session - it is a Secure Automated Software for trade Forex market and indices.
This system detects the ranges between the end of the American session and the beginning of the Asian session, operating in favor of the break, thinking that this break prior to the start of the session occurs because within the Asian session there will be an impulse in favor of the break. breaking off. To adapt to the different schedules of the different brokers, you have to set the closing time of the A

Santa Trend Indicator is an efficient way to forecast and detect the trend in any market. Advantages Generates instant buy and sell signals. Provides an alternate exit strategy to your existing trading system. Never repaints, never backpaints, never recalculates. Works in all symbols and all timeframes. Perfect trend filter for any strategy or expert advisor. Fully compatible with Expert Advisor (EA) development. Does not lag.
FREE

This indicator shows the breakeven line level for the total number of open positions of the current symbol with P/L value and total volume. This indicator is helpful to decide the exit level when using a trading grid strategy. The style of the breakeven line is customizable to choose the color, line shape and font size of the positions description. Send mobile notification when crossing a positive P/L target
FREE
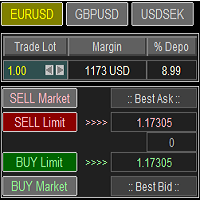
Trade Panel with Loss Breaking for MT5
Multi-instrumental trading panel with the function of transferring the stop loss of positions to loss breaking.
Has the following distinctive properties:
All trading parameters and panel operation are set in the settings. The traded position volume (lot size) is quickly changed. The required margin and the percentage of the required margin of the current deposit for the specified lot size are displayed. Shows profit when take profit is triggered and lo

Sprocket is an Expert Advisor that implements the scalping principle. A minimum spread is required for correct operation. What is a prerequisite.
There is an opinion that scalping is the lot of beginners. But in fact, it is wrong. In order to conduct a trading operation correctly for himself, a trader needs to learn scalping, otherwise the result may be negative. That is why this bot exists to be an assistant to the trader.
By placing currency fluctuations on time charts with timeframes for
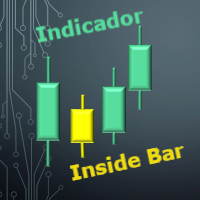
Identificador de Inside Bar O Inside Bar é uma formação de vela de reversão / continuação, e é um dos padrões de Candle mais operados pelos trader. Esse indicador permite que você identifique um O Inside Bar no gráfico de forma rápida e fácil, lhe permitindo uma tomada de decisão muito rápida e precisa. Sendo ideal para lhe ajudar nas suas diversas estratégias de Day Trade ou swing trade. O visual e a marca registrada da análise gráfica por esse motivo esse indicador conta com 3 opções visuais p

Santa Bollinger Indicator is an efficient way to detect price retracement in any market. A common approach is to identify overbought or oversold market conditions. When the price of the asset breaks below the lower band of the Bollinger Bands, prices have perhaps fallen too much and are due to bounce. On the other hand, when price breaks above the upper band, the market is perhaps overbought and due for a pullback . Advantages Generates instant buy and sell signals. Never repaints, never back
FREE

Less is more. Find the strongest trends! This expert scans ALL currency pairs for a strong trend combined with a breakout.
Requirements for a trend report: 1. Up-trend or down-trend must be found in all of the following timeframes (D, H4, H1, M30) 2. Breakout in the daily timeframe (the upper or lower band of the Bollinger band must be broken)
The correctness of the trend is confirmed to 90%
FREE

Santa Donchian Indicator is an efficient way to detect support, resistence and break outs in any market.
The Donchian channel measures the high and the low of a previously defined range. Typically, a trader would look for a well-defined range and then wait for the price to break out to either one side for a trade entry trigger. Advantages Never repaints, never backpaints, never recalculates. Works in all symbols and all timeframes. Perfect trend filter for any strategy or expert advisor. Fu
FREE
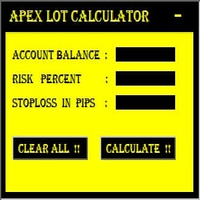
MT5 It Calculates Lot size for Manual Money Management.
If you want any custom feature or want to remove something from this product for your personal use. Please send me a personal message, I'll be happy to do so for you.
Inputs : Account Balance Risk Percent StopLoss in Pips
How to Use it : Put it on the Chart of Currency Pair which wanted to be Calculated Fill up All three Input fields with Desired Details After filling input
FREE
Reversal candles indicator , use in second window with rsi,levels 10-20-50-80-90 so u can see where the reversal candles pop upat the overbought oversold rsi levels.Great oppertunity to get in early and get out at the best moment. Candle turns blue at the 10-20 level "buy" candle turns red at the 90-80 level "sell" Always look at the major trend beore taking a buy or sell!!!

This EA uses the following Built-in indicators: Channels indicator Supply and demand indicator Trend indicator It is based on multi-directional grid system, not the normal martingale you are familiar with. When the price is in supply or demand zones, the EA will wait for a confirmation before entering a position. The confirmation is through the three above indicators together. You don't need to purchase any of the indicators mentioned above if you don't want to see them on the live chart.
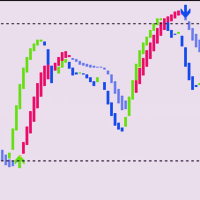
Necessary for traders: tools and indicators Waves automatically calculate indicators, channel trend trading Perfect trend-wave automatic calculation channel calculation , MT4 Perfect trend-wave automatic calculation channel calculation , MT5 Local Trading copying Easy And Fast Copy , MT4 Easy And Fast Copy , MT5 Local Trading copying For DEMO Easy And Fast Copy , MT4 DEMO Easy And Fast Copy , MT5 DEMO
Auxiliary indicators It waits for the hunt, waits for the price limit to appear, waits for

INTRODUCTION KMBC Trader EA is based on 4 famous indicators that can help you get an annual profit of over 90% in the last 14 years. Focusing on long-term trading strategies may potentially help your account growing year by year.
INDICATORS The 4 famous indicator is: Keltner Channel Moving Average Bollinger Bands Cumulative Sum
FEATURES Built-in trade management Indicator parameter customization
HOW TO SET UP Symbol: EURUSD ( specialize in EURUSD) Timeframe: D 1 Lot: Amount for a new

Moving Wizard indicator will guide you to work with Trend and give pure Entry point depending on crossing on the chart it work on all currency and all Timeframe you can use it daily or scalping or swing its good with all and This indicator you can make it your strategy i work on it on H1 Timframe and make a good money you can take alook on it and you see a great resault on chart .Gold moving is to Know the Trend of price other moving below it mean we looking to sell orders . if above it we loo
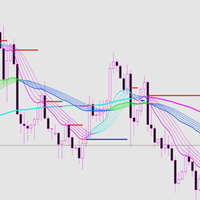
This indicator has good trend malleability and a good trend resistance support line. Index characteristics The color changes, following the trend of different levels . The support and resistance line means that the price follows or reverses.
Basic display A price tag showing historical support and resistance. Shows the approximate recommended range of historical entry positions, as well as take-profit and stop-loss recommendations, and target forecasts. Display the judgment of the current dire
MetaTraderマーケットは、履歴データを使ったテストと最適化のための無料のデモ自動売買ロボットをダウンロードできる唯一のストアです。
アプリ概要と他のカスタマーからのレビューをご覧になり、ターミナルにダウンロードし、購入する前に自動売買ロボットをテストしてください。完全に無料でアプリをテストできるのはMetaTraderマーケットだけです。
取引の機会を逃しています。
- 無料取引アプリ
- 8千を超えるシグナルをコピー
- 金融ニュースで金融マーケットを探索
新規登録
ログイン