YouTubeにあるマーケットチュートリアルビデオをご覧ください
ロボットや指標を購入する
仮想ホスティングで
EAを実行
EAを実行
ロボットや指標を購入前にテストする
マーケットで収入を得る
販売のためにプロダクトをプレゼンテーションする方法
MetaTrader 5のための無料のエキスパートアドバイザーとインディケータ - 5

Introduce: This Expert Advisor Is Hedging Style Buy or Sell Market Then Pending Buy with Hedge Distance Your Setup at begin if Sell site, Sell Pending if Buy Site. I recommend you if you want to use hedge robot please ask your broker first if they allow to use hedge trading so then you can use this robot. My default setup for XAUUSD,M15,1000usd Balance if you guys need to run with forex currency pairs just backtest seeking a best setup for each pairs because pips point are not the same each ot
FREE

What is MACD?
MACD is an acronym for Moving Average Convergence Divergence .
This technical indicator is a tool that’s used to identify moving averages that are indicating a new trend, whether it’s bullish or bearish.
There is a common misconception when it comes to the lines of the MACD.
There are two lines:
The " MACD Line " The " Signal Line "
The two lines that are drawn are NOT moving averages of the price.
The MACD Line is the difference (or distance) between two moving
FREE

When prices breakout resistance levels are combined with momentum oscillator breaks out its historical resistance levels then probability emerges to record farther higher prices. It's strongly encouraged to confirm price breakout with oscillator breakout since they have comparable effects to price breaking support and resistance levels; surely, short trades will have the same perception. Concept is based on find swing levels which based on number of bars by each side to confirm peak or trough
FREE
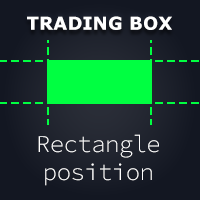
Rectangle position changer tool is used for precise/accurate rectangle positioning by time or price only. You can move each side of rectangle separately with lines created around selected rectangle. This tool will replace classical grid because it is like dynamical chart grid for rectangle grid. This tool allows you to adjust your rectangles, from all 4 sides, with ease and makes your technical analysis that much faster. This tool is handy when corner points for changing rectangle position a
FREE

ピン バー ディテクターは、チャート上のピン バーの価格行動パターンを見つけるインジケーターです。ピン バーは、「ピノキオ バー」のショートカットです。これは、ドラゴン フライ童子、墓石童子、ハンマー、倒立ハンマー、ハンギング マン、シューティング スターなど、上部または下部に高い影と非常に小さなボディを持つ、日本のローソク足に代わる古典的なバー パターンです。 .
期間限定オファー : インジケーターは、わずか 50 $ で生涯ご利用いただけます。 ( 元の価格 125$ )
主な機能 強気のピンバー検出器。 弱気ピンバー検出器. 100% 無料インジケーター。 すべての時間枠で作業します。 すべてのペアで作業します。
コンタクト 質問がある場合、またはサポートが必要な場合は、プライベート メッセージでご連絡ください。
警告 すべてのインジケーターとツールは、公式のメタトレーダー ストア (MQL5 マーケット) からのみ入手できます。
プレミアム指標 MQL5 プロファイルにアクセスすると、すべての無料およびプレミアム インジケーターを見つけることがで
FREE

Fair Value Gap Sweep is a unique and powerful indicator that draws fair value gaps on your chart and alerts you when a gap has been swept by the price. A fair value gap is a price gap that occurs when the market opens at a different level than the previous close, creating an imbalance between buyers and sellers. A gap sweep is when the price moves back to fill the gap, indicating a change in market sentiment and a potential trading opportunity.
Fair Value Gap Sweep indicator has the following
FREE

This indicator shows the TLH and TLL and some trendlines that allow us to estimate the trend of market. It also shows the values of the angles of the lines in percentage in points (pip) , the standard deviation, and the trend of each line, and when it breaks the lines of support and resistance (TLH and TLL). And finally, it also shows the points identified as supports and resistances through the fractal algorithm in the graph. The high and low trend lines are supported by the highs and lows, th
FREE

Moving Average Trend Alert is a triple MA indicator that helps traders to identify potential market trends based on 3 MAs alignment and crossover.
Moving Average Trend Alert features: Customizable short-term, medium-term, and long-term MAs. Option to filter signals based on a minimum distance between moving averages to avoid premature MAs alignment. Optional Filter of signals with RSI indicator overbought/oversold levels. Optional Filter of signals with ADX indicator. Popup, email, and phone n
FREE

ARCA bot - a full-featured, non-syndicated, automated system that uses a time-tested grid strategy adapted to modern conditions. This methodology has appeared since the inception of the financial markets and is still used by many professional traders and hedge funds, as it has shown good results for decades. The expert is fully automated and must be on 24 hours a day to work, so we recommend to use VPS-server, which will provide uninterrupted work of the expert.
Characteristics: Platform: MT
FREE

Peak Trough Analysis is the great tool to detect peaks and troughs in your chart. Peak Trough Analysis tool can use three different peaks and troughs detection algorithm. The three algorithm include the orignal Fractals Indicator by Bill Williams, the Modified Fractals indicator and ZigZag indicator. You can use this peak and trough analysis tool to detect the price pattern made up from Equilibrium Fractal-Wave process. For further usage, there are good guide line on how to use this peak trough
FREE

Fractals Dynamic Fractals Dynamic – これで、フラクタルダイナミックインジケーターに基づく、またはそれに基づくすべての取引戦略に追加のシグナルが表示されます。 さらに、フラクタルはサポートレベルと抵抗レベルとして機能することができます。 そして、いくつかの取引戦略では、流動性レベルを示しています。 この目的のために、このバージョンのマルチフラクタルおよびマルチフレームインジケータ MultiFractal Levels でレベルが導入されました。 あなたは、この指標は、より有益な視覚的かつ任意の価格チャート上のあなたの取引のアシスタントとして有用であることがわかります。 あなたの取引システムへの追加として Fractals Dynamic 指標を使用してください
また、市場で私の他の製品を試してみてください https://www.mql5.com/ru/users/capitalplus/seller
取引であなたのための大きな利益!
FREE

this is a highly profitable semi-auto grid strategy.
MT4 Version
======== Usage======== :
Symbol: Any Main pairs Timeframe: H1 or higher Recommend Lots: 0.01 per 1000 USD
Note: Grid strategy is alwasy with some risk due to the increasely accumulated risk lots. but the high profit makes such strategy still being popular no matter how forex industry developed.
semi-auto trading should be the best way to equilibrate profit and risk. this EA has integrated many useful options for user t
FREE

A professional tool for trading - the divergence indicator between the RSI and the price, which allows you to receive a signal about a trend reversal in a timely manner or catch price pullback movements (depending on the settings). The indicator settings allow you to adjust the strength of the divergence due to the angle of the RSI peaks and the percentage change in price, which makes it possible to fine-tune the signal strength. The indicator code is optimized and is tested very quickly as par
FREE

Synthetic indeces are one of a kind of forex markets. Specially, on boom and crash indices on M1 timeframe is really interesting. I always thought that it was impossible to catch spikes safely until today. Everything has it's limits. This EA is based on martingale strategy with low drawdown. Max grid level is 3. When each trades goes on drawdown, the next trade will be multiplied by 2. The EA does not use take-profit or stoploss . So the backtesting will show the same results as real-time tradi
FREE

Buy Sell Signal Low TF gives buy/sell signals and alerts with up and down arrow at potential reversal of a pullback or a trend continuation pattern in low timeframe. This is an indicator which gives signals based on trend => It works best in trend market with the principle is to ride on the trend not trade against the trend.
The components of Buy Sell Signal Low TF: - The trend is determined by SMMA 13 , SMMA 21 and SMMA 35 ( can be changed manually to suit your preference). - The signal is
FREE
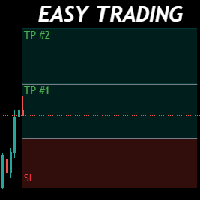
Money Management will help you to Easy Trade with One Click , instance and pending, set SL, and manage the number of your TP . You can use this expert for different currency pairs, CFDs, cryptocurrency, and stocks .
The basic formula for calculating pip value and position size , which has been used in this expert, are:
Pipette Value = Position Size * (Exchange Rate (Base Currency) / Entry Price) * Contract Size * Digits Exp. Account Currency: USD Currency Pair: GBPJPY Position
FREE

SUPERTREND; It is a trend following indicator based on the SuperTrend ATR created by Olivier Seban. It can be used to detect changes in trend direction and locate stops. When the price falls below the indicator curve, it turns red and indicates a downtrend. Conversely, when the price moves above the curve, the indicator turns green, indicating an uptrend. Like other indicators, it works well on SuperTrend when used in conjunction with other indicators such as MACD, parabolik SAR, Bollinger Band
FREE

AW スーパー トレンド - これは、最も人気のある古典的なトレンド インジケーターの 1 つです。シンプルな設定で、トレンドだけでなく、このインジケーターによって計算されるストップロスレベルも表示できます。 利点:
楽器: 通貨ペア 、株、商品、指数、暗号通貨。 時間枠: М15 以上。 取引時間:24時間。 現在のトレンドの方向を示します。 ストップロスを計算します。 取引を行うときに使用できます。 3 種類の通知: プッシュ、メール、アラート。 MT4版 -> HERE / ニュース - HERE 機能:
インジケーターは、現在のトレンド方向を対応する色で表示します。
- 青色は、現在の時間枠で使用されているシンボルの上昇トレンドを示します。
- 線の赤い色は、選択したシンボルで使用された時間枠の下降トレンドを示します。
インディケータはストップロスを設定するために使用できます。
指標線はバーの上ではなく、バーに対していくらかシフトして表示されます。トレンド ラインが表示されるこの場所は、トレーダーがストップ ロスを設定するために使用で
FREE

This indicator displays pivot points in the chart, including historical vales, and supports many calculation modes for Pivot Points and S/R levels. [ Installation Guide | Update Guide | Troubleshooting | FAQ | All Products ] It plots historical levels for backtesting purposes
It allows you to select the reference timeframe It implements different Pivot Point calculation modes It implements different SR calculation modes
It implements customizable colors and sizes
Calculation Modes The indi
FREE

This is Heiken Ashi smoothed version, where you can choose on what type smoothness you want to make your strategy base. You can choose between EMA or MA, on the period you want. And you can choose colors.
Definition:
The Heikin-Ashi technique averages price data to create a Japanese candlestick chart that filters out market noise. Heikin-Ashi charts, developed by Munehisa Homma in the 1700s, share some characteristics with standard candlestick charts but differ based on the values used to
FREE

The indicator plots a trend channel using the technique by Gilbert Raff. The channel axis is a first-order regression. The upper and lower lines show the maximum distance the Close line had moved away from the axis line. Therefore, the upper and lower lines can be considered as resistance and support lines, respectively. A similar version of the indicator for the MT4 terminal
As a rule, most movements of the price occur within a channel, going beyond the support or resistance line only for a s
FREE

ケルトナーチャネルブレイクアウト戦略: Metatrader 5プラットフォーム向けに開発された取引ロボットは、ケルトナーチャネルブレイクアウト戦略を使用して自動的に動作するように設計されています。この戦略は、ケルトナーチャネルによって定義される市場のボラティリティに基づいてエントリーポイントとエグジットポイントを特定することを含みます。 主な機能: ケルトナーチャネルブレイクアウト : ロボットは、価格がケルトナーチャネルを突破する時点を特定し、買いポジションまたは売りポジションの機会を示します。 取引時間パラメーター : ロボットが操作を許可される特定の取引時間を設定することが可能です。これにより、異なる市場セッションに戦略を適応させ、流動性が低いまたはボラティリティが高い時点での取引を回避することができます。 日次利益または損失目標 : ロボットは日次の利益または損失目標を設定することができます。目標が達成されると、ロボットは市場へのさらなる露出を回避するために取引を終了することができます。 平均価格システム : 市場の逆行動が発生した場合、ロボットは取引のエントリー価格を改善す
FREE

Probability emerges to record higher prices when RVi breaks out oscillator historical resistance level. It's strongly encouraged to confirm price breakout with oscillator breakout since they have comparable effects to price breaking support and resistance levels; surely, short trades will have the same perception. As advantage, a lot of times oscillator breakout precedes price breakout as early alert to upcoming event as illustrated by last screenshot. Furthermore, divergence is confirmed in
FREE

The RenkoChart tool presents an innovative and highly flexible approach to visualizing market data in MetaTrader 5. This expert creates a custom symbol with Renko bricks directly on the chart, displaying accurate prices at the respective opening date/time for each brick. This feature makes it possible to apply any indicator to the Renko chart. Furthermore, this tool also allows access to historical brick data through native methods in the MQL5 programming language, such as iOpen, iHigh, iLow and
FREE

中央ピボット範囲レベルは、中央ピボットポイントの周囲に形成されます。
中央ピボットに関連するこれらのレベルは、多数の市場行動と考えられる結果を決定するために使用できます。
中央ピボットからの距離、および前日のレベルと比較して新しいレベルが形成する価格を使用して、次の日のトレンドの方向と強さを決定できます。
セントラルピボットレンジはサポートとレジスタンスとして機能し、ストップロスを置く場所のガイドを提供し、価格の継続的な動き/ブレイクアウトのシグナルを提供します。 グループチャット: https://www.mql5.com/en/users/conorstephenson セットアップのアドバイスと無料のエキスパートアドバイザーについては、購入後に私に連絡してください! 主な機能 追加のピボットポイントとフィボナッチレベルを備えた中央ピボット範囲フォーカスインジケーター。 ピボットポイントを描画します-R1、R2、R3、S1、S2、S3。 フィボナッチレベル-0、0.23、0.38、0.50、0.61、0.78、1を描画します。 アラート機能。 -MT4モバイルアプリを
FREE

The Expert Advisor is only designed for manual trading. The EA sets stop loss and take profit for positions and pending orders on the current symbol. It also has trailing stop and breakeven functions.
Input Parameters Stop loss - stop loss value; Take profit - take profit value; Close all if profit reached the x percent of balance or - close all positions once the total profit reaches x percent of balance; close all if profit reached the x profit amount in currency - close all position
FREE
This utility tool shows the ticker symbol, timeframe, and description information as a watermark on the chart. Text resizes automatically according to chart size. It is useful to identify the correct chart when multiple charts are shown on the screen. Want more control over text apperance? Check out our Chart Watermark MT5 Premium utility. See the demonstration video below!
Inputs: Font Size: Initial font size for the ticker symbol and timeframe text (Default; 50). Description text font siz
FREE

Necessary for traders: tools and indicators Waves automatically calculate indicators, channel trend trading Perfect trend-wave automatic calculation channel calculation , MT4 Perfect trend-wave automatic calculation channel calculation , MT5 Local Trading copying Easy And Fast Copy , MT4 Easy And Fast Copy , MT5 Local Trading copying For DEMO Easy And Fast Copy , MT4 DEMO Easy And Fast Copy , MT5 DEMO 高度なボリンジャーバンド:
1.ボリンジャーレールは方向によって色が変わります」
2.ボリンジャーアウターレールの伸縮はアウターレールの色の変化でマークされます。」 3.ボリンジャ
FREE

Trading Keys is an advanced and easy to use risk calclator. Features: Drag and drop visual lines to take profit/stop loss/ entry levels. Risk calculation based on account balance / quity percentage per trade. Profit protection and trailing toggle button Auto break even toggle button Risk calculation for prop firms based on drawdown level How to setup your Trading Keys? Add trading keys to your chart Setup the parameters Save the chart as default template "Default.tpl" How to use Trading keys? Cl
FREE
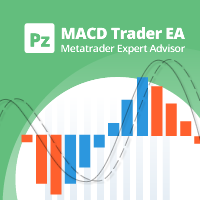
This EA is a flexible and powerful metatrader expert advisor that trades using the MACD indicator and implements many useful features. It can trade using the MACD indicator alone, or donchian breakouts confirmed by the MACD indicator from any timeframe. Additionally, it offers a martingale feature and forex session filters. [ Installation Guide | Update Guide | Troubleshooting | FAQ | All Products ] Easy to use and supervise Fully configurable settings Customizable break-even, SL, TP and traili
FREE

Structure Blocks: a structured way to analyze market structure
This indicator is for you if you are a price action or smart money concept trader. It identifies market trends' ultimate highs and lows and intermediaries' swing lows and highs. It adjusts based on candles' body where most of the volume is, disregarding wicks. Need help or have questions? I am Lio , don't hesitate to reach out! I am always available to respond, help, and improve. How it works:
Each block consists of a move wit
FREE

Lorentzian A.I Indicator System Revolutionize your trading strategy with the Lorentzian A.I Indicator System, an advanced tool designed for traders who demand precision and adaptability. Whether you're trading Crypto, Indices, Forex, or Stocks, this state-of-the-art indicator uses cutting-edge technology to keep you ahead of the market. Key Features: Advanced Lorentzian Classification (LC): Utilize sophisticated LC algorithms to generate precise buy and sell signals, ensuring you make informed
FREE

The XU_30_913073101_S_HH_CF_SQX is an algorithmic trading strategy for MetaTrader, tested on XAUUSD (Gold) using the M30 timeframe from April 1, 2004, to April 24, 2024. There is no need to set up parameters, all settings are already optimized and fine-tuned.
Recommended broker RoboForex because of EET timezone.
You can find the strategy source code for StrategyQuant at the link: http://quantmonitor.net/listing/gold-emperor/
Key details are:
Parameters
MagicNumber: 913073101
Main
FREE
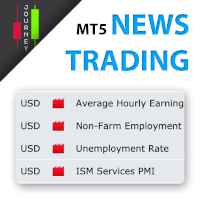
Trading has never been easier! Let's check this out! MT4 version: https://www.mql5.com/en/market/product/72153 Strategy There are some news within a day that can make the price jumps up or down very quickly and that is a good opportunity for traders to get some profits. Looking to scalp a news release? Here's how you can do it: Open two stop orders (a buy stop and a sell stop) 3 to 5 minutes before the news release. Place them about 15 to 20 pips away from the current market price. When the ne
FREE

BEHOLD!!!
One of the best Breakout Indicator of all time is here. Multi Breakout Pattern looks at the preceding candles and timeframes to help you recognize the breakouts in real time.
The In-built function of supply and demand can help you evaluate your take profits and Stop losses
SEE THE SCREENSHOTS TO WITNESS SOME OF THE BEST BREAKOUTS
INPUTS
MaxBarsback: The max bars to look back
Slow length 1: Period lookback
Slow length 2: Period lookback
Slow length 3: Period lo
FREE

the AK CAP toolbox free to use;
it includes the same indicators we use for our daily trading and we think the simpler the better. Lightweight indicator for use on all timeframes. that includes VWAP with vwap value indicator on top right. 3 EMA: FAST, MEDIUM, SLOW the candle timer to show how much time left in a candle.
colors and positions are fully customizable.
enjoy
FREE

Are you tired of drawing Support & Resistance levels for your Quotes? Are you learning how to spot Support & Resistances? No matter what is your case, Auto Support & Resistances will draw those levels for you! AND, it can draw them from other timeframes, right into you current chart, no matter what timeframe you are using... You can also Agglutinate regions/zones that are too much closer to each other and turning them into one single Support & Resistance Level. All configurable.
SETTINGS
Time
FREE

Custom Spread Indicator *Please write a review, thanks!
Also MT4 version is available
Spread Indicator show the current spread in pips with color codes. Handle 3 levels, Low, Medium, High. You can set levels and colors for each level (eg. Low: Green, Medium: Orange, High: Red), and can choose display position on the chart.
There is two spread calculation mode: -> Server spread value -> Ask - Bid value
Can set opacity, for better customization. When spread jump bigger, then display do
FREE

TradeInfo is a utility indicator which displays the most important information of the current account and position.
Displayed information: Information about the current account (Balance, Equity, Free Margin). Current spread, current drawdown (DD), planned profit, expected losses, etc. Number of open position(s), volume (LOT), profit. Today’s and yesterday’s range. Remaining time to the next candle. Last day profit information. MagicNumber filter. Comment filter.
Indicator parameters: Show
FREE

Free automatic Fibonacci is an indicator that automatically plots a Fibonacci retracement based on the number of bars you select on the BarsToScan setting in the indicator. The Fibonacci is automatically updated in real time as new highest and lowest values appears amongst the selected bars. You can select which level values to be displayed in the indicator settings. You can also select the color of the levels thus enabling the trader to be able to attach the indicator several times with differe
FREE

ChartWall is intended for displaying and automatic changing of wallpapers on a chart. It supports JPG and BMP formats. A file and a display style are selected via the built-in panel, which can be opened by clicking on the application icon (hidden button) that appears in the bottom left corner of the chart (main window) as you move the cursor to that area. Using the built-in panel you can also set a period for the rotation of images in minutes. Image files are selected randomly from the folder t
FREE
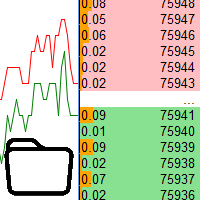
Using data from the order book in the strategy tester Key features: Simultaneous use of several symbols, up to 7 pieces DOM visualization With the visualization of order books, real-time simulation is available, as well as acceleration or deceleration Working with the library: This product also requires a utility to save data: https://www.mql5.com/en/market/product/71642 Speed control utility: https://www.mql5.com/en/market/product/81409 Include file: https://c.mql5.com/31/735/Market_book_s
FREE

The famous brazilian trader and analyst Didi Aguiar created years ago a study with the crossing of 3 Simple Moving Averages called "Agulhada do Didi", then later was also named Didi Index, as a separate indicator. The period of those SMAs are 3, 8 and 20. As simple as that, this approach and vision bring an easy analysis of market momentum and trend reversal to those traders looking for objective (and visual) information on their charts. Of course, as always, no indicator alone could be used wit
FREE

2016年(05月)のICTのプライベートメンターシップコース(YouTubeで共有)からインスピレーションを受け、当社の革新的なツールは、トレーダーが市場を精密に航行することを可能にします。 60、40、20日の期間をマークすることで、市場の重要な動きを特定し、ICTの教えから得られた知識を活用します。 このインジケーターの真の特徴は、将来の市場動向に関する貴重な洞察を提供する前方キャスティング機能であり、これは入念な歴史データの分析に基づいています。 この先行的なアプローチにより、トレーダーは情報を元にした決定を行うための洞察力を備え、今日のダイナミックなトレーディング環境で明確な優位性を提供します。 さらに、当社のインジケーターはカスタマイズオプションを提供し、トレーダーがそれを自分の好みや特定のトレーディング戦略に合わせて調整できるようにします。 このレベルの適応性により、トレーダーは自信を持って市場のトレンドを予測し、ICTの教えを活用して先を見据え、利益を生む機会を活かすことができます。 当社のインジケーターで予測とカスタマイズの力を体験し、トレーディングスキルを向上させ、
FREE

Advanced Market Analysis Tool : Dive into market depth with the MT5 Volume Profile Indicator. Seamless MT5 Integration : Perfectly compatible with the MT5 platform. Enhances Pro Thunder v9 : Integrates smoothly with Pro Thunder v9 for deeper market insights. Detailed Volume Analysis : Explore market dynamics through in-depth volume data. ️ Simple Installation : Easy-to-follow setup steps for quick integration with MT5. Efficient Single Chart Application : Best used on a single c
FREE

The Expert Advisor for this Indicator can be found here: https://www.mql5.com/en/market/product/115567 The Contraction/Expansion Breakout Lines with Fair Value Gaps (FVGs) Indicator for MetaTrader 5 (MT5) is a powerful technical analysis tool designed to help traders identify and visualize breakouts at critical levels of contraction and expansion in financial markets. By incorporating Fair Value Gaps (FVGs), this indicator enhances traders' ability to gauge market sentiment and anticipate poten
FREE

For a more refined algorithm capable of detecting highs and lows everyday, opt for : Ice Scalper Pro!!! : https://www.mql5.com/en/market/product/93215 MT4 Version : https://www.mql5.com/en/market/product/94060
Check my other products here : Pivot Points Master : https://www.mql5.com/en/market/product/95744 Pivot Points Master MT4 Version : https://www.mql5.com/en/market/product/95981
Check my other products here :
Ice Scalper is a fully automated scalping robot that uses a highly ef
FREE

This indicator draw a line on high and low levels of X number of days. It is possible to have an alert (in the software and mobile app) for when the price breaks the high or low of the current day. Configurações: Days - past days to calculate (1 = actual day only).
Alert when reach levels - activate the alert for specific levels or both.
Push notification - enable the alert to the mobile MT5 app.
Appearance
High - high level color.
Low - low level color.
Size actual day - thi
FREE

「BIG FIGURE INDICATOR」は、価格チャート上で整数や半分の数字(たとえば、通貨取引での1.0000や1.5000など)など特定のレベルで自動的に水平線を識別して描画します。これらのレベルは心理的に重要であると考えられており、大口トレーダーや投資家が注目する可能性がある丸められた数字を表しており、潜在的なサポートまたはレジスタンスレベルにつながります。ビッグフィギュアインジケーターは、トレーダーが重要な価格レベルを特定し、これらのレベルに基づいて取引決定を行うのに役立ちます。 ラインはM1からH8のタイムフレームチャートにのみ表示されます。 ラインの色は入力パラメータタブで変更できます。 すべての通貨ペアで使用できます。 MT4バージョン: https://www.mql5.com/fr/market/product/96747 注意:当社のインジケーターを最適に機能させるには、まずデイリー(D1)タイムフレームを読み込む必要があります
FREE

Descrição do Produto O produto é um Expert Advisor (EA) para MetaTrader 5, projetado para operar no par de moedas XAUUSD (Ouro) no timeframe M15. Ele utiliza uma combinação de 15 indicadores para tomar decisões de entrada e saída de trades. As principais características incluem: Lotes de entrada : 0.01 Número mágico base : 100 Máximo de posições abertas : 100 Spread máximo permitido : 0 pontos Equity mínima : 0 (sem limite) Perda máxima diária : 0 (sem limite) Parâmetros de Reentradas (Contrária
FREE

Trade the Ichimoku Kinko Hyo Indicator with complete freedom using a powerful and flexible EA. It implements many entry strategies and useful features, like customizable trading sessions and a martingale mode. [ Installation Guide | Update Guide | Troubleshooting | FAQ | All Products ] Easy to use and supervise It implements several entry conditions Customizable break-even, SL, TP and trailing-stop settings Works for ECN/Non-ECN brokers Works for 2-3-4-5 digit symbols Implements a martingale fea
FREE
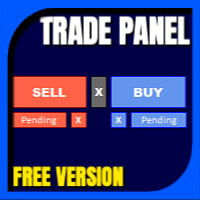
Have you missed any tools or shortcuts in Meta Trader? Simple things that would make your daily trading much easier ?
We have the solution for you: our Trade Panel!
This is an EA tool (Expert Advisor) that, if configured to controll all symbols, needs to be loaded only once.
This is the Lite version (free) of our tool. Professional version: https://www.mql5.com/en/market/product/42658 If you have some problemas with the shortcut buttons on chart on unpinned mode try change the tickets d
FREE

INTRODUCTION : The breakout strength meter is a trading tool that is used to identify which currencies are the strongest to breakout, and which currencies are the weakest to breakout. The settings for the indicator are easy, and if you cannot find the settings, please leave a comment The tools are completely free to use Please, if you like the indicator, please leave a comment and rate the indicator in order to develop it
FREE

The " YK Find Support And Resistance " indicator is a technical analysis tool used to identify key support and resistance levels on a price chart. Its features and functions are as follows:
1. Displays support and resistance levels using arrow lines and colored bands, with resistance in red and support in green.
2. Can be adjusted to calculate and display results from a specified timeframe using the forced_tf variable. If set to 0, it will use the current timeframe of the chart.
3. Uses
FREE

インジケーターは現在のシンボルの利益(損失)を表示します。 線を自由にドラッグ&ドロップして現在の損益を表示できます。
パラメーター
Calculation in money or in points — 損益をポイントまたは金額で計算します。 Add pending orders to calculate — 計算では未決注文を考慮します。 Magic Number (0 - all orders on symbol) — 特定の注文を評価する必要がある場合のマジック ナンバー。 Offset for first drawing (points from the average price) — 最初の開始時の平均価格からのラインのオフセット。 Decimal places for calculating the Sum — 合計を表示するための小数点以下の桁数。 Decimal places for calculating the Percentage — パーセンテージを表示するための小数点以下の桁数。
Tuning チューニング Color of the
FREE

The Hull Moving Average is not very well know in novice and maybe in intermediate trading circles, but it is a very nice solution created by the trader Alan Hull - please visit www.AlanHull.com for full details of his creation. The purpose of this moving average is to solve both problems that all famouse and common moving averages have: Lag and Choppiness . The implementation we did has, apart of the Period configuration and Price type to use in the calculations, a "velocity" factor, which could
FREE
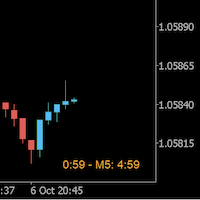
Always wanted to know when the M5 candle closes when you are in M1 ? This indicator allow to display a candle timer (countdown) on the current time frame as well as any higher time frame you have configured for this time frame. So this is easy now to see when the H4 candle closes when you are in H1.
Congifuration Label position, size, color HFT time frame per time frame Any questions or comments, send me a direct message here https://www.mql5.com/en/users/mvonline
FREE

MT5のチャートシンボルチェンジャーは、パネルのシンボルボタンをクリックするだけでアタッチされている現在のチャートシンボルを変更するオプションを提供するインジケーター/ユーティリティです。 MT5のチャートシンボルチェンジャーは、あなたが注目して最もトレードしたいペアを追加することにより、あなたの個人的な好みに合わせて32のシンボルボタンを設定するオプションを提供します。このようにすると、数回クリックするだけでチャート上で市場をより速く表示できるため、チャンスを逃すことはありません。
MT5インストール/ユーザーガイド用チャートシンボルチェンジャー | 購入した製品の更新
特徴 パネル上の32のカスタマイズ可能なシンボル。これにより、同じチャートでお気に入りの機器を監視できます。 あらゆるシンボル/金融商品、口座タイプ、ブローカーでスムーズに機能します
MT5のチャートシンボルチェンジャーは、トレードとリスク管理、および一般的な手動トレードを支援するために、トレードパネルの形式でも提供されます。 手動トレードパネルMT5: https
FREE

The TrendFusion trading robot is designed to operate on the GBP/JPY currency pair. Optimized for an H4 (4-hour) trading timeframe, it offers a strategic approach for traders aiming to combine precision with adaptability in their trading. TrendFusion has demonstrated a high accuracy rate in past performance, making it a reliable choice for traders. Technical Indicators Used Bull and Bear Trend Analysis : TrendFusion analyzes both bullish and bearish trends to identify potential trading opportunit
FREE

Indicator determines the direction of price movement, calculates the possibility of entering the market using an internal formula and displays a breakout entry signal. Indicator signals appear both at the beginning of trend movements and in the opposite direction, which allows you to open and close orders as efficiently as possible in any of the market conditions. Version for МТ4: https://www.mql5.com/en/market/product/58349
Benefits: a unique signal calculation formula; high signal accuracy;
FREE

市場内で開発傾向にアラートを取得するには、この指標を使用してください。
この指標を使用すると、彼らが開発するように、市場で発展している傾向についてのアラートを取得することができるようになります。 この指標は、トレンド内のエントリまたは終了を識別するために使用できます。 この指標は、より高い時間枠からの情報と、現在の時間枠の価格の動きを組み合わせて、買いまたは売りの信号を出力します。 指標は、傾向の変化、または支配的な傾向の継続を識別することができます。
注:トレンドフォローは低い勝率を持っていますが、トレンドのリターンは平均損失の3-5倍の大きさにすることができます。 簡単なセットアップ 任意の時間枠で、任意のグラフにドラッグアンドドロップします。 アラートを有効にする(オプション) そして、あなたは完了です! 視覚的および音声的な警告 お使いの携帯電話に直接送信されるアラート お使いの端末に送信されたアラートをポップアッ マルチユース 株,外国為替,オプション,先物 柔軟性 任意の時間枠で動作します
FREE

自動アンカードVWAPでトレーディングの洞察を解き放つ: 自動アンカードVWAP は、トレーディングの世界でのあなたのガイドとなります。これらの指標は、重要な市場の転換ポイントを特定し、VWAPラインを使用してチャート上に示します。これは、アンカードVWAP戦略を採用するトレーダーにとってのゲームチェンジャーです。 どのように動作するのか? 高値の特定: 現在のキャンドルの最高価格が前のキャンドルの最高価格よりも低い場合、 そして、前の高値がそれより前の高値よりも高い場合、 私たちはピークを特定しました。 この重要なポイントは、これらの三本のローソク足の中央に位置しています。 安値の認識: 現在のキャンドルの最低価格が前のキャンドルの最低価格よりも高い場合、 そして、前の低値がそれより前の低値よりも低い場合、 私たちは底を発見しました。 この底の焦点は、その中央部にあります。 アンカードVWAPのプロット: 各トップとボトムには、対応するVWAPラインがあります。ただし、制約があります:指標の計算要求により、チャート上に同時に表示できるラインは8本だけです。 追加のラインが現れると、古
FREE

MT4 Version MA Ribbon MT5 MA Ribbon is an enhanced indicator with 8 moving averages of increasing periods. MA Ribbon is useful to recognize trend direction, reversals and continuation points in the market as well as potential entry, partial take profit and exit points. Entry points for long and shorts position can be found when the price entries or leaves the Ribbon, at retest or a defined number of MA crossovers. It offers a good combination with mostly any volume or momentun indicators to
FREE

This is a derivative of John Carter's "TTM Squeeze" volatility indicator, as discussed in his book "Mastering the Trade" (chapter 11).
Gray dot on the midline show that the market just entered a squeeze (Bollinger Bands are with in Keltner Channel). This signifies low volatility, market preparing itself for an explosive move (up or down). Blue dot signify "Squeeze release".
Mr.Carter suggests waiting till the first blue after a gray dot, and taking a position in the direction of the mo
FREE

UPDATED The Non-Repaint zones is a time base indicator that scans for possible reversal of the market for perfect entry. It read the history and draws the possible zone for our comfort. The indicator possesses four different zones that read the history of the market over 10,000 previous bars and predict the possible entry point. It rescans every market trend change to give us the possible zone, it is used for trading all types of markets and does not repaint. The indicator has the following inp
FREE

The indicator displays the orders book, as well as increases its depth, remembering the location of orders that have gone beyond the current "window" view.
Indicator capability Display the levels of open positions. Simulation of placing/cancelling/editing pending orders directly in the displayed orders book.
Indicator features The orders book display works only on those trading symbols for which it is broadcast by the broker. To reset the information about the rows that were recorded in the
FREE

Divergence RSI Trader is based on divergences in the chart and indicator (RSI Level 14). Divergence RSI Trader's strategy to find lows and highs on the chart and RSI indicator, analyze them and then open positions. EA was tested in the EURUSD H1 in the strategy tester and adjusted to this currency by default. EA has also been tested with other settings at GBPUSD M5 for 10 years and completed with good results. Because this is a free version, there will be no more tests and only updates. Please
FREE

O indicador criado por Didi Aguiar, o mestre das Agulhadas!
O padrão do indicador é o cruzamento de três médias móveis simples. Média rápida, período 3. Média normalizada, período 8. Média lenta, período 20.
Quando as três médias se cruzam próximas o suficiente, acontece a agulhada! Pela posição das médias é possível identificar: Agulhada de compra, agulhada de venda, ponto falso e beijo da mulher aranha.
Quer saber mais? Procure pelo site dos robôs oficiais da Dojistar: tradesystembots.co
FREE

Closing Price Reversal is a very well known and traded candlestick pattern. This little indicator paints with specific (user-selected) colors the Closing Price Reveral Up and Down patterns, as well as the Inside Bars (as a bonus). Higher timeframes are more effective as with all other candlesticks patterns. Do NOT trade solely on this indicator. Search the web for "Closing Price Reversal" to learn about the several approaches that can be used with this pattern. One of them is combining short/me
FREE
Indicator that synchronizes the charts, that is, when the symbol is replaced in one of the charts, all those that appear with the synchronized indicator are changed, with the same timeframe (Same_Timeframe = true) or with different timeframes (Same_Timeframe = false). The graphics to be synchronized are identified by color (Label).
To synchronize the indicators, the indicator must be inserted in all the charts to be synchronized, using the same color (Label).
A box with the chosen color (La
FREE
MetaTraderマーケットは、他に類のない自動売買ロボットやテクニカル指標の販売場所です。
MQL5.community ユーザーメモを読んで、取引シグナルのコピー、フリーランサーによるカスタムアプリの開発、支払いシステムを経由した自動支払い、MQL5Cloud Networkなど、当社がトレーダーに対して提供するユニークなサービスについて詳しくご覧ください。
取引の機会を逃しています。
- 無料取引アプリ
- 8千を超えるシグナルをコピー
- 金融ニュースで金融マーケットを探索
新規登録
ログイン