YouTubeにあるマーケットチュートリアルビデオをご覧ください
ロボットや指標を購入する
仮想ホスティングで
EAを実行
EAを実行
ロボットや指標を購入前にテストする
マーケットで収入を得る
販売のためにプロダクトをプレゼンテーションする方法
MetaTrader 4のための有料のエキスパートアドバイザーとインディケータ - 27
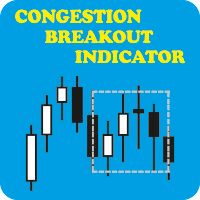
CONGESTION BREAKOUT INDICATOR: When you see a sideways price movement in a meaningless market, what goes through your mind? Is it a danger, an opportunity or completely a vacuum? Let's see if we can avoid the latter and focus on using it to our advantage. The ability to read price action through the display of rectangles on the chart could be the boost you need to achieve your trading goals. What is congestion? Congestion is a market situation where the price is trading around a particular leve

The Elder Impulse System was designed by Alexander Elder and featured in his book. According to Elder, “the system identifies inflection points where a trend speeds up or slows down”. The Impulse System is based on two indicators, a exponential moving average and the MACD-Histogram. The moving average identifies the trend, while the MACD-Histogram measures momentum. As a result, the Impulse System combines trend following and momentum to identify tradable impulses. This unique indicator combina

Firstly , the script estimates how many Mx bars of the chart (on which this script is applied) the future trend will most likely continue and what is its quality. Secondly (and most importantly), the script is an auxiliary tool for the extremely mathematically advanced and extremely effective ScientificTrade indicator in trading. The script calculates the optimal averaging period, which is also equal to Mx, of the ScientificTrade indicator, which gives the maximum profit according to the strate
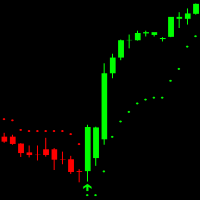
Easy Trend Indicator can be used for all forex pairs, indices and cryptocurrencies. It´s a non rapainting Trend trading indicator and works on all timeframes. GREEN candles show an uptrend and RED candles show a Downtrend. Arrows show when to enter the Market. Indicator has 7 Inputs: Max History Bars = On how many Bars in the Chart the indicator is drawn ATR Period = How many Bars are used for Average True Range calculation ATR Multiplier = Is used for Indicator sensitivity (Higher multiplier =

This indicator draws regular bullish and bearish divergences in real-time onto the charts. The algorithm to detect those divergences is based on my 10+ years experience of detecting divergences visually. The divergences are drawn as green and red rectangles on the charts. You can even do forward testing in the visual mode of the strategy tester.
Parameters Fast EMA Period: The period of the fast EMA of the MACD. Default value is 12.
Slow EMA Period: The period of the slow EMA of the MACD. Def

This indicator is designed to detect the best of all candlestick reversal patterns: Three Line Strike . According to the bestselling author and candlestick guru Thomas Bullkowski, this pattern has a winning percentage between 65% and 84% . This indicator scans for you up to 30 instruments (forex, indices or commodities) on up to 8 timeframes. You can get alerts via MetaTrader 4 and email if a Three Line Strike pattern occurs. Please note: Higher timeframes bring the most reliable signals. This i

Forex Gump is a fully finished semi-automatic trading system. In the form of arrows, signals are displayed on the screen for opening and closing deals. All you need is to follow the instructions of the indicator. When the indicator shows a blue arrow, you need to open a buy order. When the indicator shows a red arrow, you need to open a sell order. Close orders when the indicator draws a yellow cross. In order to get the most effective result, we recommend using the timeframes H1, H4, D1. There

Signal Bands is a sensitive and convenient indicator, which performs deep statistical processing of information. It allows to see on one chart (1) the price trend, (2) the clear price channel and (3) latent signs of trend change. The indicator can be used on charts of any periods, but it is especially useful for scalping due to its high sensitivity to the current market state.
The functions of the indicator : First, the Signal Bands indicator draws channels into which all price fluctuations ex

The indicator Power Strength creates a virtual display that takes data from all Symbols. It extrapolates all the informations in order to get the strength and / or weakness to take a decision on market. This tool works only on the Forex Market and not processing data on indices, metals ... It is graphically very attractive and its simplified information could give excellent input signals. You can use this indicator to find inputs on daily or short-term operations or scalping.
Input Values PANE

WaveTrend Momentum Oscillator is an upgrade to the popular and easy-to-use WaveTrend Oscillator. The WaveTrend Momentum Oscillator adds a momentum component to the original WaveTrend calculation, in order to provide faster and more accurate entry points during trendy market conditions. Do you prefer the original WaveTrend Oscillator? The WaveTrend Momentum Oscillator allows you to switch between momentum and original WT versions. Both provide valuable information depending on the market conditio
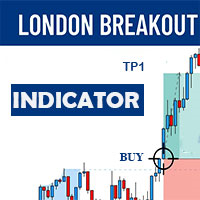
The London Breakout indicator is a technical analysis tool used in the forex market to help traders identify potential breakouts during the opening of the London trading session. This indicator is designed to help traders take advantage of the volatility and momentum that occurs during this time period, which can lead to significant price movements.
The London Breakout indicator works by identifying the range of price movement during the Asian trading session that precedes the London open, an

In statistics, Regression Channel is a approach for modelling the relationship between a scalar response (or dependent variable) and one or more explanatory variables (or independent variables).We Applied relative strength index(rsi) values to develop regression models of various degrees in order to understand relationship between Rsi and price movement. Our goal is range prediction and error reduction of Price divergence , thus we use Rsi Regression

It may be true that “Time waits for no one [human],” but at least now you can control the marching time of all your robots. EA Schedule Launcher (ESL) can launch and close any number of your EAs and/or indicators at custom beginning and ending times. You save your EA and/or indicator to a template and input when to open and close them. The power to control your EAs trading time window can improve both strategy performance and terminal/computer performance.
Note: EA cannot be run with the visu

This unique multi-currency strategy simultaneously determines the end of the trend, entry points and the expected take profit levels for each trade. The indicator can determine entry points on any trading period from M1 to D1. For the convenience of users, the indicator renders the entry point (in the form of an arrow), recommended take profit levels (Fast Take Profit, Middle Take Profit, Main Take Profit, Global Take Profit) and the Stop Loss level. The detailed guide on how to use the indicato
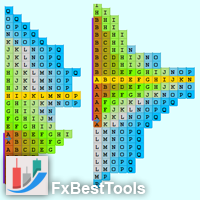
Definition : A Market Profile is an intra-day charting technique (price vertical, time/activity horizontal). Market Profile is best understood as a way to see order in the markets. Market Profile was a way for traders to get a better understanding of what was going on, without having to be on the trading floor. The current indicator is developed based on Easy-to-Use architecture including a wide range of visual settings.
Major Features of Indicator : Various Views of Market Profile The indica

Quantum Cypher: Elevate Your Trading Experience Greetings, Traders! Welcome to the world of Quantum Cypher – your ultimate trading companion designed to enhance your strategy with precision and efficiency. Let's delve into the intricacies of this powerful tool and explore how it can elevate your trading journey.
RECOMMENDED PAIR : GBP/USD; USD/JPY, EUR/USD RECOMMENDED TIMEFRAME: 5 MINUTES
Limited-time Special Opportunity:
*Promotional Price: $49 The price will increase by $100 w
MetaTrader 5 version available here : https://www.mql5.com/en/market/product/24882 FFx Basket Scanner is a global tool scanning all pairs and all timeframes over up to five indicators among the 16 available. You will clearly see which currencies to avoid trading and which ones to focus on.
Once a currency goes into an extreme zone (e.g. 20/80%), you can trade the whole basket with great confidence. Another way to use it is to look at two currencies (weak vs strong) to find the best single pair

どんなツール(シンボル)でも、グラフのどんな期間でも、買いと売りのフィボナッチレベルの自動的な作成とフォローアップ。 FiboPlus は、次のものを表示している: アップかダウン方向、 ありそうな 値動きのフィボナッチレベル。 エントリーポイントは「アップ矢印」、「ダウン矢印」アイコンで示され、情報はボタンにて再度表示されている。(SELL, BUY) 0から100までのレベルで限られた直角的エリア。トレードは、一つのレベルから他のレベルへ(トレンドなし)。
特長 値動きの予測、市場エントリーポイント、オーダーのための stop loss とtake profit。 作成済みのトレードシステム。 管理ボタンは、フィボナッチオプションの度リラかを選択できるようにする。 買いか売りのオプションを非表示にする。 グラフの他の期間を参照する。 「+」と「―」ボタンは、レベルの自動的再計算しながらグラフを大きく・小さくする。 何のフィボナッチレベルでも。 何の色でも表示。 ボタンをグラフの便利な場所に移動。
パラメーター Language (Russian, English, Deu
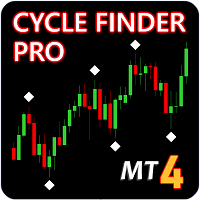
Update - Version 4.0 now includes trend change signal. Indicator will tell you the current trend on all charts. Cycle Finder Pro is a chart reading indicator and is designed for trend and pattern traders . Chart reading is time consuming and complex and requires knowledge of price action , cyclicity, and time frame correlation . Cycle Finder Pro reads all this in one simple indicator so you can spot trend and chart patterns much easier and much faster. To know if a trend exists on a chart you

The EasyTrend is a seemingly simple but quite powerful trend indicator. Everyone has probably come across indicators or Expert Advisors that contain numerous input parameters that are difficult to understand. Here you will not see dozens of input parameters, the purpose of which is only clear to the developer. Instead, an artificial neural network handles the configuration of the parameters.
Input Parameters The indicator is as simple as possible, so there are only 2 input parameters: Alert -

"The trend is your friend" is one of the best known sayings in investing, because capturing large trendy price movements can be extremely profitable. However, trading with the trend is often easier said than done, because many indicators are based on price reversals not trends. These aren't very effective at identifying trendy periods, or predicting whether trends will continue. We developed the Trendiness Index to help address this problem by indicating the strength and direction of price trend

Advanced Currency Strength Indicator
The Advanced Divergence Currency Strength Indicator. Not only it breaks down all 28 forex currency pairs and calculates the strength of individual currencies across all timeframes , but, You'll be analyzing the WHOLE forex market in 1 window (In just 1 minute) . This indicator is very powerful because it reveals the true movements of the market. It is highly recommended to analyze charts knowing the performance of individual currencies or

Godzilla EA - торговый советник, использующий скальпинг в ночное, наименее подверженное волатильности и скачкам курсов, время суток. Советник отличается новым усовершенствованным алгоритмом, небольшим количеством настроек и простотой установки. Характеристики советника: Не использует в торговле самые опасные торговые методы как мартингейл, сетку, усреднение и арбитраж; Рабочие валютные пары: AUDCAD, AUDCHF, CHFJPY, EURAUD, EURJPY, GBPAUD, GBPJPY; Минимальный депозит от 100$; Минимальный лот от

このインジケーターは、他の(および非標準)時間枠の高値/安値/始値/終値レベルを示します - 年、6 か月、4 か月、3 か月、2 か月、月、週、日、H3-H6-H8-H12 時間 。 キャンドルを開くシフトを設定し、仮想キャンドルを構築することもできます。 これらの時間枠のいずれかの「期間区切り記号」は、垂直線の形式で使用できます。 現在または以前のレベルのブレイクアウト (昨日/先週の高値/安値ラインのブレイクアウトなど) に対してアラートを設定できます。 すべてのレベルを 1 ピリオド右にシフトすることもできます。 つまり、前の期間の高値/安値が現在の期間に表示されます。
パラメーター Number of levels to calculate (0-all) — 画面に表示されるバーの数。 Change the opening of bars (hours) — ローソク足の始点を n 時間ずつシフトします。 インジケーターは、新しい開始時間を考慮して仮想バーを描画します。 MN1 より上の期間は変更されません。 Move the levels to the ri

-40% OFF
I will keep the PRICE VERY LOW so all can have this utility!!!
Join the telegram Group.
Copy Paste the following address: https://t.me/+nW-jTNrIjwM3YjJk or contact me. Or follow the link under my profile
This is just a simple copier program that ONLY allows you to locally copy transactions between different MetaTrader 4 a accounts in any direction and quantity as quickly and easily as possible .Of course it does that. This copier DOES MUCH MUCH MORE!!! PLEASE READ BELO

この完全に自動化されたFXロボットは、すぐにトレードする準備ができています。
どの時間枠でも、またアンティペアでも使用することができます。
この完全自動化されたロボットはセント口座でも動作します。
より多くのチャートで使用する場合は、毎回マジックナンバーを変更してください。
このロボットはより多くのオプションを持っています。
=> プロフィットクローズ
=> 利益を得るために
=> 逆シグナルでストップロス退場
=> 残高が増えればロットを増やす。
=> マーティンゲールオプション
=> あなたの利益を追跡する
=> あなたの利益を追跡する
ロボットを気に入ってくれた方の最大の成功を祈っています。責任を持って取引してください。
ありがとうございました。

株式(CFD)のみのデイトレード。
取引には手間がかかります。 すべてのエントリと終了を通知するショートカットやインジケータはありません。 利益は心の状態から来ます。 指標は、お金の管理と成功の心理学と組み合わせて使用されるツールです。 ボリュームプロファイルの不均衡を見つけます。 取引価格のボリュームの不均衡。
多くの不均衡は、クローズとオープンおよびニュースで発生します。 株の買い手と売り手を参照してください。 5分から1時間使用して、誰が価格を管理できるかを確認し、価格の不均衡を見つけます。 より大きな在庫は15分以上です。
カラーボリュームバーの上にマウスを置くと、過去のバーの数が表示されます。 現在のバーの音量は上隅に書かれています。
ボリュームの不均衡を見つけて、しばらくの間価格がどの方向に進むかを確認します。 最良の結果を得るために支配的な傾向に従ってください トレンドが発生した場合は、トレンドをトレードするようにしてください。 トレーリングストップを使用し、大量の反転の不均衡に注意してください。

Everyone knows that the best way to make money in the markets is by knowing the future.
Have you ever wished to know the future price of something in advance?
Even if it were just a few days, hours, or minutes ahead?
What if it were possible to know it but with less than a second of advance notice? That's precisely what the PZ Latency Arbitrage EA robot does. PZ Latency Arbitrage EA is your personal time machine: but it can only travel into the past by less than a second. The robot is like Bi

Telegram Notifier is a simple and powerful utility which sends notification, news from MT4 to Telegram channel and group. Official Telegram Group: https://t.me/ezforex_telegram_notifier WHO WILL NEED THIS UTILITY 1. EA Sellers who want to manage automatically their private channel and chat group.
2. Signal Providers who want to send the signals, reports and news to the channel or chat group. CORE FEATURES
1. Can use with View Account and not need to enable the Auto Trading button.
2. Track

VR Sync Chartsは、ウィンドウ間レイアウトを同期するためのツールです。 VR Sync Chartsではトレンドレベル、水平レベルとフィボナッチレイアウトが全チャートと同期できます。 本ソフトウェアでMetaTraderターミナルでの各種標準グラフィックオブジェクトを同期し、全てのトレンドやガーン線などを正確に隣接のチャートへコピーできます。 線とレイアウトを手動ではなく、自動的にコピーできます。以下の図とビデオでは、VR Sync Chartsの動作を評価できます。 推薦: インジケーターを全チャートにセットしてください。 ターミナル設定で「ダブルクリックでオブジェクトを選択」を有効にしてください。 ストラテジーテスターではプログラムをテストできないため、以下のビデオをご覧ください。 メリット 各種グラフィックオブジェクトを同期できます チャートを各種時間枠と同期できます 全てのアップデートは無料です 初心者でもプロでもご利用できます 設定が少なく、同期アイテムを選択できます Forex、CFD、Crypto、Metallis、Futuresなどの各種金融ツールがサポート

1. Compound Drawings (1) Line segment with arrow (2) Continuous line segment (broken line) (3) Parallelogram (4) Polygon (5) Profit and loss ratio measurement tools
2. Backtracking By the Z key in the process of drawing the line Line types that support Z-key backtracking: continuous line segments (broken line) ,channels,parallelograms,polygons, and fibo extensions.
3.Automatic Adsorption (1) Click the "Lock-Button" to switch the automatic adsorption switch before drawing the line (2)

Get all benefits of a grid strategy and none of its disadvantage | Built by a grid trader >> for grid traders.
This is MT4 version, click here for Blue Sonic Donchian MT5 (settings and logics are same in both versions) Real monitoring signal --> Sonic Gold | Sonic Fx Intro BlueSonic Donchian EA ('Sonic') is a next-gen multi-currency multi-timeframe EA base on Donchian indicator. Other than normal one-off entry, users would have option to activate grid series to max
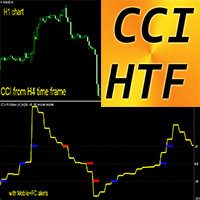
MT4用外国為替インジケーターCCI HTFオシレーター
MT4 用のプロフェッショナルな CCI HTF オシレーターで取引方法をアップグレードしてください。 HTF とは、より高い時間枠を意味します。 コモディティ チャネル インデックス (CCI) は、現在の価格と過去の平均価格の差を測定します。 重要なレベル: +/-200、+/-100 +200ゾーンより上の売りエントリーと-200以下のゾーンからの買いエントリーを取るのは素晴らしいことです このインジケーターは、プライスアクションエントリーまたは他のインジケーターと組み合わせたマルチタイムフレーム取引システムに最適です。 CCI HTF オシレーター インジケーターを使用すると、より高い時間枠から現在のチャートに CCI を接続できます。 インジケーターにはモバイルおよび PC アラートが組み込まれています
// さらに優れたエキスパートアドバイザーとインジケーターはここから入手できます: https://www.mql5.com/en/users/def1380/seller // また、収益性が高く、安定してい

AUTOGREEN EA The AUTOGREEN EA is designed specifically for trading on forex used. This EA use Price action to determine best open position. My main goal when developing a strategy is long-term growth. See youtube video full: https://youtu.be/ld_fSZMqZbE See Youtube Video default single entry setup backtesting: https://www.youtube.com/watch?v=ld_fSZMqZbE&t=1s See Youtube video with Recovery Setup backtesting: https://www.youtube.com/watch?v=ld_fSZMqZbE&t=518s It:
Trades the ALL MAJOR

This indicator presents an alternative approach to identify Market Structure. The logic used is derived from learning material created by DaveTeaches (on X)
When quantifying Market Structure, it is common to use fractal highs and lows to identify "significant" swing pivots. When price closes through these pivots, we may identify a Market Structure Shift (MSS) for reversals or a Break of Structure (BOS) for continuations. The main difference with this "protected" logic is in how we determine
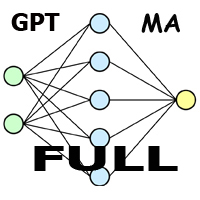
Этот советник расширенная версия Forex GPT MA который самостоятельно создает сразу 4 нейронных сети и обучается во время работы или при запуске в тестере стратегий, сеть создается из значений средней цены (на основе индикатора Moving Average). Другие мои продукты смотрите тут . Советник не использует сторонних библиотек, ни чего не подключает, все расчеты происходят внутри советника, с возможностью сохранения данных нейронной сети и всех его параметров при обучении, перезапуске или переносе на
マルチ通貨の前のキャンドルまたは前のバースキャナーは、インジケーター設定から選択したカスタム時間枠でマルチシンボルチャートをスキャンするのに役立ちます。
製品に基づく: https://www.mql5.com/en/market/product/110229
前日の高値安値、前週の高値安値、前月の高値安値、または任意のカスタム時間枠の複数のシンボルをスキャンするために使用できます。 過去4時間チャートの高値安値
ノイズをフィルターし、価格が高値ラインまたは安値ラインに接触したときに方向性のある警告を発します。
戦略はシンプルで、前日、週または月の高値安値に触れると、価格が5分などの短い時間枠で拒否されると見なされます。
さまざまなアラートの種類を選択するオプションがあります
スキャン頻度をミリ秒単位で選択および設定できます
1000 は、相場監視のすべてのシンボルを毎秒スキャンすることを意味します
製品の特徴
1. ターミナルアラート
2.電子メールアラート
3. プッシュ通知
LuxAlgoによってコード化された別のプラットフォームから変換されたインジケータです。
異なるタイプの移動平均を追加しました。オリジナルのバージョンでは、移動平均はSMAで、データソースはローソク足の終値から収集された市場からのものでした。
このバージョンでは、多くの移動平均の種類を選択でき、また、高値/安値/HL2/HLC/HLC2/...のようなソースデータも選択できます。
以下はオリジナル開発者からの詳細です:
レンジ検出インジケータは、価格がレンジ化している間隔を検出し、強調表示することを目的としています。レンジの両端はリアルタイムで強調表示され、ブレイクアウトは両端の色の変化で示されます。
レンジ相場は、価格が特定のレンジ内で動く定常期間によって定 義されます。
レンジ相場の検出は、トレーダーが手動で行う一般的な作業です。価格がレンジの両端のいずれかをブレイクすることは、新たなトレン ドを示唆することがあり、価格がレンジの上限をブレイクすれば上昇トレンド、 下限をブレイクすれば下降トレンドとなります。
レンジはゾーンとして強調表示され、過去に遡

MT4バージョン: https://www.mql5.com/ja/market/product/90091 MT5バージョン: https://www.mql5.com/ja/market/product/93707
「マルチペア通貨強さメーター」エキスパートアドバイザー(EA)は、包括的な市場分析と堅牢なリスク管理技術を通じて取引戦略を最適化したい外国為替トレーダーのために設計された高度な取引ツールです。 この EA は通貨強さの方法を利用しており、現在オープンしているポジションに基づいて、さまざまな通貨ペアの相対的な強さと弱さを明確に示します。 詳細な説明は次のとおりです。
概要 「マルチペア通貨強さメーター」EAは、複数のペアにわたるさまざまな通貨の強さを動的に分析する自動取引システムです。 オープンポジションを評価することで、通貨の強弱によって収益性の高い取引が可能となる取引機会を特定します。 EA には、未決注文の平均化などの高度なリスク管理機能が装備されており、市場のボラティリティに対するバランスの取れた制御されたエクスポージャーを確保します。
主な特長 通

このプログラムを使用すると、MetaTrader 4 (MT4) と MetaTrader 5 (MT5) の間でトランザクションを任意の方向に簡単にコピーできます。このプログラムは、「Windows PC」および「Windows VPS」で動作するように設計されています。 あらゆる種類のコピーが可能
MT4 - MT4 MT5 - MT5 MT5 - MT4 MT4 - MT5 *The copier works only on forex and only with currency pairs
※MT4~MT5端末間のコピーには、Trade Copier for MT4 + Trade Copier for MT5の2つのバージョンが必要です。
MT5 - https://www.mql5.com/ru/market/product/85793
パラメーター:
WORKING_MODE - 動作モード、信号の受信または送信。 FILE_ID - enter the file name identifier, for example 12345;
P


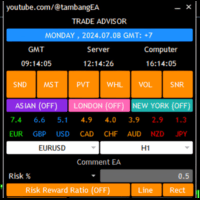
トレード アドバイザー: 一目で判断
プロのトレーダーのための究極のエキスパート アドバイザー (EA) アシスタント
バージョン MT4 バージョン | MT5 バージョン | ブログ
Trade Advisor は、トレーディング戦略を向上させるために設計された、洗練されながらも使いやすいエキスパート アドバイザー (EA) です。強力なトレーディング インジケーターと高度な資金管理機能を統合することで、Trade Advisor はすべてのトレードで精度と効率を保証します。
主な機能:
1. 供給と需要のゾーン:
主要な供給と需要のゾーンを特定し、潜在的な反転領域を強調します。
これらのゾーンに基づいてロット サイズを計算し、最適なリスク管理を行います。
2. 市場構造分析:
市場構造を分析して、トレンドの方向と潜在的なブレイクアウト ポイントを決定します。
市場の状況に基づいて明確なシグナルを提供します。
3. ピボット ポイント:
日次、週次、月次のピボット ポイントを使用して、潜在的なサポート レベルとレジスタンス レベルを
This EA uses the author's algorithm in his work and is intended for trading only on EUR/USD M5 /Этот EA использует авторский алгоритм в своей работе и предназначен для торговли только на EUR/USD M5
HURRY! The price will rise after each purchase, so as not to allow a large number of traders under this algorithm! СПЕШИТЕ! Цена будет расти после каждой покупки, что бы не допустить большого количества трейдеров по данному алгоритму!
For the security of your deposit on all other pairs or TF the E

Bar Strength Divergence Indicator for MT4 BarStrength Indicator is an exclusive indicator to trade Forex, Stocks, Indices, Futures, Commodities and Cryptos.
BarStrength Indicator shows the strength of each candle.
The indicator shows in a separate windows candles relatively to 2 price levels representing resistance and support in the market.
Once candle is near resistance it is highly probable that price movement will change direction and will go down in the next candles.
Once candle is

ペリデックスは、独自のスキャルピング手動取引システムです。この取引システムは自動的に市場を分析し、価格反転ポイントを決定し、 いつ注文を開始および終了するかをトレーダーに示します。このシステムは、トレーダーが必要とするすべての情報をチャートに視覚的に表示します。
M1スカルパーシステム-トレーダーを電話と電子メール信号に送信します!したがって、信号を待つために常にPCの前に座る必要はありません。 取引を開始するための良いシグナルが市場に現れると、インジケーターは自動的にあなたの電話と電子メールに通知を送信します。
M1スカルパーシステム-信号を再描画しません!この取引システムは公正です。シグナルを再描画したり、市場に合わせて調整したりすることはありません。 したがって、シグナルがチャートに描かれるとき、それは常にそこにあり、消えることはありません。
M1スカルパーシステムはセットアップが非常に簡単です。トレーダーができるだけ簡単に作業できるようにするために、 設定の数を1つのパラメーターに減らしました。これで、1つのパラメータ「期間」exを使用して、取引システム全体をカスタ

この指標は実際の経験に基づいている。
トップ/ボトムの日付/時刻を入れてください。
トップ/ボトムから現在までの最も訪問されたレベルを計算します。
ローソク足が更新されるたびに自動的に更新されます。 異なるトレンドと時間枠の複数のインディケータを同時に使用することができます。
長さは常にあなたの期間の開始から現在にプロットされます。
便利なPROツール。 この指標は実際の経験に基づいている。
トップ/ボトムの日付/時刻を入れてください。
トップ/ボトムから現在までの最も訪問されたレベルを計算します。
ローソク足が更新されるたびに自動的に更新されます。 異なるトレンドと時間枠の複数のインディケータを同時に使用することができます。
長さは常にあなたの期間の開始から現在にプロットされます。
便利なPROツール。
このアドバイザーは、複数のペアをワンクリックで取引できるダッシュボードです。 クリック 開ける 選択したペアの注文を開くボタン。 クリック 近い 選択したペアの注文を閉じるボタン。 注文ロットはユーザーが入力した番号です。正の数は買い注文に対応し、負の数は売り注文に対応します。 部分的に閉じるのではなく、注文全体を閉じるには、 「CLOSE」 ボタンをクリックします。クロージングアクションはロット数とは関係ありません。 マジックインプットを 0 に設定すると、アドバイザーが同時に手動注文を閉じるのを手伝ってくれます。 エントリーマジックを別のアドバイザーのマジックで構成すると、アドバイザーは、別のアドバイザーがオープンした注文を同時にクローズするのに役立ちます。 三角生垣 ワンクリックで。 取引シンボルはカスタマイズ可能です。市場観察からインポートするか、ユーザーが入力します。
禁止: Magic - アドバイザーのマジックナンバー。 MaxLots: 最大ロット。ロット数がこのMaxLotsを超える場合、注文ロットはMaxLotsとなります。 StopL

EMA Crossover Pro MT4 (see EMA Crossover Pro for MT5 variant)
this EA uses two exponential moving average crossover, a slow ema, and a fast ema on which it takes buy/sell decision.
A default ema configuration is 12 and 35 where 12 is the value of slow ema, and 35 is the value of fast ema.
Expert advisor parameters:
stop loss (greater than 40, but some brokers accept stop loss under 40)
take profit (greater than 40, but some brokers accept stop loss under 40)
trailing_stop (set it as 0 for
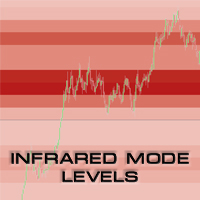
UPDATE 3 - Scan what you see - the indicator will scan and draw levels for all VISIBLE bars on the chart, rather than Current Bar - till first visible bar on the chart (historical bar on the left side). Assumption is, if you are going back in history and you want to check levels, you care about that specific moment in time and what the levels were during that moment (excluding data of the future which is not visible). UPDATE 2 - version 2.1 introduces the "Always ON" feature. If enabled, you ca

WolfeWaveBuilder インジケーターで取引に参加しましょう! これは、最も成功した収益性の高い投資決定を得るために特別に作成された独自のツールです。 ライブ口座に最適で、徹底的にテストされ、事実上保証された取引戦略から利益を得られます。 チャンスをお見逃しなく! WolfeWaveBuilder インジケーターでお金の取引を始めましょう!
MT5 バージョン https://www.mql5.com/ru/market/product/82360
インジケーターの機能
Wolfe Waves 戦略の合図を出します。 トレンドを表示します。 1980 年から使用されている実績のある効果的な戦略です。 シンプルなエントリーシグナル。 再描画せず、遅れません。 音、メール、電話でのお知らせがあります。
命令
矢印が表示されるか、端末にメッセージが表示されるか、メール、電話に通知されるまで待ちます。 あなたは取引を開きます。 価格がライン 1 ~ 4 を超えたときに終了することをお勧めします。 戦

Waddah Explosion Scanner Features : - Waddah Trend, Explosion Increase/Decrease
- Trend Percentage with Threshold
- DeadZone
- Trend Direction Aligned Checks
- Highlight and Alerts
- Multi-Timeframe & Multi-Currency
Check out the blog post for more info: https://www.mql5.com/en/blogs/post/758020
Customizable Threshold: With customizable threshold, you can identify best trading opportunities in volume-based trading. Use Trend Height (x times Explosion) : Trend height in relat

真の需給指標 -すべての時間枠で抵抗の場所とサポートレベルをすばやく決定できます。 この指標は、取引でテクニカル分析を使用する人に役立ちます。 インジケーターは使いやすく、チャート上でドラッグアンドドロップするだけで、インジケーターは最も可能性の高いサポートレベルとレジスタンスレベルを表示します。 時間枠を切り替えると、新しく選択した時間枠のレベルが表示されます。
おすすめのロボットスキャルパー - テスト 。
入力パラメータ Use_priceラベル -オン/オフレベルの近くに価格アイコンを表示する 価格レベルの色 -価格アイコンの色を選択します 価格Lebelサイズ -価格アイコンサイズ サポート/耐性レベルの色 -レベルの色を選択します 私の購読 ページ 、私は他の多くの有用な製品を持っています。 この指標が気に入ったら 、レビューを残してください。便利な製品を無料で共有する動機付けになります。

BeST_Darvas Boxes EA is an MT4 Expert Advisor that is based on the most classic trading method developed in the 50's by Nicolas Darvas commonly known as The Darvas Boxes Trading System. The Original Darvas Boxes System can be found in details in his book "How I Made $2,000,000 In The Stock Market" (Copyright 1960, by Nicolas Darvas).
Although the original system was designed to trade only Stocks and to open only Long trades its trading principles can also be applied to many other Markets
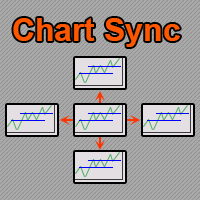
チャート同期インジケーター - ターミナル ウィンドウのグラフィック オブジェクトを同期するように設計されています。 作業するには、オブジェクトのコピー元のチャートにインジケーターをインストールします。このチャート上で作成されたグラフィック オブジェクトは、インジケーターによって同じシンボルを持つすべてのチャートに自動的にコピーされます。インジケーターは、グラフィック オブジェクトの変更もコピーします。 入力パラメータ: exception - コピーする必要のないグラフィック オブジェクトの名前の接頭辞。複数のプレフィックスを指定するには、「;」で区切って入力します。 SyncVLINE - 垂直線を同期します。 SyncHLINE - 水平線 SyncTREND - トレンドライン SyncTRENDBYANGLE - 角度別のトレンド ライン SyncCYCLES - 循環ライン SyncCHANNEL - 等距離チャネル。 SyncSTDDEVCHANNEL - 標準偏差チャネル SyncREGRESSION - 線形回帰チャネル。 SyncPITCHFORK - アンドリュー
TP SL Bot is a utility that automatically sets Stop Loss and Take Profit for newly opened orders in several ways. There is also a function for calculating the volume that you need to open the trade to get the desired amount with the specified Stop Loss / Take Profit size in points. There are several options for calculating the size and setting parameters TP and SL: 1. Setting based on the amount specified by the user as a percentage of the current deposit balance. 2. Setting as the amount entere
Ultimate Fibonacci EA & Trade Manager With Advanced Pattern Recognition Discover the power of precision trading with the Ultimate Fibonacci EA, an innovative Expert Advisor (EA) for the Forex market. This advanced tool is designed to work in harmony with your Fibonacci retracement strategy, providing dynamic responses to market movements and pattern recognition. Core Features: Fibonacci Retracement Tool Compatibility: Seamlessly integrates with your chart's Fibonacci tool, adapting to drawings,
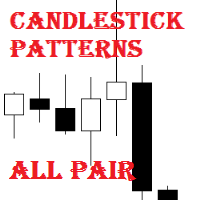
Candlestick Patterns All Pair is a simple and convenient indicator of candlestick pattens. It is able to identify 29 candlestick patterns. It displays the latest patterns for all pairs and timeframes.
The considerable advantages of the indicator It finds and marks 29 candlestick patterns; Displays a table of the last patterns for the 28 major pairs and each timeframe; It has settings for 5 extra pairs; Indicates the classic trade direction; Each candlestick patterns can be disabled in the sett

Extract Candle Power は 、各ローソク足中の売り手と買い手の行動に関する貴重な洞察を提供するリアルタイムの出来高抽出インジケーターです。出来高データを分析することで、トレーダーは市場の傾向や反転の可能性について、より多くの情報に基づいた意思決定を行うことができ、従来の移動平均指標の機能を超えています。 この強力なツールを使用すると、現在のローソク足の売り手と買い手の出来高を抽出して分析したり、以前のローソク足の出来高と比較したりすることができます。この情報は、市場におけるトレーダーの現在の位置を理解する上で非常に重要です。さらに、ライブローソク足の出来高と移動平均を比較することで、潜在的な反転ポイントを簡単に特定できます。 Extract Candle Power インジケーターは非常に汎用性が高く、すべての時間枠および通貨ペアで効果的に機能します。これは正確な洞察を提供し、より長い時間枠で使用する場合に特に価値があります。特定の取引戦略がある場合でも、さまざまな時間枠に適応したい場合でも、このインジケーターはニーズに合わせて調整できます。 このインジケーターは、取

Equity Protection EA MT4
一般的な機能: 取引セッションの結果を完全に制御。 すべての外国為替記号、指数、金属、株式などの全体的な結果を制御します。制御はグローバル株式に対して行われます。 利益率または損失率に達したときに、すべてのシンボルのすべての取引を閉じます。 量とパーセンテージの両方で変更可能な構成。 トレーリングストップグローバルによる結果の保護。 セッションで達成された結果の記録(より高い資本とより低い資本)。 ログイン時にすべての計算は常に貸借対照表で実行されるため、取引の終了または開始には影響しません。- Metatrader 4では、アカウントの利益または損失の特定の割合で個々の取引を閉じる可能性があります。-
新機能: テイクプロフィットまたはストップロスがトリガーされたときにプラットフォームを自動的に閉じるオプション- 通知機能:TP / SLレベルがトリガーされたときにレポートを電話に送信するオプション(プッシュ通知)または電子メール。 TP / SLがトリガーされたときに保留中の注文を削除するオプション。 TP / SLがトリガ

投資利益がもうかるように、mql5.comというウエブサイトでシグナルを借りている場合、リスクを避ける為に、このシグナルから貰ったMT4ソフトでのロットサイズは制限される。注文サイズは小さすぎるので投資利益も少なくなる。 これは投資利益増加の為に注文サイズを増やす工具である。この工具をもってオリジンル注文から注文を自動的にコピーされる。コピー注文のサイズはは乗数サイズであり、テクニカル指標に応じる。注文開閉プロセスはすべてオリジナル注文に基づき、自動的に実施される。又、損失止め価値及び利益取り価値も自動的にコピーされる。 例えば サイズを3倍増やしたい場合 オリジナル注文(シグナル提供者からもらった):0.01ロット コピー注文(工具で作られたコピー注文):0.02ロット ロット乗数でテクニカル指標設定:2 注文ロットの合計:: 0.01 + 0.01 * 2(ロット乗数)=0.03 ロット そうすると、ロット注文サイズは0.01 から 0.03に増えた。
留意 この工具は一つパソコン/Vps、一つウィンドウズ及び一つチャート/一つ口座しか設定されない。また、工具はすべての通貨コー

「Scalping Signal No Repaint No Lag」は、どのチャートにドラッグしても、テンプレートや他のインジケーターをロードする必要なく、必要なすべてのインジケーターを自動的にロードする市場で唯一のインジケーターです。提供された画像とまったく同じようにチャートを自動的に設定します。このインジケーターはリペイントや遅延のないシグナルを保証し、すべての通貨ペアおよび時間枠(TF)でのスキャルピング戦略に最適です。 機能 インジケーターの自動ロード :インジケーターを任意のチャートにドラッグすると、追加の必要なインジケーターがすべて自動的にロードされ、設定された好みに応じてチャートが設定されます。ただし、設定からパラメータを変更することもできます。 チャートの可視化 :日本のローソク足や特定の色を使用して、視覚化を改善するためにチャートのプロパティを調整します。背景やローソク足の色は必要に応じて変更できます。 シグナル生成 :2つの移動平均線の差およびRSIとそのEMAのクロスオーバーを使用して、買いと売りのシグナルを生成し、チャートに矢印で表示します。 トレンドの可視化

Ultimate Breakout Scanner (Multi Pair And Multi Time Frame) : ---LIMITED TIME OFFER: NEXT 25 CLIENTS ONLY ---46% OFF REGULAR PRICE AND 2 FREE BONUSES ---SEE BELOW FOR FULL DETAILS Breakout trading is one of the most popular trading approaches used in the institutional trading world.
As it takes advantage of the never ending phenomena of price expansion and contraction (through volatility) .
And this is how institutional traders are able to take advantage of explosive moves in the market .

Ultimate Moving Average Scanner (Multi Pair And Multi Time Frame) : ---LIMITED TIME OFFER: NEXT 25 CLIENTS ONLY ---46% OFF REGULAR PRICE AND 2 FREE BONUSES ---SEE BELOW FOR FULL DETAILS Institutional traders use moving averages more than any other indicator. As moving averages offer a quick
and clear indication of the different phases of a trend. Such as expansion, pullback, consolidation and reversal.
And viewing the market through the same lens as the institutions is a critical part

Ultimate Double Top Scanner (Multi Pair And Multi Time Frame) : ---LIMITED TIME OFFER: NEXT 25 CLIENTS ONLY ---46% OFF REGULAR PRICE AND 2 FREE BONUSES ---SEE BELOW FOR FULL DETAILS Any major price level that holds multiple times, is obviously a level that is being defended by
the large institutions. And a strong double top pattern is a clear indication of institutional interest.
Double top patterns are widely used by institutional traders around the world. As they allow you to manage

新しいインジケーターのご紹介:[ON Trade Breakout Zone] すべてのトレーダーに向けたシンプルでありながら強力な市場分析ツール! プロフェッショナルから初心者まで、どなたにも適しています トレーディング戦略を一層強力にしませんか?当社の最新のインジケーターは市場分析を簡素化し、あらゆるレベルのトレーダーに力を与えるよう設計されています。経験豊富なプロであろうと、たった今始めたばかりであろうと、[ON Trade Breakout Zone] は市場で潜在的な利益を引き出すための鍵です。 [ON Trade Breakout Zone] の使い方: この賢明なツールは、毎日、先進的なアルゴリズムを使用してチャート上にゾーンを描きます。最大限に活用する方法は以下の通りです: ゾーンの識別: [ON Trade Breakout Zone] は高い精度でチャート上の重要なゾーンを識別し、潜在的なトレードの機会を簡単に見つけるのに役立ちます。 トレードの実行: 描かれたゾーンのどちらかの側に価格が移動するのを待ちます。 価格が購入ラインを上回った場合

Features This is an indicator that recognizes a special type of Inside Bar formation which is formed by a Master candle followed by 4 smaller candles (please see the strategy explanation below). Plots buy/sell stop lines on the chart as well as well as take profit and stop loss levels. The TP/SL levels are based on the Average True Range (ATR) indicator. Object colors are changeable. Sends you a real-time alert when a Master candle formation is identified - sound / pop-up / email / push notifica
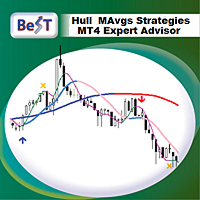
BeST_Hull MAvgs Strategies_EA is an MT4 Expert Advisor based on the Market indicator named BeST_Hull MAs Directional Strategy and can make trades according to it or using only 1 HMA while it also applies all common Trade and Risk Management features.
Generally the Hull Moving Average (HMA - developed by Alan Hull) is a directional trend indicator. It captures the current state of the market and uses recent price action to determine if conditions are bullish or bearish relative to historical d
スマート ボリューム トラッカーは、専用ウィンドウに買値と売値のデータを視覚的に表示することで、市場センチメントに関する洞察を提供するように設計されたインジケーターです。 この直感的なツールは、トレーダーが売買活動が集中している場所を素早く特定するのに役立ち、より多くの情報に基づいた取引上の意思決定を可能にします。
Smart Volume Tracker を使用すると、市場が強気トレンドに傾いているか弱気トレンドに傾いているかを簡単に判断できます。 これは買値と売値のクラスターを示しており、緑色は買い活動を、赤色は売り活動を表しています。 この色分けされた視覚化により、現在の市場の雰囲気を簡単に判断できるため、トレンドや潜在的な転換点を特定するのに役立ちます。
クラスタリング パターンを観察することで、効果的な取引に重要な主要なサポート レベルとレジスタンス レベルを特定できます。 独立したインジケーター ウィンドウによりメイン チャートが明確に保たれるため、市場のダイナミクスに関する貴重な洞察を得ると同時に、取引戦略に集中することができます。
スマート ボリューム ト
MetaTraderマーケットはトレーダーのための自動売買ロボットやテクニカル指標を備えており、 ターミナルから直接利用することができます。
MQL5.community支払いシステムはMetaTraderサービス上のトランザクションのためにMQL5.comサイトに登録したすべてのユーザーに利用可能です。WebMoney、PayPal または銀行カードを使っての入金や出金が可能です。
取引の機会を逃しています。
- 無料取引アプリ
- 8千を超えるシグナルをコピー
- 金融ニュースで金融マーケットを探索
新規登録
ログイン