YouTubeにあるマーケットチュートリアルビデオをご覧ください
ロボットや指標を購入する
仮想ホスティングで
EAを実行
EAを実行
ロボットや指標を購入前にテストする
マーケットで収入を得る
販売のためにプロダクトをプレゼンテーションする方法
MetaTrader 4のためのエキスパートアドバイザーとインディケータ - 97

The price is moving between two curve tunnel lines in a trend. The two lines of a tunnel represent support and resistance. In an uptrend, for instance, a trade might be entered at the support of the trend line (shown by the red line in the chart) and exited at resistance of the upper tunnel line (shown by the blue line). Tunnel show trend direction for any timeframe (if you have enough bars on the chart for higher timeframes). Trend, or price tunnel, can be up, down or sideways. If the current p
MACD MTF Signal is an indicator for understanding a trend reversal in any market . It is calculated using the MACD Histogram, which results from the difference between MACD and Signal Line. The strength of MACD MTF Signal is the ability to see more time frames at the same time if they are greater than the one displayed on the chart. In this way it is possible to understand a convergence of ascent or descent on several time frames, which means a strong push in one direction or the other. Another

Parabolic SAR is one of the most popular indicators allowing you to determine in a timely manner the trend reversal, get an early entry point and accurately define the place of profit taking. Parabolic SAR is very efficient in case of a trendy market but often gives false signals during a flat. In order to sort such signals out, it is possible to use the same indicator on higher timeframes. This eliminates the main drawback of the indicator during a flat, while retaining its advantage of early e

This is a fully automated Expert Advisor that does not require stopping during the news release. Trade is conducted by the trend determined by the indicator Ichimoku. Opening the orders occurs near the support (resistance) levels and in presence of the confirmation signals from other indicators. The EA does not require ECN accounts. It works on 4- and 5-digit quotes. The type of quotes is determined automatically. The timeframe of the chart does not matter. The default settings are optimized for

EPriceJPY is a auto-trading EA focused on USDJPY.
Trading Concept The operation concept of EPriceJPY is based on an algorithm that tries to determine the Trend. To be more specific, EPriceJPY works with its own calculation logic based on simulation. It is trying to find out the Top or Bottom in a Trend, and open the Short or Long Position accordingly. Don't expect EPriceJPY to open the trade on the highest or lowest level, because EPriceJPY will trade only when the Top/Bottom can be confirmed.

CHF Portal is designed for Trading USDCHF specifically.
Trading Concept The operation concept of CHF Portal is based on an algorithm which tries to determine the Trend. To be more specific, CHF Portal works with its own calculation logic according to historical volatility and price movement. It is trying to find out the Top or Bottom in a Trend, and open the Short or Long Position accordingly. Don't expect CHF Portal can be able to open the trade on the highest or lowest level, because CHF Por

Trading Machine is an Expert Advisor (Robot) for any financial instrument on the MetaTrader 4 platform. All input parameters are optimized for EURUSD M1 . Of course, you are able to optimize these parameters for any currency pairs and timeframe. The main input parameters are A, B, C, D, and E , which can be any positive numbers. These are input parameters (weight coefficients) of the one layer neural network. The EA checks for a new trend and opens a position accordingly. If a trend changes its

Fenrir is a fully automated quantitative swing trend follower EA. It trades Forex pairs using an adaptive market neutral multi-strategy neural network. It is scalable, and can manage SL and TP for orders opened by concurrent EAs on the same product (so called wolfpack mode ), so that the user can add third party logic. The multi strategy structure reserves all magic numbers in the range of x666xxx, and can manage order injection from other EAs. To work in wolfpack mode , just set any other EA to

This indicator displays the trend movements.
Parameters Trend: Displays the trend movements, true/false. X: moves the trend left and right. Y: moves the trend up and down. How to understand the status: (M1), square indicates the timeframe for 1 minute. If the square is green, trend is up. If the square is red, trend is down. (M5), square indicates the timeframe for 5 minute. If the square is green, trend is up. If the square is red, trend is down. (M15), square indicates the timeframe for 15 m

Steed is a trend-following multicurrency Expert Advisor, intended for long-term and safe investment. The strategy is based on the analysis of statistics of currency pair movements, as well as the correlation between te underlying currencies of the currency pair the EA is trading. Decision on each specific entry is made through technical analysis, while considering the data from different timeframes. It is necessary to understand that periods (weeks or months) of drawdown or operation with zero p

EW Oscillator PRO is an indicator for MetaTrader 4 based on mathematical calculations on the price chart. This is one of the most common and useful indicators for finding the trend reversal points. EW Oscillator PRO is equipped with multiple types of notification (push notifications, emails, alerts), which allows opening trades in time. A panel for displaying the information on the indicator signals from different timeframes is located in the top left corner (see screenshot #2).
Distinctive fe

This utility is designed for testing the signal indicators (arrow or trend based). This utility allows quickly evaluating the efficiency of an indicator. To use this utility correctly, enter the exact name of your indicator in name_indicators. Then set filter 1 or 2, depending on the bar, where the order should be opened. Next, set the number of the buffer for buying and selling, set take profit and stop loss. The indicator is ready to be tested. This utility can be used in live trading as well.

The Magneto Volume Trigger indicator is designed for determining the volume confirmed by the candlestick pattern and predicting the trend tendency.
Indicator setup and use The calculation of values is affected by two parameters - Period and Gate . The lower the value of Gate , the higher the sensitivity of the indicator. Period allows making a sample of data for the specified number of candles. The lower the value of Period , the more the indicator is adapted to the current market conditions.

The Expert Advisor trades two strategies, each designed for a particular market behavior. Using both strategies allows you to cover a significant range of trading time and get high and stable results. The Channel strategy is based on the principle of scalping within the channel bounds, during periods of low volatility. Trend strategy builds on the principle of following the trend in during the high volatility hours. The trading periods are selected based on the statistical and fundamental analys

This Expert Advisor implements elements of the Martingale system. Orders are opened at a specified distance from the moving average. The Parabolic SAR indicator and certain technical details are used to ensure the most accurate entries. The EA is highly customizable. It is recommended for simultaneous use on 4 currency pairs: EURUSD M15; GBPUSD M15; USDJPY M15; USDCAD M15. Despite good stability, it is advisable to disable the EA operation during the days rich in news releases.
Configurations

The RiseTrading is a unique High quality and easy to use and affordable trading tool because we have incorporated a number of proprietary features and PowerSignal and MACD and Stochastic indicators. The main advantages of the trend trading strategy used by the Expert Advisor are opening positions only in the direction of a trend, ability for the long-term retention of profitable positions allowing users to achieve good combinations of profit/loss distributions. That can work on a real account at

This multicurrency strategy simultaneously determines the strength of the trends, entry points and the take profit levels for each trade. The indicator can determine entry points on any trading period from M1 to D1. For the convenience of users, the indicator renders the entry point (in the form of an arrow), recommended take profit levels (TP1, TP2, TP3) and the recommended stop loss level (SL1, SL2). The options for using the strategy are described below. Full description of the indicator Cosm
The Currency Strength Index Oscillator multicurrency trend oscillator shows the interaction of the indices of the current symbol's currencies calculated on the basis of the cross-rates of Majors.
Features Calculations are based on complete bars, therefore, it does not redraw. It works on any symbols that include the Majors (AUDJPY, AUDUSD, CHFJPY, EURAUD, EURCAD, EURCHF, EURGBP, EURJPY, EURUSD, GBPAUD, GBPCAD, GBPJPY, GBPCHF, GBPUSD, NZDJPY, NZDUSD, NZDCAD, USDCAD, USDCHF, USDJPY). It works on

The indicator shows and highlights the chart candles, which are formed as a result of large players entering the market in large volumes. Such candles can also be formed after achieving a certainty on the market, when most of the participants hold positions in the same direction. The movement is likely to continue in that direction after such candles. The indicator highlights the significant candles from the existing ones on the chart; The indicator allows identifying the trends based on candles

This indicator helps to define the dominant trend. The Blue line and Red line changes at incrementations of the trends.
Parameters ki: factor of the delay. per: Displays the indicator period. Trend: Displays the Trend movements. Trend true.(false) X: moves the trend left and right. Y: moves the trend up and down. How to understand the status: If the arrow is blue, trend is up. If the arrow is red, trend is down.

Proton EA is a Trend - Momentum Forex strategy that uses indicators to enter and exit orders. Proton EA allows you to change all parameters of the indicators selected for best results. This EA gives you the choice of whether to trade on Friday or not. The EA has a safe mode option which break even at stop loss to reduce losses. It has the ability to use trailing stops and is fully optimized for your needs. This EA has a customizable volume filter to protect you from unexpected volatility. It is

The Magneto Precision Trend indicator is based on candlestick analysis. It determines the trend change on the previous candle, signal is not redrawn.
Indicator setup and use Increasing the Period parameter decreases the indicator sensitivity, resulting in less frequent changes in color but filtering the market noise. However, the trend change signals will arrive visually with a delay. And, conversely, decreasing the value of Period provides more accurate but more frequently changing signals. T

The Magneto Reverse Signal indicator is based on the candlestick analysis. It identifies the reversal points.
Indicator setup and use Adjustment of the indicator is reduced to selection of parameters Period (left window of the panel) and Gate (right window of the panel). It is more convenient to adjust the settings using the control panel directly on the chart. In this case, you can immediately see which optimal parameters can be used in the current market. This method is shown in the video in
Channel hybrid of the Moving Average, Bollinger Bands, RSI and CCI indicators. Unique filtering of signals without redrawing the indicator allows making various trades - both medium-term and short-term. The indicator operation principle lies in searching for the market reversal patterns. The trend reversal detection method uses the channel Triangular Moving Average, which plots equidistant non-redrawing channels with a Deviation period specified in the settings. Comparison of TMA and Bollinger B
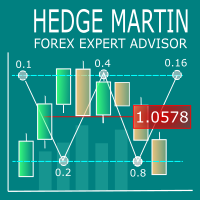
Hedge Martin Expert Advisor restores loss-making positions making them profitable by opening an opposite position with an increased lot.
Trading strategy The EA works on a trend market selecting the appropriate curency pairs. The robot trades depending on the previous candle direction. The first order is set according to the following rules: If the previous candle is bullish, the EA opens a buy order; If the previous candle is bearish, the EA opens a sell order; If the price goes in unfavorabl

NIZMA is a ready-made trading system, that is the most efficient on the EURUSD, AUDUSD and GBPUSD currency pairs. The best timeframes are M5 and higher. The system shows the market entry points in the form of arrows, and also displays the information on the strength and direction of the trend. The signals are easy to interpret. It is suitable for both novice and professional traders. With the properly selected settings, it gives the minimum number of false signals. In tests, this number did not

Volume Analysis Trader looks at volume using a fixed average of volume. This averaging helps spot when volume is rising or declining. Also I have added volume spikes which are when volume suddenly is above the average. These help spot market reversals. This will hep a trader look for the following in their trading: Rising volume during a rally shows trend is strong. Falling volume on a rally shows trend is weakening. As a rule of thumb on daily charts if current volume is higher than yesterday's

MA And Oscillation simple system that overcomes all the market confusion by simply looking at the moving average and stochastic oscillator and signalling when the moving average and stochastic or heading in same direction. The moving average is arguably the simplest but most effective tool when trading larger timeframes. We use this and the Oscillator to time our market entry. Features :
A method of simplifying a sometimes confusing market. Choose if you want to signal only when moving average

The indicator identifies the trend change points. Does not redraw. Calculation is done on an active candle. Lines crossing is used as a trend change point. If the price is above the two lines, there is an uptrend. If the price is below the two lines, there is a downtrend. The indicator allows you to accurately enter the market during a trend change. It can also be used in custom strategies on a detected trend. 3 modes of notification on trend changes. Sound, arrows, sending push-notifications. I

Unity Basket WPR (William's Percent Range) indicator combines serveral pairs' WPR to a combined basket of your defined base currency. This gives you clear trading signals along with potential TP and SL. Use the indicator along with other indicators, like ATR, to avoid flat market situations and an indicator showing you the overall trend like an MA (50). Trade with the trend.
Settings Basket pairs - comma separated list of pairs (default: EURUSD,EURJPY,EURCHF,EURGBP,EURNZD,EURCAD,EURAUD) Period

The trend scalper candles are used to identify short-term trends based on the readings of the MACD, RSI and ATR indicators. All indicator calculations are visualized by candle colors which are overlapped on the chart. The indicator uses gray , green and red colors to paint individual candles, which gives you a lot of useful and easy to read information.
Gray candles Gray candles indicate a range bound period and the information can be used to trade breakouts. Simply mark the high and low of th

TCD (Trend Convergence Divergence) is based on the standard MACD indicator with modified calculations. It displays the trend strength, its impulses and rollbacks. TCD consists of two histograms, the first one shows the main trend, while the second done displays the impulses and rollbacks. The advantages of the indicator include: trading along the trend, entering the market when impulses occur, trading based on divergence of the main trend and divergence of the rollbacks.
Input parameters Show_

Risepanel helps you open positions, close positions and analyze currencies. It works any time frame. For calculations to be correct, your account currency must be USD, EUR or GBP.
Features Market information. Orders and Pending Orders (Stop & Limit). 8 kinds of Pending by trend line. Specifications and Margin Calculation Required by Buy or Sell. Calculate and determine Stop Loss by pip, currency pair price, monetary value and percentage of risk. Calculate and determine the take profit by pip,
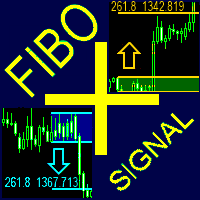
The FiboPlusSignal Expert Advisor. Automatic and manual trading on any instrument (symbol) and on any chart period. The operation algorithm is based on: Fibonacci retracement (5 different methods); calculation of trend direction using 14 indicators; support and resistance lines; horizontal support/resistance levels. Additional features: locking of orders (instead of setting stop loss); trailing stop based on Fibonacci retracement; alert system; visual panel for opening orders in manual trading –
Plotter is an indicator that was created during the ICT mentorship to make charting quick, easy and fun for everybody. Assign a function to any hotkey in indicator settings or use the default keys to perform smart actions that usually takes a lot of time to perform. Click on any bar, press OHLCMBVPOKJH to plot objects, color them with keys 0-9 or modify them with keys ERAZ and much much more. Indicator settings are described below. CHART SETTINGS gmt_offset auto -23 - 23 daylightsavings= set dst
The Expert Advisor strategy is based on the moving average channel breakthrough. VSP is required for flawless operation, the recommended minimum deposit is 1000 units of the base currency. The EA is to be used on M5-H1 of highly liquid currency pairs with a small spread/commission (for example, EURUSD, GBPUSD, AUDUSD, USDJPY, USDCHF, USDCAD, NZDUSD, EURJPY, EURGBP and EURCHF). Features The EA features a predictive algorithm based on price patterns, as well as stop loss and take profit levels; Cu

Algo Mtf is a multi timeframe indicator that can inform you about the situation of the indicators placed on other timeframes. This indicator has the possibility to offer a series of algorithmic calculations such as: RSI, Vortex, MACD, Momentum, Stocastic and ATR. The zones are colored in base of levels of this indicators on the chosen timeframe.
The confluence observation offers excellent operational tips and allows you to identify the trend tendency. The indicator is very efficient and an indi

Ema Dashboard is an innovative dashboard that allows you to monitor Moving Average on multiples symbols and different timeframes. This dashboard allows you to analyze information on 28 pairs on an unique chart. Its functionality includes analysis of All Time Frames. This configuration allows you to identify the Long Term Trend with extreme ease. This panel allows you to take very important directional movements. A click on button opens a new chart (symbol and timeframe).
Graphic Object Symbol
Double Wave applies standard indicators, volatility, volume and a number of custom approaches allowing for efficient combination of all mentioned tools. The indicator allows you to define possible price reversal points both in the direction of a trend (preferable) and against it. Also the indicator assists in determining the trend and visualizes it by displaying a histogram. The indicator works with any symbol provided that you have sufficient history data for a timeframe the indicator is launch

The Smart Tick Averager Expert Advisor is a cost averaging system, based on the analysis of the tick data. Smart Tick Averager finds a short-term trend impulse and attempts to capture a part of the rollback. In case the movement continues in the impulse direction, the EA chooses a moment for opening additional trades according to the grid step. It applies a filter, which minimizes the probability of falling into a strong trend movement. It also uses a filter of the segment, taking its amplitude
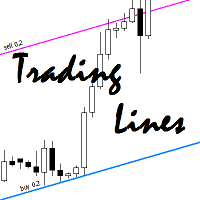
This utility is an Expert Advisor for semi-automatic trading within a price channel. It enters the market when the price crosses the channel boundary. Trend lines with a special type of description should mark the boundaries of the price channel. Trader is responsible for creating and aligning such trade lines on the required chart. The lines should be placed according to the same rules the "buy limit" and "sell limit" pending orders are placed. A trend line with a description of type "buy x" (w

Stochastic Trend Bars indicator is the modified version of the standard stochastic indicator. This indicator is different from the standard stochastic indicator and turned into a trend bars indicator. Added visibility to understand trends. Easy to use and simple. The user will easily detect trends. You can use this indicator as a trend indicator on its own. Or as a trend filter along with other strategically relevant indicators. Easy to use and simple to understand trends.
Suggestions and Feat

Pivots Dashboard is the single most complete instruments set for Pivot Points trading currently available in the market. We have done a comprehensive research prior to the product design to make sure that this product meets every need of Pivot Point trading. Pivots Points are significant levels technical analysts can use to determine directional movement and potential support/resistance levels. Pivot Points are thus predictive or leading indicators. While the points were originally used by floor

The Grid Trader Expert Advisor is a very special algorithm that allows traders to benefit from sideways markets. It trades long and short sides separately and creates two different grids according to its setting. Each side has its account and virtual take profit, determined in money. EA also uses virtual stop loss based on the account's percentage amount. Traders can work with a classic grid where the distance between orders is fixed or choose a more "adaptive" dynamic grid with ATR-based d

The fully automated Yellow EA works on short-term trend changes creating the price "corridor" set in the parameters. Trading is carried out at the external borders of this corridor by opening positions in different directions with different lot sizes.
Version of Yellow Expert Advisor for MetaTrader5 .
The strategy is simple, but effective.
Presence of a sufficient number of parameters allows trader to customize the advisor in accordance with his trading style.
Telegram: https://t.me/re

Trend reversal indicator. This indicator is based on expected value, as well as the Bollinger Bands and Ichimoku Kinko Hyo technical indicators. A trend reversal is determined by a complex mathematical formula, and its confirmation is based on the values of BB and the Ichimoku cloud. Signals are generated at the peak of a trend reversal, i.e. Trend Arrow Finder identifies the beginning of a new trend and the end of the previous trend. When a new candle opens, a signal for opening positions (buy

The strategy is based on the price channel breakout. VPS is required for flawless operation, the recommended minimum deposit is 1000 units of the base currency. The EA is to be used on M5-H1 of highly liquid currency pairs with a small spread/commission (for example, EURUSD, GBPUSD, AUDUSD, USDJPY, USDCHF, USDCAD, NZDUSD, EURJPY, EURGBP and EURCHF). Features The EA features a predictive algorithm based on price patterns, as well as stop loss and take profit levels; Customizable pyramiding, hedgi

Determining the current trend is one of the most important tasks for a trader regardless of their trading style. Price Direction is able to define a trend with a fairly high accuracy. The indicator applies the proprietary method in its calculations. Price Direction is suitable for any currency pair and timeframe. It does not change its readings. The indicator is based on volatility and the unique method. The histogram color depends on the current trend strength - the darker the histogram, the st

The Expert Advisor itself uses anomalies in momentum to identify short term bursts within the market to capture profit. With the use of the standard deviation and variance, the EA looks for changes in the Average True Range in order to place trades at peaks and troughs within the market that have the highest probability of establishing a new trend. It uses a number of different mathematical principles as well as embedded custom indicators. When using this expert advisor, there are four require

This type of EA does not open orders itself. (in backtest mode it open random orders for visualizing, how EA works) This utility is for manual trader, who like trading with Trailing Stops and want automatically trail stop loss of opened positions by preferred algorithm. This EA using one of the seven algorithms (MA, Fractals, SAR, ATR, Movement of Candlesticks, Profit and Points) to catch the trend. You can specify a breakeven level to move stop loss of your opened positions. You can filter ope
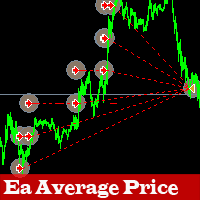
The Expert Advisor relies on a grid strategy and identifies a strong trend. It can also work on all pairs with a minimal spread. The EA uses average price deals, users can install martingale, hedging and scalping.
This is an automated system that is optimized and ready to use. The configuration is simple.
Recommendations Deposit min 1000$ or appropriate cent account Use a small spread
Parameters MagicNumber : unique (magic) number of the EA TrailingStopLoss: as a position gains in profit,

Leo Trend is a signal indicator that shows the market entry points, as well as the trend direction and flat on the chart in the form of arrows and lines. Leo Trend will be useful both for beginners creating a trading strategy, and for professionals to integrate into ready-made trading systems. Leo Trend works without redrawing and without significant delays. The operation of the indicator is demonstrated in the video. In addition, you can test this indicator in the strategy tester free of charge

BcWm is an Expert Advisor working based on some of the most accurate price action classical patterns related to trend change. This EA can be used on all currency pairs on H1 and H4 timeframes. You can use this expert advisor on more that one pair at the same, diversify and reduces exposure to a single pair or on individual operation. Please note this is not fast making money but rather generating longer term signals on higher timeframe, so it will not open trades every day. This is NOT martingal

Accelerator_EA is an Expert Advisor using a trend strategy based on the indicator AC-Complete (www.mql5.com/en/market/product/24613). "Acceleration/Deceleration Technical Indicator (AC) measures acceleration and deceleration of the current driving force. This indicator will change direction before any changes in the driving force, which, it its turn, will change its direction before the price. If you realize that Acceleration/Deceleration is a signal of an earlier warning, it gives you evident a

Challenger EA is a fully automated Expert Advisor. The EA is a medium-term scalper. Our EA has been created to work confidentially. So, it can close orders with actual account currency value at profit or loss. Also works with stop loss. The EA's strategy has been improved to make reasonable and low-medium risk profit. But, you can also increase your risk, although we do not recommend doing that. The EA opens trades when these events occur; The EA searches a main trend. Then, waits for a medium t
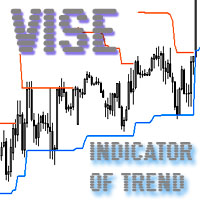
Vise is a trend indicator. The upper and lower lines follow the price showing the prevailing price direction. Frequent breakthroughs of the upper line indicate a bullish trend, while frequent breakthroughs of the lower line indicate a bearish one.
Parameters Points for UpLine - initial number of points for the upper line; Points for DownLine - initial number of points for the lower line. During the breakthrough of the upper level (line), this level shifts upwards by Points for UpLine. If the u

This is a trend following indicator that identifies optimal entry points in the d irection of a trend with an objective stop loss to manage the trade. The indicator allows you to catch trend early and ride it. The Indicator draws resistance line as it detects an Uptrend and draws support line when it detects a D owntrend on the chart. When those levels are broken that allows you to identify the Trend Direction and Momentum in the direction of prevailing trend which offers optimal entry points in

The Envelopes indicator determines the presence of a trend or flat. It has 3 types of signals, shows the probable retracement levels and levels of the possible targets. The Fibonacci coefficients are used in the indicator's calculations. Signals (generated when touching the lines or rebounding from lines): Trend - the middle line of the Envelopes has a distinct inclination; the lines below the channel's middle line are used for buy trades, the lines above the middle line and the middle line itse

The indicator calculates the price of the trading instrument based on the RSI percentage level. The calculation is performed by Close prices, so that we can quickly find out the price, at which RSI shows the specified percentage level. This allows you to preliminarily place stop levels (Stop Loss and Take Profit) and pending orders according to significant RSI points with greater accuracy. The indicator clearly shows that RSI levels constantly change, and the difference between them is not fixed

Ozi Arrow is a unique indicator that can display signals in the direction of the main trend and counter trend signals. For calculations, the indicator determines a price channel. If recently the price was at its borders, and all conditions of additional filters are observed, a signal is displayed in the form of arrows. Ozi Arrow is suitable for any timeframe and any pair. The indicator signals do not disappear under any conditions. A distinctive feature is the presence of a trend filter. If the

The EuroSession indicator combines filtering by a modified MACD and a trend based indicator. It is an indicator that tries to capture the early market move of the European session. This would mean that pending orders have to be placed way ahead of this move. BUY Pending orders (Buystop) should be placed if: Trend-Bias shows 'UP' MACD Bias shows 'Relatively UP' SELL Pending orders (Sellstop) should be placed if: Trend-Bias shows 'DOWN' MACD Bias shows 'Relatively DOWN' The currency pairs are: EUR

This is an EA trading strategy that tries to recover the lost trade. This tactic helps in just the right direction once and the profit takers will be able to stop the previous loss. The game is restarted. It works based on the trend and automatically closes if the trend reverses. Simple configuration, easy installation, complete automation. Before you start using EA in your real account, you should find out how the system works in Backtest mode.
Requirements and recommendations Deposit min 10.

Twinkle is a trend-based scalper using stop loss and take profit invisible to the broker. The EA does not look for trend reversals. The EA catches strong market movements and opens orders in the direction of the trend. Your broker will not see the order closing levels. The EA closes orders independently when reaching the take profit or stop loss levels specified in the settings. Recommended trading symbols: EURUSD M5, GBPUSD M5. ECN accounts with 5 digits quotes are recommended.
Expert Advisor

The indicator identifies trends and micro-trends, perfectly suited for those who prefer scalping. It has been developed for working on the M1 timeframe, however it also shows clear trends on the higher timeframes for long-term positions. The indicator does not redraw. The history data of the charts and prices are used for indication. This is the basis for the indicator. If the price is in the blue channel, the trend is bullish. If the price is in the red channel, the trend is bearish. It allows
MACD (Moving Average Convergence/Divergence) is a classical trading indicator used in technical analysis from late 1970s. It is supposed to reveal changes in the strength, direction, momentum, and duration of a trend currencies price (also stocks, commodities etc). The New MACD indicator is an advanced model of the standard MACD indicator. You may use the New MACD absolutely the same way as classical. The main difference is that New MACD is working faster (in case of similar input parameters).

One simple helper for your business. One click to open an order to buy or sell with your settings. You can open more information and obtain the average of all inputs depending on the setting. One click on the buttons and operations in this market are done!
Inputs Comments - additional comment to orders Lots - initial lot Lot exponent - value the lot should be multiplied by when the next generation is placed Maximum lot size - maximum size of the lot Magic number Take profit Take profit for mor

Gold Trust is a trading robot based on bidirectional martingale system. Buy and sell positions are opened simultaneously allowing you to make profit regardless of a trend direction.
Usage tips Symbol: GBPUSD . Period: H1 . ECN accounts with low spreads are recommended! Deposit: 10 000 USD or 10 000 cents. It works around the clock, VPS is recommended.
Advantages Suitable both for a rapid deposit boost and stable low-risk trading. High profit factor and mathematical expectation. Fast optimize

The Infinity Expert Advisor is a scalper. When the resistance and support levels are broken, trades are opened in the direction of the price movement. Open positions are managed by several algorithms based on the current market situation (fixed stop loss and take profit, trailing stop, holding positions in case of trend indication, etc.).
Requirements for the broker The EA is sensitive to spread, slippages and execution quality. It is strongly recommended not to use the EA for currencies with

The Navigator Trend is an interesting indicator very easy to use. Apply this indicator on the chart to navigate very quickly through all the symbols and timeframes listed in inputs. In addition it includes a trend condition that will alert you with a color about the direction and the market trend. Use it in confluent way to get very good operating ideas. You can customize both the graphic colors and the list of symbols to display. A quick and easy tool that it will help to analyse the charts. In

Determining the current trend is one of the most important tasks of a trading regardless of the trading style. The Atom Trend indicator can help in doing that with a fairly high probability. Atom Trend is a trend recognition indicator, which uses an original calculation algorithm. You can use it on any currency pair and every time frame. It does not change its values. The tick volume can also be used in the calculations as an additional filter.
Indicator Parameters Main Settings : VolMode - if
MetaTraderマーケットは、開発者がトレーディングアプリを販売するシンプルで便利なサイトです。
プロダクトを投稿するのをお手伝いし、マーケットのためにプロダクト記載を準備する方法を説明します。マーケットのすべてのアプリは暗号化によって守られ、購入者のコンピュータでしか動作しません。違法なコピーは不可能です。
取引の機会を逃しています。
- 無料取引アプリ
- 8千を超えるシグナルをコピー
- 金融ニュースで金融マーケットを探索
新規登録
ログイン