YouTubeにあるマーケットチュートリアルビデオをご覧ください
ロボットや指標を購入する
仮想ホスティングで
EAを実行
EAを実行
ロボットや指標を購入前にテストする
マーケットで収入を得る
販売のためにプロダクトをプレゼンテーションする方法
MetaTrader 4のためのエキスパートアドバイザーとインディケータ - 35

Candle Power Signals is a trend indicator that uses a strategy of searching for potential volatile signals to make trading decisions.
By analyzing the market, the indicator identifies zones of increased and decreased volatility within the directional trend movement.
The main signal generation parameters have already been configured, the remaining settings and periods are indexed into 2 parameters for manual configuration:
1. "Candle calculation method" - 2 signal generation modes, it is rec
THE CONCEPT - EARLY ADOPTER PRICE @ $499.99 ONLY!!!
There are 3 terms that you'll normally come across in trading: Support and Resistance / Supply and Demand Trend Crossovers Many traders use a combination of one or two of the above mentioned to form their unique trading strategies because with them included, traders are able to make sound analysis and therefore predictions. RangeMAX trades based on a strategy that uses ALL THREE elements mentioned above!
SETFILE: https://www.mql5.com/e

Unlike most other EAs in the market, I always assure every single of my EAs are of highest quality: Real trades will match backtesting. No loss hiden techniques to hide historical losses, no manipulated backtest to make backtesting curve smooth without loss (only naive traders believe in smooth upward curve with no risk - they are most likely scamming). My EA always have multi-years verified statistical trading edge. Robust and long term stable with sensible risk management. Not sensitive to sp

Golden Man is a unique advisor for trading in the gold market (XAUUSD) on the Meta trader platform, which combines modern technologies such as big data processing, unsupervised learning, cloud computing and machine learning. Features of Golden Man: Big Data: Golden Man uses massive volumes of data on the gold market to analyze and identify hidden patterns. Big data processing allows for more accurate forecasting of future price movements.. Unsupervised Learning: The advisor learns independently
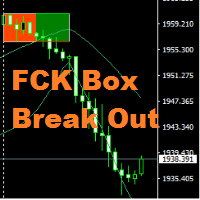
Hi All, " FCK Box Break Out " indicator is very simple indicator for new users. You can choose which indicators and timeframes you want to calculate. "FCK Box Break Out" provides the day's trend for buy/sell trades. Opposite side you the stop loss or hedging trade. NON-REPAINT Buy/Sell signals Recommendations Timeframes: Recommended - H 1 (Still, EA technically works on any Time frames ) Spread : up to 20 Recommended pairs: works on any metal, indices and currency pair
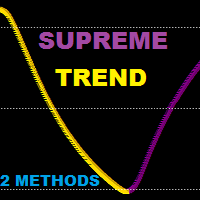
Supreme Trend is a reversal/continuation type Oscillator type indicator that is based on Moving average and stochastic indicators this indicator can be used in two methods : Reversal Method : short when golden arrow appear after arrows were above upper level (e.g 70) Reversal Method : long when Purple arrow appear after arrows were below lower level (e.g 30) Trend Method : long when arrows cross above 50 level line , short when arrows cross below 50 level line. use higher ma and stochastic peri
Designed with advanced algorithms and utilizing deep learning technology, our Dark TradinG MT4 (EA) is crafted to assist you in the intricate world of forex trading. The system analyzes market behaviors and conducts transactions based on specific criteria, empowering you to engage with market trends more effectively. With the backing of nearly a decade of data, the EA employs deep learning to examine past market conditions, aiming to provide enhanced decision-making.
Recommendations:
Curre
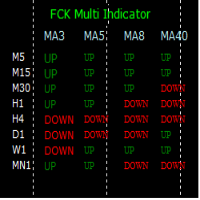
The FCK Multi Indicator for MT4 displays trend direction of multiple indicators on multiple time frames for a pair. So, forex traders can see the trend direction at a snap and trade with confluence of multiple indicators. Furthermore, it helps traders to see the trend in multiple time frames and trade in the direction of the overall market trend. Additionally, it shows the stop loss, pips to stop, pips in profit of any open position. The indicator display is very neat and is very helpful for bot

Bot DataSource AC is an automatic trading tool developed by the author based on the DataSource AC indicator. https://www.mql5.com/en/market/product/108165 indicator DataSource AC. The bot must be launched on the EURUSD H1 time period; it is optimized for this environment. Although if we consider the bot as a tool, then you can optimize the bot on any other time frame and currency pair. The principle of optimization when used on H1 is the following: we optimize at opening prices for 3

I am the owner of EA Matoa [MT4] . This is the MT4 version, if you are interested in copying the MT4 version, please copy it in this account https://www.mql5.com/en/signals/2100341 EA Matoa [MT4] is a full automatic trading system base on martingale on pair EURUSD only. Minimum balance to trade with this EA is: 1. Leverage 1:500 minimum $2000 2. Leverage 1:200 minimum $5000 3. Leverage 1:100 minimum $10000
The strategy is: #1 - Place an order according to the direction of the market

I am the owner of EA KingKong. This is the MT4 version, if you are interested in copying the MT4 version, please copy it in this account https://www.mql5.com/en/signals/2114953
EA KingKong is a full automatic trading system base on martingale on pair EURUSD only. Minimum balance to trade with this EA is: 1. Leverage 1:500 minimum $3000 2. Leverage 1:200 minimum $7500 3. Leverage 1:100 minimum $10000
The strategy is: #1 - Place an order according to the direction of the market trend. #2 -
The presented indicator is based on a slow digital filter (RSTL) with the help of which a long-term trend is predicted. This product marks trend reversal points and support/resistance lines. The indicator has six calculation options: 1. Identifies the closing price leaving the channel; 2. Identifies the exit/entry of the closing price outside the channel; 3. Identifies the closing price leaving the channel and sideways price movement; 4. Identifies the average price going beyond the channel; 5.
The presented indicator is based on a fast digital filter (RFTL) with the help of which a short-term trend is predicted. This product marks trend reversal points and support/resistance lines. The indicator has six calculation options: 1. Identifies the closing price leaving the channel; 2. Identifies the exit/entry of the closing price outside the channel; 3. Identifies the closing price leaving the channel and sideways price movement; 4. Identifies the average price going beyond the channel; 5.
Unlock the power of trend continuation with TrendWizard, your ultimate companion in the world of Forex and financial trading ,
Are you tired of missing out on profitable trend continuation opportunities?
Look no further – TrendWizard is here to elevate your trading game and maximize your profits. --This EA is based on WH Trend Continuation MT4 with custom setting and other EA features-- MT5 Version : WH TrendWizard MT5 -This EA does NOT use : No Martingale - No Grid - No
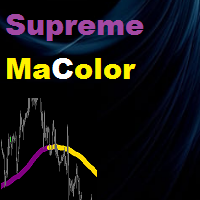
Supreme MaColor is an indicator based on moving average indicator , it gives up and down trend colors and it has different moving averages types and has multi time frame function , this indicator does not repaint/back-paint/delay signal. =================================================================================== Parameters : Timeframe (what time frame to use to draw Supreme Ma) Ma Period Ma Type Ma Price (close/open...etc) Average Shift (Ma shift) Multi Time frame on/off ===============
Welcome to the world of advanced trading with the Moving Average Crossover Multicurrency Scanner! Elevate your trading experience with our powerful MT4 indicator designed for seamless analysis and real-time insights. Key Features: Effortless Moving Average Crossover Scanning: Unlock the full potential of the Moving Average Crossover Multicurrency Scanner by effortlessly scanning multiple currency pairs. Receive instant alerts when specific Moving Average Crossover conditions are met, ensuring y

Ea makes what 90% of traders do not do. Leave profits run. Makes little trades, but very consistent. takes a long time to open and close a trade. Ea looks after a combination of variable grid, and several trend indicators. Configuration in this version for a 1:500 leverage, EURUSD market, and M1 and minimum capital of 1.000 EUR or USD. For ZERO risk you will need 2.000 EUR or USD. Obviously the return rate drops off a 50% Any other configuration can be done, as ea works for all periods.
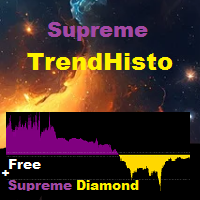
Supreme TrendHisto は、下降トレンドシグナルと上昇トレンドシグナルを与えるトレンドインジケーターです。インジケーターはヒストグラムとして機能し、インジケーターは再描画/バックペイント/遅延を行いません。
戦略
買いトレード: ヒストグラムが 0.65 を超えるクロスで、買いトレードを開始します。エグジットに関しては、ヒストグラムが 0.70 レベルに達したときにエグジットするか、十分にエグジットできます。
売りトレード: ヒストグラムが -0.65 を下回るクロス、買いトレードを開始します。エグジットに関しては、ヒストグラムが -0.70 レベルに達したときにエグジットするか、十分なレベルでエグジットできます。 ===============================
推奨される期間 : 任意
推奨期間 : デフォルト
==========================================
パラメーター :
1.インジケーター期間(スキャルピングの場合は低く、スイングトレードの場合は高くなります)
2.計算タイ

EA Grid- BollSto is a hybrid strategy that has been tested and optimized using 99.9% tick data from 2008 to 2023. Its main signal is based on Bollinger Bands, with Stochastic as a confirming signal to identify trends. It can be used on various timeframes such as M15, M30, H1, H4, and D1, with customizable settings. * Recommended to use 1 timeframe per 1 account to limit risk. The risk management system allows you to choose your preferred risk level. The user-friendly interface, coupled with hig

The Ari Drive expert system works with ticks on any type of account. For the internal algorithm, the elementary unit of analysis is the tick.
The expert system does not use the history stored in the database to operate. For his own needs, he uploads historical data online, creating his own database. To achieve good results in real tick mode on the tester, it is necessary to carry out optimization.
The internal optimizer, having carried out optimization according to the specified princip
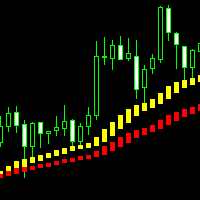
这是 一款可以直观识别波段趋势的分析指标,手工交易最佳选择,不重绘不漂移。 适应任何新手和量化交易的朋友。 参数设置(您购买指标后若不知道如何使用,请私信我): 快线: g_period_88 20
慢线: g_period_88 40
===========交易信号 ===========
快线:黄/蓝线;慢线:红/绿线 多头方向:快线上穿慢线,快线在慢线上方 空头方向:快线下穿慢线,快线在慢线下方
做多信号: 当快线上穿慢线形成一轮多头方向时,首轮多单进场条件为出现两根以上连续阴线,第3根以上K线出现一根阳线,且收盘价格在慢线上方,慢线为红线,即可成交第一单多单,同时如果满足价格回踩触碰到快线,出现一条阳线,且收盘价格在慢线上方,慢线为红线时,也可成交第一单多单;当第一轮多单结束后,此轮多头方向的多单只能满足价格回踩触碰到快线后,出现一条阳线收盘价格在慢线上方,慢线为红线时,才可继续做多进场,即不管快线是黄线或蓝线,只要阳线收盘价格在慢线上方,慢线为红线时就可以做多进场;当快线在慢线上方,阳线收盘价格在慢线上方,但慢线为绿线时,则不进场
做空信号: 当快线下穿
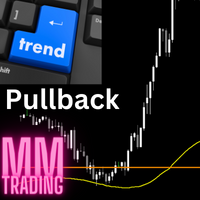
This indicator is not an ordinary moving avarage, even if it behaves similarly. I really like to use this to identify pullbacks. I only use this strategy once a day for one instrument, not more often. It is best if the price is further away from the line in the morning and when the pullback occurs, then you can create an entry setup using this indicator. Use additional indicators or use this as a supplement to your existing strategy.
This is not a holy grail. A pullback can quickly become a t
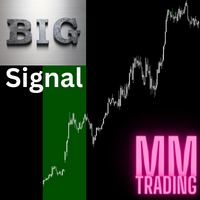
This is a multi-timeframe indicator that collects data from multiple time frames. It tries to identify the trend and predict a pullback. You have to understand that trends emerge suddenly and with that the pullback turns into a new trend. This is not a holy grail, always remember your stoploss. Use this indicator as a complement to your existing strategy.
The lines that are displayed on the chart can be changed so that they are only displayed in the indicator window and are therefore not dist
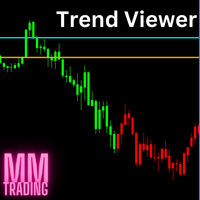
This indicator changes the color of the chart when prices are more bullish or bearish. It is recommended to use this indicator on small timeframes and only during peak trading hours. And don't forget your stop limit. This is not an oracle and not a holy grail.
In the settings, you can change the color of the candles and also their sentiment. To do this, use the Set 1 and Set 2 settings and test.

Trend analysis is perhaps the most important area of technical analysis and is the key to determining the overall direction of an instrument's movement. The Quest Trend indicator determines the prevailing trend. They help analyze the market on a selected time interval. Trends are based on the principle of higher highs, higher lows (for an uptrend) and lower highs, lower lows (for a downtrend). They can have different time periods and they can be related to each other like fractals. For example,

The Samurai EA is a specialized trading algorithm designed to excel in trading scenarios characterized by price ranges. This expert advisor (EA) is built to operate within a defined price range, which makes it ideal for traders who want to capitalize on market consolidations and avoid trading in volatile or trending conditions. Key features of the Samurai EA include: Range-Based Strategy: The EA identifies market conditions where price movements are contained within a specific range. It takes ad

The Flip Flop indicator tracks market trends, ignoring sharp fluctuations and market noise. The indicator can work both for entry points and as a filter.
The Flip Flop indicator displays information in a visual way. Helps in finding entry points during analysis. Suitable for trading on small time frames because it ignores sudden price spikes or corrections in price movements by reducing market noise around the average price.

Trend Channel is a Forex trend arrow indicator for identifying potential entry points. I like it, first of all, because it has a simple operating mechanism, adaptation to all time periods and trading tactics. Created based on a regression channel with filters. We display the signals of the Trend Channel indicator on the price function chart using a mathematical approach.
How it works: when the price breaks through the overbought/oversold zone (channel levels), a buy or sell signal is generate
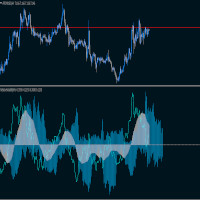
The indicator shows the deviation of the moving average relative to the volatility leading half of its period.
The red histogram shows the moving average relative to the anchor point.
The blue histogram shows volatility relative to the leading half
of the moving average.
The blue line simulates the price relative to the moving average.
The indicator is perfect for both grid trading and trend trading.
The signal does not change when the timeframe changes
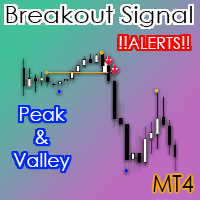
The valley and peak indicator strategy used in forex is a technical analysis approach that aims to identify potential trend reversals in the market. The strategy is based on identifying peaks and valleys in the price chart, which are points where the price reaches a high or low and then reverses direction. The valley and peak indicator is a tool that helps traders identify these patterns and generate buy and sell signals based on them. Here are the key steps involved in using the valley and pea

Product Name: Gold Glider Overview: Gold Glider is a sophisticated Expert Advisor designed for trading gold. It utilizes a specific combination of 5 different moving averages to determine the long-term, mid-term, and short-term trends, allowing it to place buy and sell trades with precision. Unlike traditional stop loss methods, Gold Glider employs a unique grid pattern strategy to exit losing positions. The EA's grid trading strategy is designed to enhance profitability while minimizing the nee

Introducing
This expert advisor is designed to work on any trading accounts and performs best on "cent" type accounts.
The algorithm analyzes the trend at high timeframes and makes market entries based on specific patterns. Live Signal: Go Pairs
XAUUSD Timeframe
H1 Features
the best performance is obtained on "cent" type accounts; for capital less than 1000 USD the use of a "cent" account is mandatory it use Stop Loss and Take Profit not compatible with prop firm accounts Settings
Gener

Introducing a sophisticated BreakOut and RecoveryZone tool designed to empower traders in any market scenario, facilitating the optimization of trade opportunities.
The core strategy revolves around executing price breakouts using BuyStop and SellStop orders to achieve specific profit targets in dollars. Notably, traders can manually set the BuyStop and SellStop levels by simply clicking and dragging lines on the chart (FixedZone=true is required).
For swift market entry, you can dr

Auto Channel Trend The Auto Channel Trend Indicator is a technical analysis tool that automatically draws trend channels on any chart. It uses a simple algorithm to identify the trend direction and then draws two parallel lines that represent the support and resistance levels of the channel. Features: Automatic trend channel drawing Support and resistance levels Trend direction identification Customizable parameters How to use: Add the indicator to your chart. Adjust the parameters to your likin

ICT Judas stands as a revolutionary trading strategy, a beacon guiding traders through the intricate dance of the financial markets. Rooted in advanced AI technology and sophisticated calculations, this strategy has an uncanny ability to decipher the enigmatic moves of the Asian trading session and unlock the treasure chest of opportunities that awaits in the London session. While its default setting shines brightest on the US30, it's ready to unveil its potential on other pairs if you dare to i

Std Channels The Std Channels Indicator is a technical indicator that uses standard deviation to create five channels around a price chart. The channels are used to identify support and resistance levels, as well as trends and reversals. The indicator is calculated by first calculating the standard deviation of the price data over a specified period of time. The channels are then created by adding and subtracting the standard deviation from the price data. The five channels are as follows: Upper
DYJは私と一緒に来てEAで、DYJ指標の仮想取引記録を追跡して、実際に倉庫と平倉を開設します。
個々の信号源のインジケータの名前と状態を表示できます; 現在、DYJ T3ModeMa指標しかないが、将来的にはもっと多くの指標が拡張されるだろう。
指標のリアルタイムトレンド方向を受信できます。
インジケータの最遅ライセンス時間を受信できます。
指標の最新入場価格を受け取ることができます。
複数の通貨ペアの収益ボタンが表示され、総持場数もボタンに表示されます。
複数通貨対取引明細書の数量を表示するボタン。 いつでも通貨ペアを削除したり、すべての通貨ペアを削除したりできます。
ボタンをクリックすると、利益の大きさに応じていつでも1つの通貨ペアの総利益またはすべての通貨ペアの利益を平倉することができます。
一度に一枚ずつ設定し、一枚あたりの固定手数を0.01などにすることができます。 または1手以上または指標取引量に従う。
動的利益追跡を設定します。
利益目標の上限を設定する。
倉庫のクローズ時に保留中の注文を自動的に削除しま

シグナルトレーディングインジケーター Sea Candles MT4は、CCIオシレーターを使用して価格の動きの方向を決定し、ポジションを開くための信号を生成します。 商品チャネル指数[CCI]-移動平均からの価格の偏差を測定します。 価格が新しい高値に達し、CCIが以前の高値を上回ることができないときに発散が表示されます。 この古典的な相違の後には、通常、価格修正が続きます。 CCIは通常±100の内で及びます。 ±100の上/下の値は、買われ過ぎ/売られ過ぎの状態と是正的な増加の確率について知らせます。
指標に関する情報 指標はローソク足の形で提示され、市場の状態に応じて4色で塗られます。
また、便宜上、インジケータに存在するすべての色はメインメニューで作成されます。
インジケータは、端末、電話、メールで通知を提供します。 色の変化に応じてトリガーされます。
指標の使い方 指標の色に応じて、私たちは売買します。 通知はすべてのケースに対して提供されます。
あなたは色と彼らがスクリーンショットで何を意味するのかを詳しく見ることができます。
また、す

The GGP Wave Trend Oscillator MT4 Indicator is a volatility and momentum tool designed to help traders optimize their trading performance and providing traders find the most accurate market reversals. This indicator is MT4 conversion of the Indicator: WaveTrend Oscillator [WT] by “ LazyBear “ in Trading View website and some alert methods are added to provide real-time alerts when a trading signal is generated, in order to allow traders to act quickly and efficiently. When the oscillator is ab
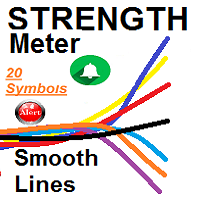
SMOOTH STRENGTH METER INDICATOR (SMOOTH LINE) it draws Currencies TREND Volatility Power / Strength lines : - Detects the 2 highly TRENDED Volatile pairs ( will be the Bold Lines ) - A very Helpful Indicator - It draws smooth lines for up to 20 currencies pairs representing Volatility strength and power - First it indicates the most powerful trended direction pairs : Strongest / Weaker - MAIN FUNCTION :it gives indication of the UP trend most Volatile Line and the

//// Forex Bulls AUD CAD ////
An expert based on ( AUD , CAD )
Time frame = M15
Live Signal 1 = Live Signal 2 = it is a fully automated “pullback” trading system, which is especially effective in trading on popular “pullback” currency pair : AUD , CAD The system uses the main patte

The Range Detector indicator calculates the price range between the highest and lowest prices over a specified period and visually represents this range on the price chart. It provides valuable insights into market volatility, helping traders identify potential breakout or reversal points. How it Works: Calculation of Range: 1. The indicator first calculates the price range by finding the highest high and lowest low prices over a user-defined period, often using a specific number of candles
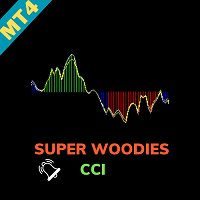
Super Woodies CCI Indicator - Enhance Your Trading Precision Step into the realm of precision trading with the "Super Woodies CCI Indicator" for MetaTrader 4. This advanced tool, inspired by Woodie's CCI, is designed to provide you with clear insights into market trends, enabling you to make well-informed trading decisions. Basic Details : Indicator Type : Super Woodies CCI Indicator Key Metrics : Real-time CCI (Commodity Channel Index) analysis for price trends. Customization : Fully customizab

Description: Unlock the power of numerology in your trading with our unique Numerology Indicator. This indicator is meticulously designed to provide traders with insights based on numerology principles and 0.7 values, offering a fresh perspective on market analysis. How It Works: Our Numerology Indicator leverages the ancient wisdom of numerology, which assigns numerical significance to various aspects of life. In the context of trading, we've harnessed the mystical power of 0.7 values, aligning
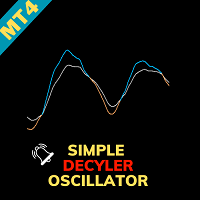
Welcome to the Simple Decycler Oscillator, a powerful indicator designed to enhance your trading experience. This user guide provides comprehensive insights into using the indicator effectively, ensuring you make informed trading decisions. Overview The Simple Decycler Oscillator is a versatile tool that combines two Decyclers, utilizing periods of 100 (fast - green) and 125 (slow - blue). This dual approach, akin to moving averages, facilitates trend identification through a straightforward cr

Blacklist Trader MT4 EA Basic Background Parameters: Win Rate: 74% Back test period – From: 2023.01.02 Back test period – To: 2023.09.01 Period/Timeframe: M15 Symbol/Currency pair: AUDUSD , Australian Dollar vs US Dollar Spread: Current Input Parameters: Default About the EA Development: The Blacklist Trader EA is a highly intelligent trading system. We spent a lot of time working on it and improving it with live tests. We have been developing it since 2021 and it proved to be quite profitable,
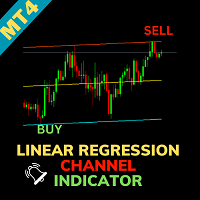
Linear Regression Channel Indicator - Visualize Trends with Precision Enter the world of precision trading with the "Linear Regression Channel Indicator" for MetaTrader 4. This versatile tool, based on linear regression analysis, provides you with a clear visual representation of market trends, enabling you to make well-informed trading decisions. Basic Details : Indicator Type : Linear Regression Channel Indicator Key Metrics : Real-time price trend analysis through linear regression. Customiza

The " Rsi Monitor Screen " is a powerful and versatile MetaTrader 4 (MT4) indicator designed to provide a comprehensive overview of the Relative Strength Index (RSI) across multiple timeframes on a single screen. This tool is essential for traders seeking a holistic view of RSI data, enabling informed decision-making and precise analysis. Key Features: Multi-Timeframe RSI Display: This indicator displays RSI values for various timeframes, from M1 (1 minute) to MN1 (monthly), all on a single, use

Soft Fine Grid EA is a fully automatic expert advisor using the very accurate strategy for both initial and grid orders. The EA can trade any currency pairs with one preset that provides high diversification and smooth growth of equity. In spite of using grids the EA is designed to long-term trading with minimal risk. Monitoring: https://www.mql5.com/en/signals/2041982
Requirements
Minimal deposit: 1000$ Account type: any Currency pairs: any Time frame: M1 Преимущества Long-term trading
Smal

Introducing the Accumulated RSI, your ultimate tool for precise trend identification and momentum analysis in the world of Forex and financial markets. This cutting-edge MetaTrader 4 (MT4) indicator, designed for traders seeking unparalleled insight and accuracy, empowers you to make well-informed trading decisions like never before. Features Accurate Trend Detection: The Accumulated RSI utilizes the Relative Strength Index (RSI) in an innovative way to pinpoint the prevailing market trends wit
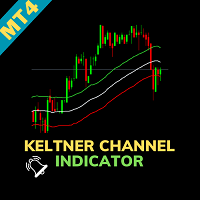
Keltner Channel Indicator - Uncover Market Trends with Precision Welcome to the world of precision trading with the "Keltner Channel Indicator" for MetaTrader 4. This powerful tool, inspired by Chester Keltner's work, helps you analyze price movements and identify potential trends with remarkable accuracy. Basic Details : Indicator Type : Keltner Channel Indicator Key Metrics : Real-time price volatility analysis. Customization : Fully customizable settings to align with your unique trading stra

The True Magic Oscillator indicator is designed for signal trading. This indicator generates trend signals.
It uses many algorithms and indicators to generate this signal. It tries to generate signals from the points with the highest trend potential.
This indicator is a complete trading product. This indicator does not need any additional indicators.
The indicator is never repainted. The point at which the signal is given does not change.
Features and Recommendations Wor

Hello dear,
I would like to introduce you to the strategy of EA Marti Hedge Master version 2.0 - an excellent combination of Hedge and Martingale, designed to maximize performance in trading.
The strategy of EA Marti Hedge Master focuses solely on trading gold (XAUUSD) on the M30 timeframe. By analyzing the combination of key indicators such as ADX and Bands, the robot will determine optimal entry points to seize potential trading opportunities.
Here, I solely focus on gold, XAUUSD.
The

GG TrendBar Indicator - Your Multitimeframe ADX Trading Solution Experience the power of multi-timeframe trading with the "GG TrendBar Indicator." This versatile tool, built upon the ADX indicator, offers precise insights by considering multiple timeframes, ensuring you make well-informed trading decisions. Basic Details : Indicator Type : GG TrendBar Indicator (Multi-Timeframe ADX) Key Metrics : Real-time ADX analysis across multiple timeframes. Customization : Enable or disable specific timefr

The EA's Development Background: The FXGold Machine is a highly intelligent and sophisticated trading system for the MT4 trading platform developed in MQL4. It took a lot of our effort to develop and test in real-world settings . We started working on it in 2021, and after seeing how profitable it was, we automated it by adding an algorithm. Since then, a number of changes have been made to the EA to increase its accuracy in trading. The default settings are made for AUDUSD on 15M price chart P
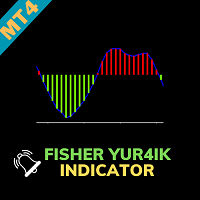
Fisher Yur4ik Indicator - Unlock Precise Trading Insights Explore a world of precision in trading with the "Fisher Yur4ik Indicator." This advanced tool is designed to provide traders with accurate insights into price trends, allowing for well-informed decisions and enhanced profitability. Basic Details : Indicator Type : Fisher Yur4ik Indicator Key Metrics : Real-time analysis of price trends and potential turning points. Customization : Fully customizable settings to align with your unique tra

The expert works to open global markets From this option, the beginning of the work of the London market is controlled BarHour1 When working on EXNESS platform The start of the London market is at 07:00 And control the operation of the second time from BarHour2 New York market at 13:30 When the market works digitally, the expert works to determine the trend With a trade opened and an opposite pending trade pending The expert is placed on more than one currency pair and also placed on gold With
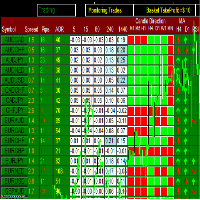
Hi Friends, " FCK Currency Strength Pro " is a auto & semi auto trading expert with direction of pair. Buy-Sell separate or multi currency in one click. The strategy of FCK Currency Strength Pro is a combination of custom indicator, Trendlines, Support & Resistance levels ( Price Action ) and most important secretive trading algorithm mentioned above. Download News Ex4 and csv file You need the following SDSnews.ex4 in MQL4/Libraries and the daylightsavings.csv in MQL4/Files.
Only 4 of 5 cop
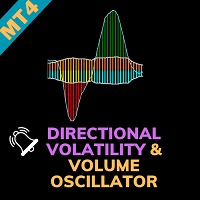
Directional Volatility & Volume Oscillator - Unleash Your Trading Potential Welcome to a new era of trading excellence with the "Directional Volatility & Volume Oscillator." This innovative indicator is engineered to provide you with essential insights into market volatility and volume, empowering you to make well-informed trading decisions. Basic Details : Indicator Type : Directional Volatility & Volume Oscillator Key Metrics : Real-time volatility and volume insights for precise trading analy

Sometimes there is money to be made in simplicity! The DAX Bull works using a simple moving average both for short and long. It has an advanced order and trailing system which essentially helps in hitting those big wins. This bot is a trend bot and as such expect win rate to be around 40%, expect around 13-20 trades per month. As always, judge more on live signals and your own backtesting! If you have questions just message me on MQL5.
My main selling point as a EA creator? Brutal honesty. I

Description:
This indicator (with its Fibonacci algorithm) marks Buy and Sell zones, which indicate where a trend has a higher probability of continuing either upward, or downward.
Additionally, there are horizontal lines drawn for each day, which show a high probability level of where price is likely to break out, and continue either higher, or lower. This indicator will never repaint.
Features: The main strength of this indicator is that the user is able to visually assess what the

Next level of trend trading here. Possibility 75%, the indicator analyzes the current market to determine short (small dot), middle (circle with a dot inside) and long (cross with a circle and a dot inside) trends. Wingdings characters of Aqua color represents the beginning of the UP trend. Wingdings characters of Orange color represents the beginning of the DOWN trend. Possibility 75% Indicator will improve your trading in the world of forex, commodities, cryptocurrencies and indices.

The ENG TREND is a powerful tool designed for traders in the forex and financial markets who seek a unique approach to identifying support and resistance levels. This indicator leverages the principles of numerology, a discipline that explores the mystical and symbolic meanings of numbers, to create a trend analysis method that goes beyond traditional technical analysis. Key Features: Numerology-Based Analysis: The ENG TREND applies numerology principles to price data, allowing traders to uncove
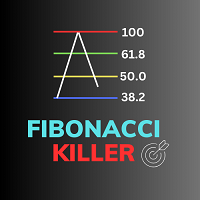
Fibonacci Killer - Your Ultimate Trading Assistant Are you ready to take your trading to the next level? Introducing Fibonacci Killer, the ultimate trading indicator designed to help you spot critical trading opportunities like never before. Key Features : Fibonacci Magic : Fibonacci Killer harnesses the power of Fibonacci retracement levels to provide you with precise entry signals. It monitors the market and generates signals as soon as a new candle begins, giving you a head start in your trad

Description This Expert Advisor uses a proprietary indicator for market entries and it can generate an average profit of 8% monthly!
It can work with any forex pair but the best performance is achievable with USDCAD.
Not compatible with prop firm accounts. Recommended pairs USDCAD Timeframe
M5 Settings General Open New Trades - allows or inhibits the opening of new trades, does not act on the martingale which is still opened if necessary Risk Level - allows you to select the risk level Max S
The presented indicator is a joint application of the FATL digital filter and the Ehlers filter (J. F. Ehlers). This indicator gives reliable signals with a small delay, which makes trading based on it very effective. After receiving the signal, you should wait for its confirmation - overcoming the high/low of the bar on which the signal was given by the price.
It is recommended to pay attention to divergence or convergence signals (discrepancy in the ratio of new highs or lows on the oscillat

A universal pulse indicator for finding an entry point for a trend breakdown, followed by transaction tracking at Fibonacci levels without redrawing. The indicator itself is an independent trading system designed for intraday trading on the M5 time frame, but it also performs well on large timings. Trading on the indicator occurs exclusively with pending orders, which allows you to solve one of the biggest problems of any trader, these are trend - flat definitions. The essence is to filter out

xBrat Range Breakout For The MT4 Platform. Designed to help define opening ranges of major markets, along with Gold Pit opens, Oil Pit opens and for major economic data points. We recommend timeframes for opening ranges on different type of instruments further down this description.
The xBrat Range Breakout combines the xBrat indicator with the range breakouts. It identifies price movements, market momentum, and trends. MT4 xBrat Range Breakout isn’t only about finding breakout chances. It hel

Bollinger Squeeze Trend Indicator is a technical analysis tool used in the investment and trading world. This indicator helps identify market trends by analyzing the price movements of assets.
The Bollinger Squeeze Trend Indicator uses a variation of Bollinger Bands and focuses specifically on the relationships between volatility and price movements. Essentially, the Bollinger Squeeze Trend indicator is designed to recognize periods of narrowing and widening of bands. This can help identify p

Are you looking for a reliable tool to help you identify trends in the Forex market? Look no further! Introducing "Trend Spotting," your ultimate trend identification solution for MetaTrader 4 (MT4).
How to determine the trend: Down Trend: As soon as the Yellow signal line is below zero, the Green Slow Trend line is below zero and the main trend osliator falls below zero, it means that the downtrend has started. Up Trend: When the Yellow signal line is above zero, the Green Slow Trend line is
MetaTraderプラットフォームのためのアプリのストアであるMetaTraderアプリストアで自動売買ロボットを購入する方法をご覧ください。
MQL5.community支払いシステムでは、PayPalや銀行カードおよび人気の支払いシステムを通してトランザクションをすることができます。ご満足いただけるように購入前に自動売買ロボットをテストすることを強くお勧めします。
取引の機会を逃しています。
- 無料取引アプリ
- 8千を超えるシグナルをコピー
- 金融ニュースで金融マーケットを探索
新規登録
ログイン