YouTubeにあるマーケットチュートリアルビデオをご覧ください
ロボットや指標を購入する
仮想ホスティングで
EAを実行
EAを実行
ロボットや指標を購入前にテストする
マーケットで収入を得る
販売のためにプロダクトをプレゼンテーションする方法
MetaTrader 4のためのエキスパートアドバイザーとインディケータ - 210

Please read the comment section for more introduction about indicator. ( i cant put all lines in here their is limit ) Entry conditions ---------------- Scalping - Long = Green over Red, Short = Red over Green Active - Long = Green over Red & Yellow lines Short = Red over Green & Yellow lines Moderate - Long = Green over Red, Yellow, & 50 lines

Matrix MT4
Matrix MT4 is an Expert Advisor (EA) multi currency, trading based on the steps of the Fibonacci sequence and allows users to help when the market is unfavorable and EA can't handle it, this makes EA really perform well in the market. The EA works on all timeframes without losing its profitability, Recommended pairs for users GBPUSD, EURUSD, GBPCHF, USDCAD. Parameters
MagicNumber EA: Magic Number of Expert Advisor. Comment: Comment. Stop Trade %: % of capital allowed for

BigPIPS EA is an Expert Advisor based on special mathematical analysis and smart modeling of market and signals independent of timeframe. The EA has a powerful calculation engine that can predict market movement over 1000 pips (10000 points). The EA signal engine does not need any optimization and there are no settings for signal. All settings of EA are for Money Management.
The EA works with a low margin level and thus has low risk. The EA can trade on all Forex Pairs, Cryptos, Stocks, Indice

Powerful Trading Tool for Your Desired Results This tool can help you achieve the trading results you want. It's a 2-in-1 solution, suitable for both Binary Options and Forex trading. Key Features: Versatility: It serves as a versatile tool for trading both Binary Options and Forex markets. Consistent Performance: The indicator demonstrates excellent performance on both Binary Options and Forex markets. Continuous Improvement: The tool will continue to be enhanced to meet evolving trading
Kill pips Expert Advisor は、取引アルゴリズムの共生です。主要な通貨ペアを取引するために設計されています。障害に対する保護機能があります。接続が復元されると、アドバイザは引き続きその命令を処理します。トレーリングおよび取引時間間隔の高度な設定により、EA がコンピューターおよび VPS 上で正しく動作することが可能になります。ロボットは、取引ポジション、スリッページ、スプレッドの変更の量を制御します。手数料と現在のボラティリティを考慮してトレーリングを自動的に調整し、エントリーシグナルを決定するためにボラティリティチャンネルを選択し、入力シグナルの決定の信頼性を計算し、オープンオーダーを維持および保護し、あらゆる入金サイズで機能します。 *** Live Signal ** >>> Live 1 <<<

TrendScanner XTra scans market trends from Multi Symbols and Multi Timeframes with extra additional Entry Point Signals arrow on the current chart. Features:
-Entry Point SIgnals : This is additional feature in the indicator. No repaint arrows. The Trading system in the single indicator. MTF Trend informations and Entry Signals. In order to make it easier for trader to get trading moments from a single chart and deciding entry time. -Changeable Panel Display : Change the value of Max.Symbol

As you know, the main invariable indicator of all traders is the moving average; it is used in some way in most strategies. It is also obvious that this indicator is capable of showing good entries in every local area. For which it usually needs to be optimized or just visually adjusted. This development is intended for automatic optimization of the indicator. Once placed on the chart, the indicator will automatically re-optimize itself with the specified period ( PeriodReOptimization ) and dis
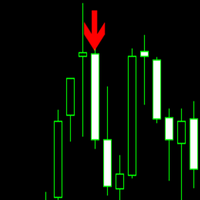
Trade trends with the Super Scalper Use on all time frames and assets it is designed for scalping trends. Works good on small time frames for day trading. The arrows are easy to follow. This is a simple no repaint/no recalculate arrow indicator to follow trends with. Use in conjunction with your own system or use moving averages. Always use stops just below or above the last swing point or your own money management system The indicator comes with push notifications, sound alerts and email

The Salinui trend indicator works using a special algorithm. It finds the current trend based on many factors. Indicator entry points should be used as potential market reversal points. Simple and convenient indicator. The user can easily see the trends. The default indicator settings are quite effective most of the time. Thus, all entry points will be optimal points at which movement changes. You can customize the indicator based on your needs.
You can use this indicator alone or in combinati

The King of Forex Trend Cloud Indicator is a trend following indicator based on moving averages. The Indicator is meant to Capture both the beginning and the end of a trend. This indicator can be used to predict both short and long terms market trends. The king of Forex Trend Cloud if paired together with the King of Forex Trend Indicator can give a broad picture in market analysis and forecasts. I have attached images for both the The king of Forex Trend Cloud on its own and The king of Fore
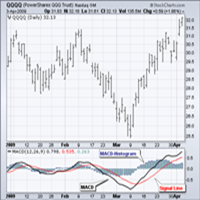
Standard MACD is the 12-day Exponential Moving Average (EMA) less the 26-day EMA. Closing prices are used to form the MACD's moving averages. A 9-day EMA of MACD is plotted along side to act as a signal line to identify turns in the indicator. The MACD-Histogram represents the difference between MACD and its 9-day EMA, the signal line. The histogram is positive when MACD is above its 9-day EMA and negative when MACD is below its 9-day EMA. Peak-Trough Divergence The MACD-Histogram anticipate

購入後:-電報 https://t.me/SmartForex777で私に連絡してください EA HAVEタイムフィルターコントローラーが含まれ、任意のセッション時間で自動取引をオン/オフで停止するためのサポートEa、設定で選択-アジアを使用、ロンドンを使用、NewYorkを使用次にEa自動取引を自動的に停止して開始... .............。
警告--->>すべての詳細を注意深くお読みください
--->>Defult設定を使用しないでください。
SET FILE ---> $ 1000 SET FILE
https://c.mql5.com/31/713/EASK1.3_M1_Gold_2Digit__1.set https://c.mql5.com/31/713/EASK1.3_M1_Gold_3Digit__1.set
サポートとレジスタンスライン戦略を使用するEAスマートキング、それはまた、買いまたは売りの傾向に従います。
コメントボッ

Entry Point EA 10 copies out of 10 left at $799 Next price --> $1467
Entry Point EA is the advanced scalping system which utilizes smart entry/exit algorithms with sophisticated filtering methods to identify only the safest entry points during calm periods of the market. This system is focused on a long-term stable growth. It is a professional tool developed by me years ago that is constantly updated, incorporating all the latest innovations in the trading area. Nothing fancy here, no te

The Extremum Average signal indicator works on all timeframes and any markets. Analyzes the smoothed data of extremums and gives signals to sell or buy.
The indicator has only two settings: Number of Bars - the number of last bars to search for an extremum Period Average - Period (number of last bars) for data smoothing For each timeframe and market, you need to select its own values. Additionally, in the indicator settings, you can set your own style of signal display: Size Arrow Code Arrow B

The QRSI indicator is one of the most important and well-known indicators used by traders around the world. All signals are generated at the opening of the bar. Any closing price or zero bar prices are replaced with the corresponding price of the previous bar in order to avoid false results. This indicator is suitable for those who are interested in the classic calculation method but with improved functionality. There is a version for both MT4 and MT5.
By its nature, the QRSI indicator is

The Goodfellas indicator analyzes the price behavior and if there is a temporary weakness in the trend, you can notice it from the indicator readings, as in the case of a pronounced trend change. It is not difficult to enter the market, but it is much more difficult to stay in it. With the Goodfellas indicator it will be much easier to stay in trend! This indicator allows you to analyze historical data and, based on them, display instructions for further actions on the trader's screen.
Every r

The Dictator indicator is based on the process of detecting the rate of change in price growth and allows you to find points of entry and exit from the market. a fundamental technical indicator that allows you to assess the current market situation in order to enter the market of the selected currency pair in a trend and with minimal risk. It was created on the basis of the original indicators of the search for extremes, the indicator is well suited for detecting a reversal or a large sharp jer

Gold ZigZag - ローソク足の開始時にシグナルを提供する、実際には再描画や遅延のないジグザグである矢印インジケーターです。このインジケーターは、XAUUSD ペア (ゴールド) 用に特別に設計されています。このインジケーターは他のペアでも使用できますが、元々このインジケーターはゴールドでのみ使用されることを意図していました。このインジケーターはどの時間枠でも使用できますが、H4 や D1 などのより高い時間枠をお勧めします。 このインジケーターは使いやすく、トレーダーの特別なスキルや知識は必要ありません。このインジケーターには、「長さ」と「感度」という 2 つのオープンパラメーターしかありません。これら 2 つのパラメータを操作することで、個人の取引の好みに応じてシグナルを調整できます。 PUSH通知を利用して外出先でも取引可能です。 取引のヒントと素晴らしいボーナスを入手するには、購入後にご連絡ください。 幸せで有益な取引をお祈りします。

The smart EA Copy trade for VPS / PC
Designed for MT4, it easy it super fast, it full of features, for the tutorials you can see on the uploaded photo
Parameter input: Select timer setting: select between milisecond / second timer (some broker will conflict on milisecond). Select role: select the role as master or client, but leave it default you can change later on the dashboard. Master key: input the key, ensure the key are same between master and client, you can set more than master in one

This robot is designed for major currency pairs and trades several strategies: swings, gaps and SR levels. It uses an advanced algorithm for analyzing price data and looks for the best parameters. Trading signals are filtered by results of analysis of daily and monthly chart for the last 12 periods. It is built on the foundations of the successful EA Triton . This is not a scalping robot. It is not sensitive to spread and slip. It will be traded at all brokers with quotation accurate to points

Idea: RSI ( Relative Strength Index) and CCI ( Commodity Channel Index ) are powerfull to solved the market. This indicator has Smoothed Algorithmic signal of RSI and CCI. So that, it separates the market into buy and sell zones, these areas are marked with arrows, red for downtrend, green for uptrend. This algorithm has the effect of predicting the next trend based on the historical trend, so users need to be cautious when the trend has gone many candles. Please visit screenshots

The breakout algorithm is a technique based on price, price features, to shape a breakout strategy. The strategy in this indicator will not be redrawn (none-repaint indicator), it is suitable for short or long term traders In the screenshot is the EURUSD pair, these currency pairs, commodities or stocks, it have similar strength *Non-Repainting (not redrawn) *For Metatrader4 Only *Great For Scalping *Great For Swing Trading *Arrow Entry, Green is Long, Red is Short *Works On Any Timeframe *Work

Artificial intelligence is a trend of the times and its power in decoding the market has been demonstrated in this indicator. Using a neural network to train the indicator to recognize trends and remove noise areas caused by price fluctuations, this indicator has obtained a reasonable smoothness for analyzing price trends. This indicator is none repaint. Suitable for day traders or longer traders *Non-Repainting (not redrawn) *For Metatrader4 Only *Great For Swing Trading *Histogram Up is Long,

Free version of the advisor HERE The advisor works on a diversification and hedging strategy.
Currency pairs: EURUSD - USDCHF , EURCHF - AUDNZD and other highly correlated currency pairs.
Time frame: from M5 to H4.
The advisor's strategy:
· We open one Buy deal on EURUSD;
· If you have reached profit, then close the deal; ( TakeProfit )
If the price went against us, open a new Buy deal, but already on the USDCHF pair; ( Loss to open a trend order )
· After a while, one of the pairs will

Market Profile
Shows where the price has spent more time, highlighting important levels that can be used in trading.
It is a powerful tool which is designed to take the fundamental components which comprise every market; price/volume/time, and visually display their relationship in real-time as the market develops for a pre-determined time period. Very powerful tool!

The resistance and support lines are the position where the price will have a change, be it a breakout to follow the trend or reverse. The price rule will go from support to resistance and Long's resistance can be Short's support and the opposite is true. Accurately identifying support and resistance lines is the key to being able to trade well and profitably. This indicator is based on the Fractals indicator, the indicator will be redrawn by 2 candles. *Great For Swing Trading *Blue is Support

VWAP Bands Metatrader 4 Forex Indicator
The VWAP Bands Metatrader 4 Forex indicator is a quite similar to the Bollinger bands, but it deploys volume weighted average as the core value of the bands. There is an option of using the tick volume or real volume for calculation when using the VWAP Bands Metatrader 5 custom forex indicator, especially when the forex broker displays symbol alongside real volume. Similarly, you can decide to have deviations calculated with the sample correction or not.
Newsfeed EA– Live Forex News Events In Your MT4 It is the best for trading the forex news releases. It is a handy tool that gives you information about major economic events from all over the world in your charts.
Trading The Forex News with Newsfeed Central Bank Rate Decision, GDP, CPI, Unemployment Rate, FOMC Meetings and more Forex trading is not just about technical indicators, candlestick patterns and support and resistance lines! There are many economic, social and political forces that i

Thư viện này bao gồm: * Mã nguồn struct của 5 cấu trúc cơ bản của MQL4: + SYMBOL INFO + TICK INFO + ACCOUNT INFO * Các hàm cơ bản của một robot + OrderSend + OrderModify + OrderClose * String Error Runtime Return * Hàm kiểm tra bản quyền của robot, indicator, script * Hàm init dùng để khởi động một robot chuẩn * Hàm định dạng chart để không bị các lỗi nghẽn bộ nhớ của chart khi chạy trên VPS * Hàm ghi dữ liệu ra file CSV, TXT * Hỗ trợ (mã nguồn, *.mqh): dat.ngtat@gmail.com

Thư viện các hàm thống kê dùng trong Backtest và phân tích dữ liệu * Hàm trung bình * Hàm độ lệch chuẩn * Hàm mật độ phân phối * Hàm mode * Hàm trung vị * 3 hàm đo độ tương quan - Tương quan Pearson - Tương quan thông thường - Tương quan tròn
# các hàm này được đóng gói để hỗ trợ lập trình, thống kê là một phần quan trọng trong phân tích định lượng # các hàm này hỗ trợ trên MQL4 # File MQH liên hệ: dat.ngtat@gmail.com
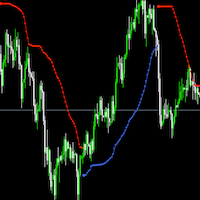
Bbandtrend 一款趋势指标,可以用来判断外汇、黄金等商品的趋势,用于辅助交易,提高交易的胜率。每个人都可以调整参数,适应不同的货币。 指标多空颜色可以自定义。 extern int Length=60; // Bollinger Bands Period extern int Deviation=1; // Deviation was 2 extern double MoneyRisk=1.00; // Offset Factor extern int Signal=1; // Display signals mode: 1-Signals & Stops; 0-only Stops; 2-only Signals; extern int Line=1; // Display line mode: 0-no,1-yes extern int Nbars=1000;
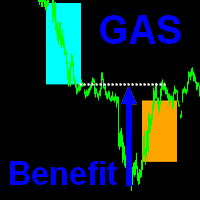
The indicator is based on the principle of closing the Gap of the American trading Session ( GAS ).
How is the Intersession Gap formed? A time interval is formed between the closing of a trading session and the opening of a new one (the next day) about 15 hours, during this time the price may deviate from the closing price in any direction. It is noticed that such deviations in 95% of cases are temporary and the price returns to the closing point of thesession. What does the indicator do? The

Price breakouts, Levels, Multi-time frame Inside bars checks for price failure to break from the previous high/low and on breakout draws a breakout box on the chart. The choice of breakout price is given to the user i.e. close or high/low of bar. Alerts can be received on breakouts. Features:- Multi-time frame Alerts, notifications & emails Usage:- Breakout signals Check how price action is evolving with the help of boxes Get multi-time frame bias

The expert works on the Fibonacci levels on the previous candle With some digital way to enter the deal On the five minute frame Work on currency pairs only Do not use TakeProfit or Stop Loss How the expert works It is placed on the three currency pairs GBPUSD GBPJPY GBP AUD Same settings without changing anything When he works, he will work on only one currency of them until it closes on a profit Profit is only seven points Please watch the video Explains how the expert works. Max Spread = 0.3

MyArrow インジケーター Nr:1 このインジケーターは、高値と安値の系列を調べることによって作成された移動平均と、グラフ上のこれらの移動平均から導出されたバンド値を超えることによって受信された信号によって作成されます。 簡単に理解できるように、下向きの矢印は有望な売りシグナルを示し、上向きの矢印は可能性のある買いシグナルを示します。 たくさんのお得... MyArrow インジケーター Nr:1 このインジケーターは、高値と安値の系列を調べることによって作成された移動平均と、グラフ上のこれらの移動平均から導出されたバンド値を超えることによって受信された信号によって作成されます。 簡単に理解できるように、下向きの矢印は有望な売りシグナルを示し、上向きの矢印は可能性のある買いシグナルを示します。 たくさんのお得...
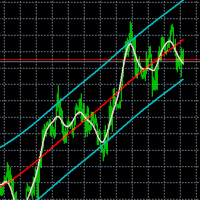
Flex channel - indicator plots channel using Hodrick-Prescott filter. Hodrick-Prescott filter is the method of avreaging time series to remove its cycling componets and shows trend. Settings HP Fast Period - number of bars to calculate fast moving average
HP Slow Period - number of bars to calculate slow moving average
Additional information in the indicator Channel width - channel width in pips at first bar MA position - fast moving average position in the channel in persentage
Close position -
The sample on the right corner of the chart uses Font Size 20. The characters/numbers will start from the right side/corner of the chart, so that when increase the font size, the text will expand out to the left/top and won't goes to the right/bottom and get hidden. Able to change these Inputs. a. Other Symbol. Current chart symbol will always be displayed. b. Fonts. c. Font size. d. Text color (All the text label, local time, bid, ask, spread, lots, number of trades, Margin, Free Margin, Mar

Software introduction.
Lofi Trading Assistant is a foreign exchange manual trading assistant software, which includes three modes of operation (1. Pure manual mode; 2. Semi-automatic mode; 3. Full automatic mode), with which you can focus your energy on the research of opening units. after the first single order, all the actions of increasing positions, stopping profit and stopping loss, and moving stopping profit will be handed over to the software to complete. Whether you are an ult

Slope Trend Robot is the Expert Advisors trading with a combination of multiple strategy trading algorithms (Trend, Level Trading, and Money Management with Martingale recovery loss to profitable).
The Trading algorithms. 1. Follow trends with Indicators is Moving average and Envelopes. 2. Open order two ways that trading both BUY and SELL. 3. Open orders with distance. 4. Close order follow indicator's signal with a profit.
How to work? Open BUY When Moving Average Cross Above Envelopes L
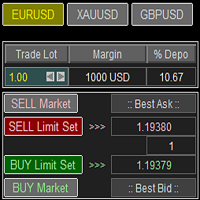
Trade Panel with Loss Breaking for MT4
Multi-instrumental trading panel with the function of transferring the stop loss of positions to loss breaking.
Has the following distinctive properties:
All trading parameters and panel operation are set in the settings. The traded position volume (lot size) is quickly changed. The required margin and the percentage of the required margin of the current deposit for the specified lot size are displayed. Shows profit when take profit is triggered and losses

This program works only on indexes, better US indexes like US30, US100 (USTEC), US500 (SP500) at New York Stock Exchange opening time (16:30) and automatically manage for each opening Trailing Stop Loss and BreakEven (if set). It is based on NY opening physiological movements of indexes quotes by putting pendants orders at defined (Gap) distance.
It has an automatic recovery system in case the first trade gone in loss. It is possible to decide which multiply factor to use for the recover, thus i

Ferox Least Squares Regression is an algorithm that uses regression and is design by Ferox Quants-Labs to use method like typical quantitative algorithm, using statistics and use past data to predict the future. * None Repaint indicator * Quantitative algorithm *Great For Swing Trading * Histogram Up is Long, Down is Short *Works On ALL Timeframe *Works On Any MT4 Pair

インディケーター Simple ATR 市場のボラティリティをより明確に追跡するための簡略化されたツールで、デイトレードとスイングトレードの両方に最適です。 トレードを始めるため、または初心者に最適なインディケーターです。
視覚的なインディケーターの色: ATR Daily - 青 視覚的なインディケーターの色: ATR Weekly - 赤 視覚的なインディケーターの色: ATR Monthly - 黄色
Volatility Vision インディケーターと組み合わせることで、分析を強化できます。 市場状況の変動を正確に測定し、デイトレードとスイングトレードの意思決定に不可欠です。 14日間(設定可能)のシンプルな移動平均を使用して、真の範囲インディケーターの精度を確保します。 トレーディングシステムでの取引開始や終了戦略を実行するのに最適で。 ATRインディケーターが他のインディケーターより優れている理由: 使いやすさ:ATRインディケーターは設定と理解が簡単で、初心者のトレーダーでも使えます。 多用途性:デイトレードとスイングトレードの両方に適しており、さまざまなトレ
This indicator is a simple stripped down version of any advanced support and resistance indicator. All the support and resistance indicators work from a number of bars that have developed over time. Get rid of clutter and confusing levels. Find levels according to a number of bars. Look at days, session, numbers of hours, periods of consolidation. Watch levels develop and use as breakout points, or areas of buyers and sellers. Features and things to consider This indicator is for a frame of

Super simple and powerful with full feature Trade Panel manager
This is the finest trade tool for your metatrader4, the best option for your daily trading activity with full powerfull inside.
Input parameters:
Magic Number : Define your magic number. Entry Comments : Define your entry comments.
Main Dashboard Features:
Buy & Sell button: Protected with confirmation pop-up before entry deliver to the system, incase miss press the button. Pending order (Limit & Stop) with check option: press

RSI 30 Buy 70 Sell RSI 14 Trading EURUSD , USDJPY Run 1M-1D Open MT4 Standard https://www.exness.com/a/73208 B $100 Open 0.01 lot B $1,000 Open 0.10 lot B $10,000 Open 1 lot ลูกค้าที่สมัครผ่านลิงค์ตัวแทนผม ใช้งานฟรี แจ้ง ID exness มาที่ jun_jao2000@hotmail.com หรือ Line : junjaocom ลูกค้าทดลอง Backtest ก่อน 1 เดือน และใช้บัญชีทดลองก่อน ถ้าผ่านแล้วถึงใช้บัญชีจริงในการเทรด

Feb 14 will be the last limit to purchase this EA for 1689 $, normal price will be 4500 $
If you are a fans of Martingale Averaging type of robot, then this robot will suit you, it has integrate the powerful entry method and smart money management system and strict account blow up protection system.
it's fully automatic no need to control / interfere the robot during the trading run. Critical features
Account blow-up protection. Trend following filter. Smart money management system. Emergenc

It works around the clock, completely in automatic mode and does not require special settings. ********It is a PORTFOLIO of different strategies all trading together at the same time.*******
BTC Break Free trades on all trading accounts and symbols, as well as all time frames. I recommend using it for BTCUSD and EURUSD . For large accounts, I recommend using the 1-Very Low risk mode. Minimum deposit of $1000, recommended $ 2000 and above. Leverage 1:25 - 1:500. For small deposits 1:500

SPECIAL LAUNCH PROMO
next price : $450
(only 3 copies left at current price) BreakFreeGold Expert Advisor is a fully automated forex trading robot designed to work on the XAUUSD ,XAUEUR,XAGUSD currency pairs and it is also optimizable for other currency pairs.
The strategy based on breaking through price levels and Market Time, this powerful and robust Expert Advisor uses a combination of pending order and market orders in order to take advantage of every market condition- each entry point i

________________________________________________________________________
_________________________________________________________________________________________________
Are You Looking For REVENGE On The Market With A PowerFul EA With A Low DD And Consistency That Produces Realistic & Believable Results ? Well, You've Found The Right 1. Introducing "ARIES REVENGE."
ARIES REVENGE IS SAFE & SOUND WHILE BEING BATTLE TESTED.
OPEN BUY & SELL ORDERS:
ARIES REVENGE Runs A Intraday Scalping S
volume MTF is the way to give you the Volume of currency and you will Know the trend and reflection when happen it used on scalping and entraday trading strategy with (M1....H4) Timeframe i always going take a look on higher timeframe then back to small timeframe and wait an indicator signals the setting of indicator i usually used the default just remove the arrows from setting this indicator recommended for scalping

取引ロボット「TIC-pro」は、GBP/USD に最も重点を置いています。 しかし、同時に複数の商品を取引するだけでなく、他のペアでも取引される可能性は十分にあります。 ロボットは未決注文を取引し、さまざまな方向の取引を非常にうまくヘッジします。 これにより、多数の誤った信号を遮断することができます。 このエキスパートアドバイザーを作成する際には、ドローダウンの可能性を減らすことに重点が置かれました。 彼は買いと売りの両方の方向で取引します。 このロボットは、長期的なトレンドの動きにも焦点を当てています (エキスパート設定で調整可能)。 設定では開始ロットが自動的に増加するように設定できます。 利益の望ましい割合が設定され、利益の望ましい割合が達成されたため、ロボットは、その利益の割合に達すると、単一のトランザクションの現在の結果に関係なく、すべての開いているトランザクションを終了します。 これは月に数回発生する可能性があります (利益の 2% を超える値を設定しないでください。このパーセンテージを低く設定するほど、不必要なマイナスの取引を迅速かつ簡単に閉じることができます)。 デ

Follow signals here The expert works on the Fibonacci levels on the previous candle With some digital way to enter the deal On the five minute frame Work on currency pairs only Do not use TakeProfit or Stop Loss How the expert works It is placed on the three currency pairs GBPUSD GBPJPY GBP AUD Same settings without changing anything When he works, he will work on only one currency of them until it closes on a profit Profit is only seven points Please watch the video Explains how the expert wor

The NiteHorse EA is works like a scalping machine to be used at those quiet market moments of the night. Specifically, its best to let it start work from some 2 or 3 hours to the end of each trading day and end trading before the trading day ends. The time filter uses the server time. (Broker Time). You may need to set/adjust it taking into account your geographic timezone. This is very important in order to get the EA trade during the last few hours of the day and for best results.
It is also

スキャルピングアロー通知電話は、ユニークなスキャルピングトレーディングインジケーターです。インジケーターは、注文を開く必要があるときにチャート上に矢印を描画し、注文を開く必要がある方向を示し、携帯電話にシグナルに関する通知を送信します。いつでも、あなたがコンピュータの前にいないときでさえ、あなたは信号を受け取り、市場と取引をコントロールすることができます。インジケーターは、いつ注文を開くかを矢印で示し、矢印の方向は、注文を開く方向を示します。
インジケーターの設定は非常に簡単です。パラメータは2つだけです。
short_period-インジケータ短波周期。 long_period-インジケーターの長波周期。 Signal -ここでは、携帯電話への通知の送信を有効または無効にします。

EA uses high or low range to define possible Market Correction , after that the trades will be open according to Divergence Signal . EA does not uses conventional stop loss and take profit functions, trades will be closed at the indicator signal.
EA uses also Hidden Divergence for exit trades. default setting for GBPCAD also working on: EURUSD / EURCAD / EURAUD / GBPUSD / USDCHF / AUDNZD / AUDUSD ("FXCM broker" sets in the comments ) timeframe: 1H
developed, tested and optimized on FXCM
Premium support and resistance - the best combination of different indicators allowed us to create the best product on the market!
And that's Premium support and resistance!
A convenient and flexible tool that will help you in trading!
Shows where the price will go from the support and resistance levels!
The arrows Blue buy Red sell will help you with this!
Alert is already built into the indicator for your convenience!
Alert in order not to miss the "Own" signal!
It is already configure

v. 1.0 This indicator can show with maximum accuracy up to 1 bar the presence of a Maximum/minimum on the chart, regardless of the timeframe. It has a flexible configuration. You can use either one value on all TF, or you can use your own value on each TF individually.
This indicator is already being improved and those who purchase it receive all updates for free.
Next, it is planned to display an indication of the strength of the pivot point at each extremum (in % or in color drawing). It wi

Dear traders, here is my other tool called the "Market Makers Trend Index". The Market Makers Trend Index is created for the purpose of helping majority of traders to analyse the market direction in an easy way. This indicator is for serious traders who are eager to add edging tools to their trading arsenal. What are you waiting for just grab your copy today and amake a difference. WHY THIS TOOL This indicator help traders analyse the trend direction and trading signals with precision and eff

PROP TRADING EA - Passing challenge or Verification - ANY PROP FIRMS - TEST Set files in the Comment section US30/US100 Dow Jones / Nasdaq https://trader.ftmo.com/metrix?share=2e2ffcdc1689&lang=en (01) testing ............ https://trader.ftmo.com/metrix?share=f823192684d3&lang=en (02) start date 21 Dec 2023 New and improved settings https://trader.ftmo.com/metrix?share=c2f389839308&lang=en (03) start date 04/01/2024 https://trader.ftmo.com/metrix

The Forex Jeweler EA opens a locked position and sets a take profit for a buy and sell transaction. After closing one trade, the EA modifies the remaining trade according to the user's strategy. By default, the EA has a delivery setting not for trading. Setting "Forex Jeweler EURUSD" for safe and profitable EURUSD trading is attached in comment #1 of the Comments. The strategy test is presented in the screenshots. Profit for the last 6 months: 1000% (or average profit per month: 166%). The minim

Stepper new vision New grid advisor with martingale and reverse orders. Orders with a paired reverse order are trailing until the specified profit is reached. The TP line is also trailed for maximum possible profit. In case of a drawdown, the mechanism for decreasing the lot of "drained" orders is activated. New orders are opened by an oscillator signal and filtered by a trend indicator. When building the grid, the martingale principle is used with a constant rate of change in the lot. Warning!
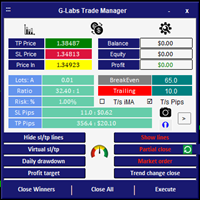
Trade manager Auto calculates % risk per trade Manual lot size input $ Risk amount Displays profit to loss ratio Shows value of stop loss and take profit in pips and dollars Shows Balance equity and open profit and loss On screen trade entry lines with entry stop loss and take profit . All with lots size , pip value dollar value and price level of line The value of these lines is also displayed in the panel Buttons on panel for Close Winners, Close all, Execute . Trade panel has func

Contact me after payment to send you the User-Manual PDF File. Divergence detection indicator with a special algorithm. Using divergences is very common in trading strategies. But finding opportunities for trading with the eyes is very difficult and sometimes we lose those opportunities. The indicator finds all the regular and hidden divergences. (RD & HD) It uses an advanced method to specify divergence. This indicator is very functional and can greatly improve the outcome of your trading. Thi

The Trend Monster is a trend following non repainting indicator based on moving averages. As traders we want to be careful not to trade against the trend. Therefore when you look at the chart as a trader you will have to ask yourself these kind of questions Is this market trending? Is this market ranging/trading sideways? Is this market bullish or bearish? What should I look for before I take a trade? Those are some critical questions that every trader should ask him/herself before taking any tr

ペリデックスは、独自のスキャルピング手動取引システムです。この取引システムは自動的に市場を分析し、価格反転ポイントを決定し、 いつ注文を開始および終了するかをトレーダーに示します。このシステムは、トレーダーが必要とするすべての情報をチャートに視覚的に表示します。
M1スカルパーシステム-トレーダーを電話と電子メール信号に送信します!したがって、信号を待つために常にPCの前に座る必要はありません。 取引を開始するための良いシグナルが市場に現れると、インジケーターは自動的にあなたの電話と電子メールに通知を送信します。
M1スカルパーシステム-信号を再描画しません!この取引システムは公正です。シグナルを再描画したり、市場に合わせて調整したりすることはありません。 したがって、シグナルがチャートに描かれるとき、それは常にそこにあり、消えることはありません。
M1スカルパーシステムはセットアップが非常に簡単です。トレーダーができるだけ簡単に作業できるようにするために、 設定の数を1つのパラメーターに減らしました。これで、1つのパラメータ「期間」exを使用して、取引システム全体をカスタマイズ

Sale 60% OFF Original price: $296,00 Promotion price: $118,40 Offer valid for the next 5 products sold Concept
Gold Evolution is a system that identify the safest entry and exit points.
This system is focused on a long-term stable growth .
It is a professional strategy developed years ago for manual trading of Gold, and now, perfectly adapted to automated trading .
It does not need to be constantly updated as it adapts naturally to varied market conditions.
No martingale, no grid, no hedge,

Pianist - arrow indicator without redrawing shows potential market entry points in the form of arrows of the corresponding color. The tool reduces the number of missed entries, which is very important for an intraday strategy, where the mathematical expectation is quite low and the spread costs are high. Arrows will help a beginner trader to better understand the mechanism of formation of signals of a trading system during step-by-step testing. The icons with the entry direction that appear wil

The QRSI indicator is one of the most important and well-known indicators used by traders around the world. It is also obvious that this indicator is capable of showing good entries in every local area. For which it usually needs to be optimized or just visually adjusted. This development is intended for automatic optimization of the indicator. Once placed on the chart, the indicator will automatically re-optimize itself with the specified period (PeriodReOptimization) and display the chart wit

Indicator Forex Indiana allows you to analyze historical data, and based on them, display instructions for the trader for further actions. Indiana implements indicator technical analysis and allows you to determine the state of the market in the current period and make a decision on a deal based on certain signals. This is the result of mathematical calculations based on data on prices and trading volumes. An attempt is made to describe the current state of affairs in the market, to understand
MetaTraderプラットフォームのためのアプリのストアであるMetaTraderアプリストアで自動売買ロボットを購入する方法をご覧ください。
MQL5.community支払いシステムでは、PayPalや銀行カードおよび人気の支払いシステムを通してトランザクションをすることができます。ご満足いただけるように購入前に自動売買ロボットをテストすることを強くお勧めします。
取引の機会を逃しています。
- 無料取引アプリ
- 8千を超えるシグナルをコピー
- 金融ニュースで金融マーケットを探索
新規登録
ログイン