YouTubeにあるマーケットチュートリアルビデオをご覧ください
ロボットや指標を購入する
仮想ホスティングで
EAを実行
EAを実行
ロボットや指標を購入前にテストする
マーケットで収入を得る
販売のためにプロダクトをプレゼンテーションする方法
MetaTrader 4のためのエキスパートアドバイザーとインディケータ - 149

Vizzion is a fully automated scalping Expert Advisor that can be run successfully using GBPJPY currency pair at H1 timeframe. Very Important
This Expert Advisor can not run with any EAs in the same account. As part of the money management plan, it calculates and monitors the Margin Level % and assumes that all open trades are created by it. If you want an Expert Advisor that trades in a daily basis, this EA is not for you because using this requires a patience to wait for a few days or weeks on

The Quadro Trend indicator works stably, correctly, and gives great flexibility when analyzing prices. There are many similar indicators, but Quadro Trend , unlike most of them , gives pretty good signals.
A great tool for working inside the day. On charts with a period of less than a day will help you see the daily candle in its usual form.
U-turn occurs when an arrow of the corresponding color appears. There is a parameter in the indicator to enable the supply of alerts when the color chang

How to work with an expert adviser: “Double Paired moving averages”
This is a trend strategy and has simple rules of risk management, so I advise you to study this strategy in more detail and keep it in your portfolio. If you don’t have time to constantly sit at your computer or constantly get your phone out to monitor the state of the market, then this strategy is for you!
An expert advisor will help you track signals and inform you about it.
The idea of using this strategy is very simple

DYJ ArtOfMakingMoney attempts to gauge bullish and bearish forces in the market by using two separate measures, one for each type of directional pressure. The EA's BearsIndex attempts to measure the market's appetite for lower prices
The EA's BullsIndex attempts to measure the market's appetite for higher prices Features Monitors all pairs at the same time. The EA monitors the top 35 pairs by default, but you can select less pairs if you wish. It is a multi-currency EA that can be run from a s

There are simply experts working at high tide and this mine working at low tide (falls on prices) The backtest on EURUSD was done with the default parameters without any optimization and you can see the result below. Works well on other pairs also.
Parameters MMmode - false = fixed lot Fixed_Lot - lot size to trade. Risk% LotSize (MMmode=true) - risk % of balance ENV - 192 Dev - 0.7 Multi 2.0 Step 50 Tprofit/Sloss? Take profit - take profit in pips. Stop loss - stop loss in pips. Profit tar

All time zones. But I use it daily and 4 hours continuously. When trading in small time zones it is necessary to check the top time zones and especially 4 hours and logs. Red Arrow - SELL Green Arrow - BUY When the Green Arrow is lit while the Bar is Blue (Check the overall trend rise) - Buy When the Red Arrow is lit while the Bar is Red (Check general trend downtrend) - Sales NO RE-PAINTING GOOD TRADE

Monitoring of real trading on this system https://www.mql5.com/ru/signals/632726 Guru Pro Signal does not repaint! Guru Pro Signal is an original indicator, developed for the work of employees of one of the large funds! It is the best tool that can be added to your chart!
Guru Pro Signal signals about price reversal with the highest degree of accuracy, the best tool for both scalping and position trading. The entry signal is shown by the BUY and SELL arrows. It is possible to receive notif

EZ Volchok is a fully automated grid expert advisor that opens orders at moments of a trend reversal. The basis for finding the entry points are the author’s indicators based on Moving Average and Bollinger Bands. If the price moves in the opposite direction of the deal, the grid system will control the trading process. Benefits and features Fully automated and does not require extra attention Suitable for working with any brokers Minimum recommended deposit is $ 2000 (can be used on cent accou

KT MACD Divergence shows the regular and hidden divergences build between the price and oscillator. If your trading strategy anticipates the trend reversal, you can include the MACD regular divergence to speculate the potential turning points. And if your trading strategy based on the trend continuation, MACD hidden divergence would be a good fit.
Limitations of KT MACD Divergence
Using the macd divergence as a standalone entry signal can be a risky affair. Every divergence can't be interprete

Flower Trend Flower Reserve The Flower Trend Expert Advisor is able to trade in fully automatic mode or manage orders opened by user.This is a very useful tool for you, but avoid big news and illiquid markets. open account(Deposit>5000$) from this link, you can use this EA for free https://www.usgfx.com/RegAcc/RegAccStep1?culture=zh-CN&IB=2128p8x8R8x8K8P-0b EA signal : https://www.mql5.com/zh/signals/630704 Recommendations
Before using the EA on a real account, test it with minimal ri

A professional version of the ZigZag indicator for visualizing the structure of price movements by fractals. Fractal ZigZag fixes the flaws of the standard version of the ZigZag indicator MT4. It uses Price action and a unique filtering algorithm to determine fractals. Suitable for all types of trading.
Ideal for trading according to the WM pattern "Sniper" strategy !!! Features Marks the place of price reversal during the formation of a new fractal with specified parameters. Suitable for al
Hulk GBPCHF passes the test from 2000 to the current day! The expert uses independent strategies, including trading on short-term and long-term trends! trades on the GBPCHF, GBPCAD m5 currency pair by default !
Please pay attention to my other products: https://www.mql5.com/en/users/malishko89/seller#products
Please note that the adviser has summergmtshift and wintergmtshift in its settings, so summer and winter gmt may differ! It all depends on your broker! So that testing is

it is an indicator for trading on the forex market and binary options, it is a trend tool with which you can take it most often when the first signal appears, open a trade in the indicated direction stop loss set above the arrow if the signal is lower or below the arrow if the buy signal when signals appear in the same direction where the transaction is open, you can enter into additional stop loss orders; we also set up trading without take profit; you need to close the transaction when a signa

The expert advisor opens trades when the forex market is ranging and the RSI indicator enter in oversold or overbought areas. The Stop Loss, Take Profit, and Trailing Stop are calculated based on the ATR indicator. The recommended currencies pairs are EURUSD, EURGBP, USDJPY, EURCHF, EURNZD, AUDCAD and the recommended timeframe to operate and to do backtests is M5 . This Expert Advidor can be profitable in any TimeFrame and with any Currency Pair but you should know how to adjust the parameters

TickChart Indicatorは、MetaTraderのメインウィンドウにティックチャートを表示します。
(無料のLite版、TickChart Indicator Liteでは、 表示するティック数を20に制限し、以下の説明にあるアラート機能を省いています。) ティックチャートは、市場の動きを最も詳細かつリアルタイムに示すティックラインを描画します。値が変わるたびに発生するティックの間隔は1分足のローソク幅より短いので、通常のチャート上には描けません。通常、数個のティック線分が、1分足のローソクが完成する間に発生しており、重要な指標の発表直後には、その数が100を超える事もあります。 このインディケーターは、ティックラインをメインウィンドウの通常のチャートの上に描きます。通常のチャートは、"時間-価格"空間に描きますが、ティックチャートは、"ティック-価格"空間に描かれます。すなわち、ティックチャートのX軸は時間ではなく、市場が活発だとX軸の進行は速く、閑散だと遅くなります。 TickChart indicatorは、いろいろな場面で役立ちます。例えば、 スキャルピングの道具

Ranger Pro is a fully automated expert adviser that detects and takes advantage of ranging price action and make precise entries based on several indicators including RSI and Moving Averages while also utilizing price action to filter out false signals. Ranger Pro can either be set to avoid strong trends, trade with the trend, or both. User settings can range from conservative to moderate to aggressive with a minimum account balance of $400. Set files are available in Comments. Ranger Pro is cur

Scalping Modulator is a scalping trading system. The indicator consists of several analytical modules. It automatically analyzes the market and shows the trader all the necessary information for trading. Scalping Modulator draws two trend lines on the chart. One line shows the long-term direction of the price, the second line shows the medium-term direction of the price. The indicator also draws red and blue dots on the chart. They indicate a likely change in price movement. In order to open a

高解像度ディスプレイ対応のレイアウト修正版! 各ブローカーに依って異なるサーバー時間は、短時間足でトレードする際には大きな負荷となります。
このインジケータは、勝つために必要な最低限のトレードインフォメーションをひとめでわかりやすいように表示します。
サブウインドウにはローカルタイムを表示し、メインチャートにはローカルタイムだけでなく、
-Symbol(通貨ペア)
-Period(時間足)
-BarEndTime(バー残り時間)
-Spred(スプレッド)
-TokyoTime(東京時間)
-LondonTime(ロンドン時間)
-NewYorkTime(ニューヨーク時間)
-ServerTime(サーバー時間)
を表示します。
メインチャートでのインフォメーション表示は、右上・右下・左上・左下の4箇所から選択可能です。

Greetings to all friends! I propose to get acquainted with the high-tech and multilateral advisor Money Nest. The Expert Advisor is developed on the basis of the "Nest" indicator and contains three robots at once. Advisor management allows you to work with each robot separately and together, which allows you to configure the work as safely as possible using hedged positions with the maximum profit as much as the adviser allows. For maximum efficiency, it is necessary to optimize the instrument y

LRY SL Robot is a fully automated multi-currency trading robot, trading according to the "rise-fall ratio". EA operating environment EA can run in any currency, at any time. The minimum capital is $300. Parameters Lot - lot size for pending orders. Open Percentage - Start trading "percentage signals" Close Percentage - Turn off trading "percentage signals" Compound Interest - As the balance increased, so did the number of orders Move Stop Loss - Change distance of stop loss line after earnings A
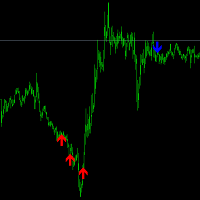
This index doesn't disappear, it doesn't get rewritten, the way it's calculated is to look for a trend shift, when the arrow comes up, there's a high probability that the trend will change. It is recommended to use a larger cycle, but you can also use the 5 minute cycle, the larger the cycle, the higher the winning rate. Indicators in the form of arrows, blue down arrow short, red up arrow do, in a large trend may appear in a continuous arrow, every arrow appears, is an opportunity to add positi
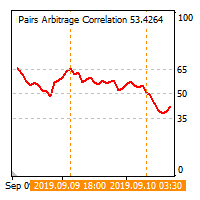
The cross-correlation indicator calculates the relationship between the specified pairs for the previous period. Automatically selects the instruments with the highest and the lowest correlation, and then simulates trading on the selected pairs on the same test period. Then indicator displays the pairs that have shown the best trading results. Visualizes the PAC (Pairs Arbitrage Correlation) criterion for the pairs selected by the trader. The signal to open trades is set by the PAC levels. When
This EA has been developed for DAX (GER30) M30 timeframe, everything is tested and ready for immediate use on real account. This Expert Advisor is based on BREAKOUT of the TRENDLINE after some time of consolidation. It uses STOP pending orders with FIXED Stop Loss and FIXED Take Profit . To catch more profit there is also a TRAILING PROFIT function provided. At 9:00 pm we are closing trading every Friday to prevent from weekly gaps. !!!Adjust these times to your broker time. Preset valu

Script to move the stoploss of your positions all on one level or just a stoploss of one of them. Convenient and quick to use. Just drag the script to a point in your template, at the price level you want, and the utility will ask you if you want to move all the stoplosses to that level, or move only one stoploss of a position. Very useful when the positions are very near or the stoplosses are too near. We would appreciate your feedback, so we can improve ourselves. Good trading.
EA trades pairs selected by correlation criterion. The choice is made in such a way that there are pairs with negative and neutral correlation to the main pair. The PAC indicator is used to automate the selection of pairs https://www.mql5.com/en/market/product/41985 Expert is multycurrency, thus it is no use to test it in the MT4 terminal. So, watch for real signal and joing to telegram channel. After setting the pairs, the expert Advisor simulates trading for the previous period with visualiz

The most handy indicator for searching classical and hidden divergences either between price chart and an oscillator-type indicator or between two oscillator-type indicators.
Just drop the indicator on the chart at which 1 or 2 oscillators are executed (see the video below).
The indicator doesn't require setting-up. You have just to choose the operation mode: to search divergences between price chart and an oscillator or between two oscillators..
Switch between classical and hidden divergence
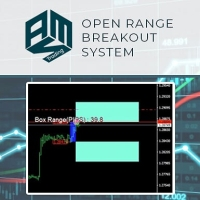
This Expert Advisor implements the Range Breakout Strategy, a simple yet effective short-term trading strategy. Easy to use and supervise Fully configurable settings Customizable break-even, SL, TP Built-in money management Works for ECN/Non-ECN brokers Works for 2-3-4-5 digit symbols Trading is FIFO (NFA) Compliant
The Range Breakout Strategy Using this strategy, the trader places a buy stop/limit just above the open price of your defined range and a sell stop/limit just below the open price.

The expert uses independent strategies, including trading on short-term and long-term trends! By default, he trades on the GBPJPY m5 currency pair! Transactions are accompanied by invisible stop loss for the broker.
Please pay attention to my other products: https://www.mql5.com/en/users/malishko89/seller#products
Please note that the adviser has summergmtshift and wintergmtshift in its settings, so summer and winter gmt may differ! It all depends on your broker! So that testing i
Индикатор отображает 4 текущих уровня между, которыми находится цена. Уровни вычисляются на основе диапазона предыдущей недели. Количество и значение уровней произвольное и выражается в процентах . Положение уровней отсчитывается от минимума предыдущего дня (пример можно посмотреть в описании параметров). Целесообразно размещать уровни в строке настроек по порядку, тем не менее индикатор сам их отсортирует и если обнаружатся уровни отстоящие менее чем на 1% выдаст ошибку. Индикатор работает н
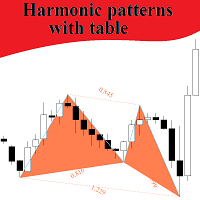
This indicator searches harmonic patterns on different TFs, and can track patterns in real time on all TFs for seted symbols. High and Low points for patterns defined by Bill Williams method, not by Zigzag or Fractals, it's more clear signals. Important input parameters: Where patterns search : "Current symbol" - searches patterns on the current symbol; "Seted symbols" - indicator creates table with seted symbols. Allowable percent of deviation : percent of deviation from perfect pattern Sym

Ни для кого не секрет, что для того чтобы, заработать на финансовых рынках необходимо движение цены инструмента. И чем движение сильнее тем больше возможностей предоставляется для торговли трейдеру. Для поиска сильных движений цены и был разработан PulseScanner. Панель предназначена для быстрого визуального нахождения и отображения сильных движений цены по всем периодам и на любых выбранных валютных парах одновременно. Индикатор имеет несколько режимов поиска и визуального отображения сигналов.
Mars 11 is a Trend indicator is a powerful indicator of FOLLOW DIRECCTION for any par and any timeframe. It doesn't requires any additional indicators for the trading setup.The indicator gives clear signals about opening and closing trades.This Indicator is a unique, high quality and affordable trading tool. Can be used in combination with other indicators Perfect For New Traders And Expert Traders Low risk entries. Never repaints signal. Never backpaints signal. Never recalculates signal.
Gladiator Signal indicator for binary options can be used in the forex market...
a signal appears when you open a new candle, we need to wait for it to close.. and at the time of opening a new one if the signal is to open a deal for one candle of the current timeframe works great on all time frames... in the settings you can enable turn off the alert and sound vision...

Script to reduce the exposure of your operations on the chart. Convenient and quick to use. Just drag the script to a point in your template, and in the input values you will be able to modify several variables to reduce the exposures. We would appreciate your feedback, so we can improve ourselves. Good trading. Parameters: FilterTrade = All; All positions or only the buy or only the sells. Only_Profit = True; Only those in profit if true, in false it applies to all positions. Reduce_Perc = 50

The Overnight EA is a fully automated trading Expert Advisor, which uses technical analysis to take decisions based on various signals. It is originally intended to be used in the late hours of the night, where volatility is low, where we could scalp a few pips and avoid large drawdowns, however it could be used during any time of the day. Overnight EA is designed to have a very high winning ratio, and low drawdowns. It averages between 5-7% monthly with a fixed lot size. Using a VPS to run the

Advisor on the author's trending indicator Breetmabs, which was developed for a long time, taking into account the real behavior of the trend under different shopping circumstances. This EA is the result of our many years of work. It takes into account many subtleties of the market. The profit is fixed only on the trend reversal (if the trend goes in the direction of an open order - the EA waits for the reversal and fixes the profit at the maximum point). All our 15 years experience of trading o

図MACDアドバイザーへの指示 MACD指標波による注文の開始。 MACD指標の波での注文を閉じます。
デフォルト値。
デフォルトの属性値のままにします オープンポジションのテイクプロフィットとストップロス
ポジションサイズ
Metatraderに基づくトレーリング(10000-利用不可)
Expert Advisorに基づいて、100が始値、0が現在の価格であるFiboマーキングを想像してみましょう。収益性の高い値のみが処理されます(0.236-23.6 Fiboのレベルで0.236のレベル、38.2; 50 ; 61.8; 76.4、または0〜1の任意の値)
MACDインディケーターが実際に完了したMACDウェーブインジケーターでゼロラインを横切ったときにポジションを開くと、複数のタイムフレームが選択されている場合、2番目のウェーブで別のオーダーが開かれます。各時間枠が開きます。
買いポジションが開かれます
売りポジションが開かれます
MACDインディケーターがゼロラインを横切ったとき、実際に完了したMACDインディケーター波でポジションを閉じる。すべてのポジシ

この指標により、価格がいずれかのレベルに達する可能性を判断できます。そのアルゴリズムは非常に単純で、特定の通貨ペアの価格レベルに関する統計データの使用に基づいています。収集された履歴データのおかげで、現在のバーの間に価格が変化する範囲を決定することが可能です。 そのシンプルさにもかかわらず、この指標は取引において非常に貴重な支援を提供できます。そのため、トレーディングポジションのTakeProfitレベルとStopLossレベルを決定することができます。保留中の注文の価格の決定と、TrailingStopの価格レベルの決定の両方に役立ちます。 さらに、この指標は既存の戦略に統合できます。たとえば、ある種の日中戦略を使用します。次に、D1時間枠でこのインジケーターを設定することで、新しいトレーディングポジションを開くことは既に望ましくないことを克服した後、レベルを取得できます。 このインディケーターの主な欠点は、純粋に履歴データに依存しており、特定の現在の市場の変化にまったく反応しないことです。 このインディケーターの設定は、入力パラメーター-L1 ... L4-を選択することにより実

Ссылка на мониторинг: https://www.mql5.com/ru/signals/631995 Для начала торговли достаточно небольшого депозита. Идеален для быстрого разгона депозита!!! Подходит для мультивалютной торговли. Невосприимчивость к большой задержке и величине спреда.
Принцип работы После запуска советника на графике советник запоминает уровень открытия первого ордера. Выше уровня открытия первого ордера советник выставляет сеть ордеров на Sell . Ниже уровня открытия первого ордера советник выставляет сеть ордер

DO NOT STOP OCCUPY THE POWER OF THE UNION OF VARIOUS TIME FRAMES. From now on you can see the RSI that you use for your trading analysis in a single window without having to be opening others to form very graphic and easy. Color settings Possibility of deactivating the timeframes you want. Up or down arrows in relation to the previous sail. We also have Multiframe MACD and Momentum version available. Visit My signals https://www.mql5.com/es/signals/620506

Комплексный индикатор который работает на основе 4-х стандартных индикаторов МТ4: Moving Average, Stochastic, Bollinger Bands, RSI (в дальнейшем список индикаторов будет расширятся). Показания индикаторов берутся из 7-и тайм фреймов от М1 до D1. Строка Average показывает средние значения индикаторов в разрезе тайм фреймов. Сигналы индикаторов: Moving Average: быстрая скользящая выше медленной скользящей - покупка; быстрая скользящая ниже медленной скользящей - продажа; данные берутся из последне

Tasmanian Devil is a fully automated Expert Advisor with no use of martingale and gridsystems. It Uses significant price levels to make the order entries.
All trading positions contain a stop loss, and also include take profit. Which results in a very low draw down. Advantages
Advanced algorithm for tracking positions. Each item contains a protective stop loss. Work with fixed and risk based lots on MM. Does not use indicators, grid, martingale, arbitration. More exit strategies Protecti
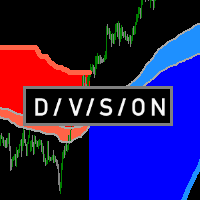
Определения текущей тенденции одна из самых важных задач трейдера не зависимо от стиля торговли. Индикатор Division поможет с достаточно высокой вероятностью это сделать. Division - индикатор распознавания тенденции, использующий в качестве источника данных подобие скользящих средних, в расчете которых используются объемы. От этих средних строятся границы, которые служат сигнализатором для смены текущей тенденции. Показания индикатора не изменяются не при каких условиях. При желании можно вкл

Choose all the pairs that have positive swap in your broker Then, the EA will buy/sell before the triple swap takes place, and it will close the position after the triple swap is paid to you. It is recommended to test the EA at least 1 month in demo account so you can see the results. If you have any doubt or suggestion, don't hesitate to contact me! HOW TO USE
Inputs swapDay = The day that the 3x swap is paid in your broker lots = The lot size that you want to use SL = stop loss in points (not

The Ceres Trend Indicator displays polynomial regression on history and in the current time.
In the indicator settings: module - degree of regression (1 - linear, 2 - parabolic, 3 - cubic, etc.) koeff is the standard deviation channel multiplier.
The main direction of application of this indicator is the ability to determine the likelihood of further growth. If there is an intersection of the linear regression line from below, then this indicates a trend inhibition and a possible reversal. Si

The OMEGA PIP is a unique revolutionary semi -automated software which change the game entirely to your favor.This product developed from years of research in the FX Market is embedded with complex algorithms which filters off false signals, generating only accurate valid signals which is immediately printed on your chart , thus it guarantees profit anytime its installed on your computer. Due to this significant feat, the daunting and the strenuous effort a traders goes through during

Jabuti Super Trend Explorer: このエキスパートは、より大きなタイムフレーム、MACD、移動平均のトレンドパラメーターに従って注文を入力するように設計されており、反対方向の動き(逆方向)で市場に参入する能力があり、通貨ペアとその特性を分析して意思決定を支援します 注ぎ込む。 ポジションは、ストップロスと価格に基づく静的なテイクプロフィットによってプロットされます。
Operação: Jabuti Super Trend Explorerは、通常の変動スプレッドブローカーで動作し、通常、以下の通貨ペアで最適に動作します。 デモアカウントでJabuti Super Trend Explorerを実行して、ブローカーに最適な設定を確認することをお勧めします。各ブローカーは異なる流動性プロバイダーとソフトウェアサービスを使用するためです。
特徴 : 以下の通貨で予定: M30: USD/CHF, GBP/USD, EUR/USD, USD/JPY, USD/CAD, AUD/USD H1: USD/CHF, GBP/USD, EUR/USD, USD/J

Robot de trading desarrollado para cuentas que inician desde un capital pequeño. Realiza operaciones que están un tiempo mínimo abiertas y con un riesgo pequeño en cada operación. Se debe usar en principalmente en gráficas en M1.
El broker recomendado para operar es Swissquote. En caso de requerir un prueba sin coste póngase en contacto conmigo y le ofreceré las posibilidades de utilizarlo.

Super grid nineth (ninth) generation is another grid type EA on this huge forex system population, this EA not using any indicator to avoid any fake signaling to open or closing position orders. This EA will open pending order stop and limit in the first time EA run, then maintain all opened order with unique way to balancing account free margin and make equity growth. This EA have unique system not like anyother grid EA, with correct setup and run on max 3 pairs in one account, this EA capable

Testosteron uses independent strategies, including trading on short-term and long-term trends! by default, trades on the EURJPY currency pair M5 timeframe!
The EA works at night and deals are not opened every day! How often deals are opened can be viewed in the strategy tester!
Test the adviser since 2010 to understand how it works on history.
Please pay attention to my other products: https://www.mql5.com/en/users/malishko89/seller#products
Please note that the adviser has summ

Hi everybody. This EA is the fusion of 2 powerfulls and simple concept of probability: It comes from professional gamblers/traders who lived with this strategy. Play with the demo with full options to see what i mean. (Also always do your plans and set your parameters in the tester before doing it in real account). It works with both little or big soldes, so any traders can use it. The EA do not use indicators, only probability based on the bars. I explain, in the gambling world, professionals g

Tortoise Master Professional このエキスパートマスターは、他のタイムフレームのトレンドパラメーターに従って注文を入力するように設計されており、MACD、移動平均、および各通貨ペアの特性をパラメーターとして使用して、投資の意思決定を支援し、反対方向に市場に参入する可能性があります。 動きの(逆)。 ポジションは、ストップロスと価格に基づく静的なテイクプロフィットによってプロットされます。
運営: Tortoiseは通常の変数スプレッドブローカーで機能し、通常は以下の通貨ペアで最適に動作します。各ブローカーが異なる流動性プロバイダーを使用しているため、最初にデモアカウントで実行してブローカーに最適な設定を確認することをお勧めします。 およびソフトウェアサービス.
特徴: 以下の通貨で予定: 期間: M30 e H1 通貨ペア: USD/CHF, GBP/USD, EUR/USD, USD/JPY, USD/CAD, AUD/USD, EUR/GBP, EUR/JPY,

Are you a trend trader tired of noise, spikes and whipsaws? The Royal Ace Signal Bar indicator tracks the market trend with an unmatched reliability, by ignoring sudden fluctuations and market noise around the mean price. It allows you to be steady when everyone else is shaky. Amazingly easy to trade The indicator needs no optimization at all It implements a multi-timeframe dashboard The indicator is non-repainting
Anatomy of the Indicator The Royal Ace Signal Bar indicator displays a col

Curiosity 11 The Candle Signals It is an advanced trading system. This is a fully automatic Expert Advisor, which allows you to presize the trade according to the preferences of the trader. Curiosity 11 The Candle Signals have more than 260 customization options for your trade. Different options for different styles of trade. Curiosity 11 The Candle Signals is a Trend system of trade with different algorithm of trade mode. This EA using signals to place orders. Is a revolution in the cu

Growth 651% dd only 21.62% Top 4 best EA's on mql5 for 3 years! This ea trades every day and non-stop, if you purchased i will provide settings and full support.
Because mt4 only has max 1 pair to backtest and this ea trades with correlation pairs! Therefore, a separate real account is attached to the product, where you can constantly monitor all trading results

Royal Ace Signal 3 MA The Royal Ace Signal 3 MA indicator tracks the market trend with combine 3 MA. Amazingly easy to trade The indicator needs no optimization at all It implements a multi-timeframe dashboard The indicator is non-repainting
Anatomy of the Indicator The Royal Ace Signal 3 MA indicator displays a colored arrow. If the arrow is gold you should be looking for long trades, and if the arrow is red, you should be looking for short trades. Use this indicator in H1, H4 timeframe o

Just $30 for six months!!!. This will draw Order Blocks just by clicking on a candle. It will use the body or the wicks. It can also draw the mean threshold of the candle open/close or high/low. As a drawing tool, it is not active all the time after adding it to the chart. Activate by pressing 'b' twice on the keyboard within a second. If activated but then decided not to draw, deactivate by pressing 'b' once. Box color depends if candle is above or below current price. Settings/Inputs: Number

Just $30 for six months!!!. This will draw Order Blocks just by clicking on a candle with different colors for different timeframes. It will use the body or the wicks. It can also draw the mean threshold of the candle open/close or high/low.
As a drawing tool, it is not active all the time after adding it to the chart.
Activate by pressing 'b' twice on the keyboard within a second. If activated but then decided not to draw, deactivate by pressing 'b' once. Box color depends if candle is abov

Just $30 for six months!!!. This will draw Supply & Demand zones just by clicking on a candle. It can also draw the mean threshold of the zone. https://youtu.be/XeO_x7cpx8g
As a drawing tool, it is not active all the time after adding it to the chart.
Activate by pressing 's' twice on the keyboard within a second. If activated but then decided not to draw, deactivate by pressing 's' once. Box color depends if candle is above or below current price.
Settings/Inputs: Number of candles the box

Heraclitus is a trend-following intraday trading robot engineered to find promising reversal points to enter the market. This product works with EURUSD symbol on M1 timeframe and MUST NOT be used in combination with others EA on the same account to avoid interferences in automatic trading decisions. KEY FEATURES Fully-automated Autolots Trailing stop Flexibile trade management Works also with minimum lot size Risk can be controlled by input parameters
TRADE MANAGEMENT POLICY PARAM
This EA has been developed for EURUSD M15 TF. It also works very well on GBPUSD M15. So you will get 2 strategies for lower price, that means better equity curve, higher profits, lower drawdowns. Everything is tested and ready for immediate use on real account. This Expert Advisor is based on BREAKOUT of the LOWEST CHANNEL after some time of consolidation. It uses STOP pending orders with FIXED Stop Loss and FIXED Take Profit . To catch as much profit as possible there is also a TRA

This Expert Advisor is designed to enter orders according to trend parameters of other TimeFrames, MACD and Moving Averages as well as the characteristics of each currency pair to assist in the decision to invest. It has the possibility to enter the market in the opposite direction of movement (reverse). Position is plotted by a stoploss and static takeprofit, based on price..
Operation : You work with regular variable spread brokers and generally work best on the currency pairs below, so it i

NewsReady is a semi-automated Expert Advisor that uses a smart straddle methods It needs to be set in charts 2 to 10 minutes before Economic Data release with a red-flag impact on currencies related to the news. Then it run pending orders in specified number of minutes indicated in the time-period parameter. After the specified time, it will stop trading and will remove all pending orders. Important
You can not backtest this tool because it is semi-automated and can only be set and run a few min

A trend indicator, the main direction of which is to display the possible direction of price movement. The price reversal occurs with the same patterns on the indicators. The indicator shows the possible direction of price movement. Signals are generated on the previous bar. Red Coogie - the signal is considered unconfirmed. The indicator works best on timeframes H1, H4 and D1.
This is one of the few indicators that can signal strength and direction, which makes it a very valuable tool for tra

Общие сведения Classic - это сеточный эксперт следующий строгим правилам торговли. Главное отличие от сеточных экспертов имеет фиксированный Stop_Loss каждого ордера! Использовать на периоде M1. Для начала торговли достаточно небольшого депозита. Мультивалютность. Невосприимчивость к большой задержке и величине спреда. Работает только со своими ордерами.
Рекомендации Рекомендую использовать мультивалютную торговлю. Для этого запустите советника на разных валютных парах!!! Если ваш копмьютор сла

Advisor FU PULSAR - is a scalper with high accuracy of market entries. The EA is able to work with medium spreads (for testing we used a spread of 20 points on GBPUSD), it is not critical to slippage, and it is also not demanding on trading conditions. It uses Stop Loss as protection for orders, and uses virtual trailing stop as a percentage of the balance as order support. It does not open orders often but as accurately as possible.
FU PULSAR does not use indicators. The algorithm contains a

Automatic trading Advisor .Refers to the breakdown scalping robots .Traded pairs EURUSD and GBPUSD .The EA places pending orders at price levels where strong recoilless movements are likely to occur.All trades have a fixed stop loss and take profit .Orders are closed either by take profit or by trailing stop.For successful trading, a broker with the narrowest possible spread is recommended . To use the VPS server is a must! Testing was performed on tick data with modeling quality 99.9 %, using
DPOMASimple (DetrendPrice Oscillator) is an indicator that removes the price trend, in order to observe the cyclical movements of the price without the noise of the trend, the DPOMASimple indicator can be used to determine support and resistance levels in the peaks and valleys or as trading signal whe cross 0 level.
DPOMASimple > 0 -> Buy. DPOMASimple < 0 -> Sell.
Markets in range: Maximum and minimum will be the same as in the past. Set the overbought and oversold levels based on

Introducing the trend indicator! Ready trading system. The principle of the indicator is to automatically determine the current state of the market when placed on a chart. The indicator analyzes market dynamics for pivot points. Shows the favorable moments of entering the market with stripes. Can be used as a channel indicator or level indicator! This indicator allows you to analyze historical data, and on their basis display instructions to the trader on further actions. To find out how to dete

This indicator is based on the standard MACD indicator, but showing the changes up and down colored. It is a nice assistance to visualize our Expert MAGIC MACD.
MAGIC MACD MT4: https://www.mql5.com/en/accounting/buy/market/41144?period=0 MAGIC MACD MT5: https://www.mql5.com/en/accounting/buy/market/41151?period=0
Inputs in the Indicator: Fast EMA: standard is 12 Slow EMA: standard is 26 Signal: depending on what you want to see. For the MAGIC MACD the standard is 1
in common settings: Fixed M
MetaTraderプラットフォームのためのアプリのストアであるMetaTraderアプリストアで自動売買ロボットを購入する方法をご覧ください。
MQL5.community支払いシステムでは、PayPalや銀行カードおよび人気の支払いシステムを通してトランザクションをすることができます。ご満足いただけるように購入前に自動売買ロボットをテストすることを強くお勧めします。
取引の機会を逃しています。
- 無料取引アプリ
- 8千を超えるシグナルをコピー
- 金融ニュースで金融マーケットを探索
新規登録
ログイン