YouTubeにあるマーケットチュートリアルビデオをご覧ください
ロボットや指標を購入する
仮想ホスティングで
EAを実行
EAを実行
ロボットや指標を購入前にテストする
マーケットで収入を得る
販売のためにプロダクトをプレゼンテーションする方法
MetaTrader 4のための新しいエキスパートアドバイザーとインディケータ - 255
This indicator analyzes in parallel price charts for multiple currency pairs on all timeframes and notifies you as soon as a double tops or double bottoms pattern has been identified.
Definition Double Top / Double Bottom pattern Double Top is a trend reversal pattern which are made up of two consecutive peaks that are more and less equal with a trough in-between. This pattern is a clear illustration of a battle between buyers and sellers. The buyers are attempting to push the security but are
The EA is based on price crossing the High or Low of a Moving Average. Advance Fractal profit taking method. Advance stop management option based on explosive candles (Big Candles). Loss recovery system making recovery of losses easier. Configured the EA to match your trading style. Scalping, Swing Trading or Trend Trading. Three custom trailing stop options. Explosive candle stop management with partial closure. Advance fractal partial close profit taking Two indicator filters Time filter wit

RSI Currency Strength Meter uses RSI (Relative Strength Index) to monitor how strong a currency is, or in other words, if it's being bought or sold by the majority compared to the other currencies. It displays the strength-lines of the currencies of the pair (base and counter currency of the chart) with changeable solid lines. Also, you can add up to ONE additional currency (only 1 in the DEMO version, in REAL up to 5) to the "comparison pool" that already has the base and the profit (counter) c
FREE

ReviewCandleChart is a unique product that can verify past price fluctuations using candlestick charts. This indicator accurately reproduces market price fluctuations in the past and can make trading decisions (entries, profits, loss cut) many times so that you can learn the trading faster. ReviewCandleCahrt is the best indicator to improve trading skills. ReviewCandleCahrt caters to both beginners and advanced traders.
Advantages of the indicator This Indicator for verifying price fluctuation
FREE

CCI Currency Strength Meter uses CCI (Commodity Channel Index) to monitor how strong a currency is, or in other words, if it's being bought or sold by the majority compared to the other currencies. If you load this indicator on a chart, it will first display the strength-lines of the currencies (base and counter currency of the chart) with changeable solid lines. Also, you can add up to ONE additional currency (only 1 for the DEMO version, but on REAL up to 5) to the "comparison pool" that alrea
FREE

ReviewCandleChart is a unique product that can verify past price fluctuations using candlestick charts. This indicator accurately reproduces market price fluctuations in the past and can make trading decisions (entries, profits, loss cut) many times so that you can learn the trading faster. ReviewCandleCahrt is the best indicator to improve trading skills. ReviewCandleCahrt caters to both beginners and advanced traders. Advantages of the indicator This Indicator for verifying price fluctuation u

FX Master Expert Advisor opens positions at breakthroughs of support and resistance levels.
The EA trades during both trend and flat movements with no need to adjust parameters.
The EA uses the minimum stop loss (250 points) allowing the efficient use of funds and risk management.
Working timeframe: 1H
Recomended params for trading - all default values, excluding Filtration: AUDUSD=8, EURUSD, GBPUSD, USDCAD =12, USDCHF = 28
Note! Use "Every tick" mode when testing the EA!
In

This indicator is a proof of concept of pyramid trading strategy. It draws fibonacci level automatically from higher high to lower low or from lower low to higher high combinate with Pyramid Trading Strategy for better risk reward ratio. What is Pyramid Trading Strategy? The pyramid forex trading strategy is a something every forex trader should know about because it makes the difference between making some pips with some risk in only one trade or some pips with less the risk by applying the pyr
The indicator shows buy or sell on the screen when it catches a signal with its own algorithm. The arrows warn the user to buy or sell. Pairs: USDCHF, AUDUSD, USDJPY, GBPJPY, EURUSD, GBPUSD, EURCHF, NZDUSD, EURCHF and EURJPY. You can test the indicator and choose the appropriate symbols. The best results are on M30.
Parameters AlertsOn - send alerts AlertsMessage - send a message AlertsSound - sound alert
AlertsEmail - email alert Buy color - buy color
Sell color - sell color
The utility manages other EAs' orders as well as the ones opened manually. It is capable of trailing the price (trailing stop function), set a stop loss and take profit if they have not been set before. When configuring the utility for an EA having no trailing stop function, place it to the new window with the same currency pair specifying the same Magic value (as for the EA orders the stop loss is to be applied to). You can set any timeframe. It does not affect the utility operation. Set Magic
FREE

RCCMA is a general moving average indicator that works with ReviewCandleChart. Original is "Custom Moving Average" provided by MetaQuotes Software Corp. Based on that source code, I corresponded to ReviewCandleChart .
Advantages When ReviewCandleChart is ON, no line will be displayed on the right side from the vertical reference line. When ReviewCandleChart is ON and you press a key such as "Z" or "X" Following that, the MA is drawn. When ReviewCandleChart is OFF, the same drawing as the origi
FREE

This Expert Advisor is designed for use on all currency pairs on any timeframes. Candlestick analysis from different timeframes is used for opening positions. Positions are closed using the automated trailing system or by an opposite signal. The EA does not have input parameters affecting the trading algorithm. Timeframe: any (candlesticks from M15 to H4 are used) Currency pair: any (it is recommended to simultaneously use at least 4 major currency pairs).
Parameters LotSize - lot value parame

This indicator draws Fibonacci level automatically from higher high to lower low or from lower low to higher high combinate with Pyramid Trading Strategy for better risk reward ratio. With adjustable Fibonacci range and has an alert function.
What is Pyramid Trading Strategy? The basic concept of pyramiding into a position is that you add to the position as the market moves in your favor. Your stop loss moves up or down (depending on trade direction of course) to lock in positions. This is how
The Expert Advisor generates trading signals based on the values of the FractalDivergence_Patterns indicator. A Buy signal is generated when the indicator detects a support level, and a Sell signal is generated when the resistance level is found (see Fig. 1: blue arrows show buying, red arrows show selling). The Expert Advisor does not require the indicator to be additionally used, and can display the appropriate support and resistance levels.
Parameters The "Fractal divergence parameters" blo

Bollinger Bands are volatility bands plotted two standard deviations away from a simple moving average. Volatility is based on the standard deviation, which changes as volatility increases and decreases. The bands expand when volatility increases and narrow when volatility capturing 85%-90% of price action between the upper and lower bands.
How it Works Knowing that the majority of price action is contained within the two bands we wait for price to break out of either the upper or lower band a

The Expert Advisor is easy to use. The EA operating principle is to start active trading, to open several orders in different directions and to close them by averaging.
Advantages Easy to use. Reasonable price. Customer support. Works with any signal delay and any spread value. Trades using pending BuyStop and SellStop orders.
Recommendations It is recommended to stop the Expert Advisor operation during important news releases. The EA is recommended for use on one of the major currency pairs
If you want to add a pattern indicator to confirm the market movement you are in the right place, this indicator permit to detect some famous candle patterns Hammer, Inverted Hammer, Shooting Star, Hanging Man and Engulfing patter that can be highlighted on your chart once the patters occurs. Up, Down arrows are traced at the beginning of the new bar each time a pattern is detected.
Parameters Body to Bar Fraction (%) : the body size / the candle size (20% by default) Max Little Tail Fraction

This indicator can send alerts when a Heiken Ashi Smoothed color change occurs. Combined with your own rules and techniques, this indicator will allow you to create (or enhance) your own powerful system. Features Can send all types of alerts. Option to delay the alert one bar in order to confirm the color (trend) change. Input parameters Wait for candle close: 'true' or 'false'. Setting it to 'true' will delay the alert to the opening of the bar following the bar where the color change occurred.
FREE

The indicator shows when every market session starts and finishes in colored frame box. It includes the Stop Hunt Boxes which shows pockets of liquidity, found at places where traders put their stop losses on existing positions. Contains EMA crossover alert on 50 EMA , 200 EMA and 800 EMA . It can be used in many Forex strategies and for easier observe of the chart.
Indicator parameters NumberOfDays - period of drawing the frames, default is 50 days; Draw_asian_box - draw the box of Asian ses
Key Features This application is designed to quickly place a pending order or open a position at market. The position volume will be calculated automatically according to the risk settings. This application also manages orders and positions. Everything is simple, you only need to specify the price of the order (or position by market) and stop loss. The type of the pending order is selected automatically depending on the logic of the relative location of the current price, pending order price and

The RightTrend indicator shows the direction of trend and reversal points (market entry and exit points). It is very easy to use: open BUY deal when the up arrow appears and open SELL deal when the down arrow appears. The indicator generates accurate and timely signals for entering and exiting the market, which appear on the current candle while it is forming. In spite of apparent simplicity of the indicator, it has complex analytic algorithms which determine trend reversal points.
Inputs stre

The Commodity Channel Index (CCI) is an oscillator that is often used by forex traders to identify oversold and over bought conditions much in the same way as the RSI or Stochastics.
How it Works The idea behind this indicator is simple, we wait for price to reach an extreme (overbought or oversold) and then trade when price appears to change direction in the hope of catching a move out of the area. Buy signals - The indicator waits for the CCI to become oversold (a value below -100). The indi
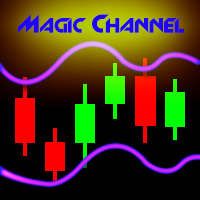
Magic Channel is a channel indicator for the MetaTrader 4 terminal. This indicator allows finding the most probable trend reversal points. Unlike most channel indicators, Magic Channel does not redraw. The alert system (alerts, email and push notifications) will help you to simultaneously monitor multiple trading instruments. Attach the indicator to a chart, and the alert will trigger once a signal emerges. With our alerting system, you will never miss a single position opening signal! You can t

With My Fx STATISTICS you will be able to see your account´s performance directly on the chart of Metatrader 4, and refresh the data even every minute. No need of external analyzer webpages. Information provided: DAILY, WEEKLY AND MONTHLY PROFIT. PROFIT FACTOR % OF PROFITABLE TRADES AVERAGE PROFIT / LOSS TRADE (MONEY AND PIPS) BEST PROFIT / LOSS (MONEY AND PIPS) EXPECTANCY (AVERAGE PIPS PER TRADE) AND ALSO YOU WILL SEE THE ACTUAL PROFIT OF EACH CURRENCY PAIR
Input parameters
Refresh_data_minu

Rung トレンドインジケーター。インディケータは、価格変動の主な傾向を識別し、さまざまな色でマークしますが、主な傾向に対するノイズや短期的な価格変動を排除し、反応しません。 インディケータは、市場の現在のトレンドを決定するツールです。デフォルト設定では、価格がチャネル内で移動すると、インジケーターは上昇傾向(「強気」トレンド)、インジケーターは緑色の線でマークされ、下降トレンド(「弱気」)トレンドは赤色の線でマークされます。 、インジケーターは反応しません。コリドーまたは横方向の価格変動の値は、インジケーターの設定によって調整できます。
インジケーター設定の説明 striction_points-コリドーのサイズ(ポイント単位)。 factor_smoother-平滑化係数。 アラート-ユーザーデータを含むダイアログボックスを表示します。 Text_BUY-買いシグナルのカスタムテキスト。 Text_SELL-売りシグナルのカスタムテキスト。 Send_Mail- [メール]タブの設定ウィンドウで指定されたアドレスにメールを送信します。 件名-電子メールの件名。 Send_N
FREE

Take your trading to the next level with DFGX - our second generation Dynamic Fibonacci Grid. This new, powerful and easy to use application is specially designed and optimized for contrarian intraday trading, scalping and news trading on the Forex market. This system is the ideal solution for active professional traders and scalpers who are looking for innovative ways to optimize their strategy. The system also provides excellent opportunity for new traders who want to learn to trade in a syste

This long-term trading system works on 20 pairs and 1 timeframes. The Expert Advisor uses various trading systems, such as trend trading, countertrend trading and others. This increases the chances of sustained growth and reduces exposure to a single pair or individual operations. The risk is tightly controlled.
The EA has the built-in smart adaptive profit fixing filter. The robot has been optimized for each currency and timeframe simultaneously. It does not need arrival of every tick and h

Magic Moving is a professional indicator for the MetaTrader 4 terminal. Unlike Moving Average , Magic Moving provides better signals and is able to identified prolonged trends. In the indicator, you can set up alerts (alert, email, push), so that you won't miss a single trading signal. MT5 version can be found here You can test the program by downloading the demo version: https://www.mql5.com/en/blogs/post/749430 Advantages of the indicator Perfect for scalping. Generates minimum false signals.

The indicator displays the key support and resistance levels on the chart. The significance of these levels lies in that the price may reverse or strengthen the movement when passing such levels, since they are formed as a consequence of the natural reaction of market participants to the price movement, depending on which positions they occupied or did not have time to occupy. The psychology of the level occurrence: there always those who bought, sold, hesitated to enter or exited early. If the

This indicator shows the main trend on the current chart.
Features This indicator includes two bands, one is the inner white bands, another is the outer blue bands. If the white dotted line crosses down the white solid line, this means that the trend has changed to be bearish. If the white dotted line crosses up the white solid line, this means that the trend has changed to be bullish. Once the crossing happened, it will not repaint.
Settings ShowColorCandle: if 'true', it will show the colo

MQLTA Support Resistance Lines is an indicator that calculates the historical levels of Support and Resistance and display them as Lines on chart. It will also Alert you if the price is in a Safe or Dangerous zone to trade and show you the distance to the next level. The indicator is ideal to be used in other Expert Advisor through the iCustom function. This DEMO only works with AUDNZD, the full product can be found at https://www.mql5.com/en/market/product/26328
How does it work? The indicato
FREE

Note: this product is a free limited version of the full featured product Currency Timeframe Strength Matrix . It only includes AUD, CAD, CHF currencies instead of all 8 currencies. It includes only 5S, 1M, 5M time frames instead of all 8 (5S, 1M, 5M, 15M, 30M, 1H, 4H, 1D).
What is it? The Currency TimeFrame Strength Matrix is a simple and comprehensive Forex map that gives a snapshot of what is happening in the Forex market at the very present time. It illustrates the strength and momentum
FREE
At last! See the actual, oscillating RSI for multiple pairs & multiple timeframes, all on the one chart!
The Benefits of Multi TimeFrame / Multi Pair Analysis Multiple time frame analysis is one of the most important things you should be doing before you take every trade. The most successful traders rely on monitoring several timeframes at once, from the weekly down to the 1 minute. They do this because using only one timeframe causes most traders to become lost in the "noise" of random price

The Moving Average Slope (MAS) is calculated by detecting the moving average level n-periods ago and comparing it with the current moving average level. This way, the trend of the moving average can be drawn on the moving average line. This indicator allows to compare the slopes of two moving averages (fast and slow) to cancel out noise and provide better quality entry and exit signals SCANNER is included . Now with Scanner you can find trading opportunities and setups easily and faster.
Featu

Fix M15 is a fully automated short-term trading robot. The EA does not use hedging, martingale, grid strategies, arbitrage, etc. Fix M15 opens a trade during the Asian session in a narrow channel defined by MA and RSI indicators. Only one trade per one pair can be opened on the market at each given time. It can be closed by a certain TP, SL or after a certain time (set in the EA settings). Basic EA settings are configured for trading GBPUSD М5 for the terminal set to GMT+3 (summer time). The EA

The indicator uses the Chester W. Keltner's channel calculation method, modified by the well-known trader Linda Raschke. Due to the modification, the calculated channel contains a much more complete overview of the price movements, which allows increasing the probability of an accurate prediction of the upcoming price movement. Unlike the classic Keltner method, the base line of the channel is plotted based on the Exponential Moving Average, and the Average True Range is used to calculate the up
FREE

White Scalper is a fully automated Expert Advisor that uses a highly accurate scalping strategy. It works on all symbols and timeframes.
White Scalper advantages Flexible settings allow you to use the EA on virtually any instrument. No long stagnation period. Good testing results since 2000. No outstaying the losses. All trades are closed within a few hours. The Expert Advisor does not use hedging, martingale, grid strategies, arbitrage, etc. A stop loss is always set.
About Extreme settings
This is a fully multi-timeframe version of the Commodity Channel Index standard indicator, which works for any combination of timeframes. The indicator preserves the correct time scale for all charts at any intervals. When switching to a higher or lower timeframe, the time scale is not distorted. For example, one value of М15 will occupy 15 bars on М1 and 3 bars on М5 . The indicator allows you to see the real dynamics and the overall ratio for all selected periods, as well as accurately evaluat
This is a fully multi-timeframe version of the DeMarker standard indicator, which works for any combination of timeframes. Like my other multi-timeframe indicators, it implements the idea of saving the right time scale for all charts on any intervals. When switching to the higher or lower timeframe, the time scale is not distorted. For example, one value of М15 will occupy 15 bars on М1 and 3 bars on М5 . The indicator allows you to see the real dynamics and the overall ratio for all selected pe

Overview It only needs a small initial deposit. Suitable for multi-currency trading. Immunity to the large delay and the size of the spread. Monitoring of my accounts : https://www.mql5.com/en/signals/author/mizrael
How it works The EA opens orders based on a built-in indicator. The EA determines the order with the greatest negative profit each tick. Then it determines the total profit of Buy and Sell orders on each currency pair. If the total profit of Buy or Sell orders on each currency p

The indicator shows the trend of 3 timeframes: higher timeframe; medium timeframe; smaller (current) timeframe, where the indicator is running. The indicator should be launched on a chart with a timeframe smaller than the higher and medium ones. The idea is to use the trend strength when opening positions. Combination of 3 timeframes (smaller, medium, higher) allows the trend to be followed at all levels of the instrument. The higher timeframes are used for calculations. Therefore, sudden change
The Expert Advisor trades based on levels set by the user or an indicator (three indicators are built into the EA). The EA requires two lines for correct operation: one must be higher than the current price, and the other must be lower. The EA supports two line types: horizontal and trend lines. The two lines may have the same or different types. Lines can be used to draw a channel and set the EA to trade within the channel: buy at the lower line and sell at the upper line. It is also possible t
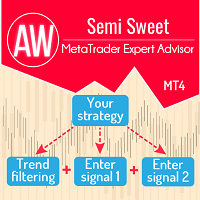
The Expert Advisor trades where the signal for opening a new order or restoring order is an indicator strategy, which is defined by the user in the input settings. You can choose indicators, their timeframes and the number of signals sufficient to open an order. A total of 29 trading indicators are available, on the basis of which the user can form his own trading idea without using programming. Problem solving -> HERE Expert Advisor modes: Hedging Auto mode, Netting Auto mode - Two modes o

このユーティリティを使用すると、戦略テスターで戦略を手動でテストできます。視覚化チャート上でワンクリック取引。
このユーティリティの最新バージョンは、トレーダーが取引戦略を手動でテストするための高度な機能を提供します。ストラテジー テスターを使用すると、シミュレートされた環境で取引戦略の有効性を評価できるようになります。この機能を使用すると、取引テクニックのパフォーマンスを分析し、それらを改良して取引スキルを向上させることができます。 さらに、ストラテジー テスターは、視覚化チャート上でワンクリック取引で取引を実行する便利で効率的な方法を提供します。この機能により、異なる画面を切り替えることなく、希望の価格レベルで取引を迅速に開始および終了することができます。 ストラテジー テスターで利用できる完全な機能を使用すると、取引戦略をシミュレーションして洗練し、結果を分析して、取引スキルを効果的かつ効率的に最適化できます。 MT5 のバージョン
完全な説明 +DEMO +PDF 購入する方法
インストールする方法
ログファイルの取得方法 テストと最適化の方法
FREE

現在の、すべての、または選択されたチャートの取引手段を変更し、時間枠を変更し、すべてのチャートを履歴内で(自動的にまたはクリックして)同時に移動するように設計されたユーティリティ。シンボルのリストは、「市場の概要」から読み取られます。ボタンの色、サイズ、位置を変更できます。チャートの同期は、同期ボタンをクリックしたとき、またはマウス/キーボードを自動モードで移動したときに、アクティブなチャートの最初の表示バーの時点で発生します。 TFは、カーソルキー(左/右)と取引記号(上/下)を使用して変更できます。 8つの主要通貨のボタンを使用すると、通貨ペアのリストからチャートを開くことができます(市場の概要またはユーザー文字列から取得)。新しいチャートのテンプレートは、「新しいチャートのテンプレート名」パラメーターで指定できます。通貨を変更すると、現在のチャートのテンプレートが保存され、インジケーターによって開かれたチャートでペアの通貨が置き換えられます。通貨を再度選択すると、対応するテンプレートが読み込まれます。
複製モードでは、オブジェクトを現在のツールのすべてのチャートに一度にコピーで

オープン ポジションと指値注文を管理するための手動取引用 EA。組み込みのトレーリング ストップには 5 つのモードと 7 つの商品があります。 バーチャル ストップ ロスとバーチャル テイク プロフィットがあり、チャート上を自由に移動できます。 組み込みの取引シミュレーターを使用して、EA がストラテジー テスターでどのように機能するかを確認できます。 UTrailing の詳細なガイドは、「コメント」セクションにあります。 利点 5 つのトレーリング ストップ モード: 仮想、通常、合計、パーセンテージ、およびモバイル ストップ ロス。 7 つのオプション: ポイント、バーの極値、フラクタル、ボリューム、MA、パラボリック SAR、ATR。 仮想 TP および SL - グラフに従って手動で自由に移動します。 すべてのオープンポジションにストップロスとテイクプロフィットを追加する; ストップロスの設定: ポイント、フラクタル、ATR インジケーター、毎日の高値/安値; チャートで開かれたすべての注文のトレーリング ストップ; トレーリングストップを開始するためのミニ利益. マジック

MQLTA Support Resistance Lines is an indicator that calculates the historical levels of Support and Resistance and display them as Lines on chart. It will also Alert you if the price is in a Safe or Dangerous zone to trade and show you the distance to the next level. The indicator is ideal to be used in other Expert Advisor through the iCustom function. This indicator can be tested LIVE on AUDNZD with the following DEMO https://www.mql5.com/en/market/product/26572
How does it work? The indicat
FREE
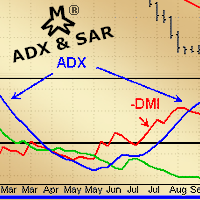
MMM ADX & SAR strategy: As requested by some experienced traders, this EA's strategy uses its 2 built-in indicators to enhance its signals and decide to open a new order at the right time, there is an ADX indicator and you may choose its signal's strength, a parabolic SAR to help and confirm the trends and a MA to check if the prices are deviating from its pattern. By joining both indicators' data and the moving average, it is possible to calculate a good and strong trend direction, avoiding sud

This indicator is a multitimeframe trading strategy. It has the levels for stop loss, take profit and entry point. The order level can also be set manually. The indicator uses the regularity of the market, which manifests itself on all instruments, and does not require adjustment of the parameters. The strategy uses a proprietary approach to determining: trend, volatility, hierarchy of timeframe significance, the size of the history period (the number of candles), which is important for making a

Индикатор MQLTA Supertrend Multi Timeframe сочетает в себе значения Supertrend, найденные на нескольких таймфреймах, чтобы подтвердить тренд пары. Для работы утилиты необходим бесплатный индикатор MQLTA Supertrend Line - https://www.mql5.com/en/market/product/25951.
Как он работает? Индикатор проверяет состояние Supertrend на всех выбранных таймфреймах и отображает результат в виде легко читаемой таблицы.
Как торговать с помощью индикатора Supertrend Multi Timeframe Покупку следует совершать
FREE

This indicator is designed to detect high probability reversal patterns: Double Tops/Bottoms with fake breakouts . Please read also the blog post " How To Yield Big Winners Consistently! " which explains the concepts behind the ULTIMATE Double Top/Bottom indicator and how you can use a top-down approach to get 15 - 20R winning trades on a regular basis . The provided video shows the maximum performance of the indicator. With maximum performance, I mean that this could have been the profit if you

This Expert Advisor is designed to manage orders. It offers the following functions: Set a stop loss for an order having none. Set a take profit for an order having none. Close the last order if the total orders of a symbol are over the setting. Close the order if its lots are over the setting. Close the order if its profit in pips is over the setting. Close the order if its loss in pips is over the setting. Close the order if its profit in amount is over the setting. Close the order if its loss
FREE

Gegatrend EA is a cost averaging system with a sophisticated algorithm. It is secured by a built-in “ News WatchDog ” that suspends trading during news events. For full description: https://www.mql5.com/en/blogs/post/711269 Watch how it works: https://youtu.be/j17AR3uq6yI
Parameters SR timeframe long — timeframe for support/resistance leveling long direction. SR distance long — minimum distance in pips between long trades. SR level long — the number of trades to start using SR levels for long

The indicator compares pattern found on chart history with the current price movement. Since history repeats itself, then, by comparing the two patterns, indicator can predict the further movement of the price. The indicator allows you to overlay highlighted history pattern with current movement and you will visually see this movement and will be able to compare the past and the present. To compare two patterns, you need: It is necessary to find and highlight a pattern on the history chart of a
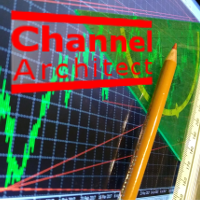
This utility calculates and draws lines over the chart. There are two types of channels: Channel A: the mainline is drawn using local Lows for uptrends and local Highs for downtrends. Channel B: the mainline is drawn using local Highs for uptrends and local Lows for downtrends. The parallel line of both types is built, using the maximum fractal between the base points of the mainline. There are few conditions which have to be fulfilled and can be changed in the parameters (see also picture 4): T

The Wing Patterns indicator scans for many different kinds of Patterns using an XABCD structure. The term Wing Pattern is used to refer to all types of patterns based on a general XABCD structure, which is plotted in an alternate high-low extreme form. In other words, assume that point X is started at a low point on the chart. The point A is plotted at the next highest point within a certain number of bars. This certain number of bars is called the depth level. In this example, point B would be

The Expert Advisor follows Puria trading method. RSI is used for sorting out signals. Also, the EA implements the averaging function.
Trading strategy Three Moving Average (МА) indicators combined with Moving Averages Convergence/Divergence (MACD) provide market entry signals . Sell as soon as First MA crosses Second MA and Third MA below and confirmation from MACD arrives (one bar has closed below the zero level). The Relative Strength Index (RSI) indicator is used as the signal filter . If R

This EA had been tested and optimized it for more than 1 year on real account. Many skilled traders give their suggestions on this EA optimization. Thanks to them. Basic description: The EA automatically loads different parameters for different pairs. The optimized and verified pairs include: EURUSD, AUDUSD, USDJPY, NZDUSD, EURAUD, GBPUSD. Suggested run on M1 or M5.
Features Target profit points is configurable. Minimum order opening interval is configurable. Max order number for one series is

Expert Advisor for night scalping. It works at the end of the American and at the beginning of the Asian sessions. Working time frame - M15 and M5. The EA features a news filter, which uses a news indicator. NOTE : The settings in the proposed set files are designed for brokers working according to Eastern European Time and New York trading time. When using with a broker that works according to a different time, it is necessary to manually adjust the EA operation time in the input parameters. ND
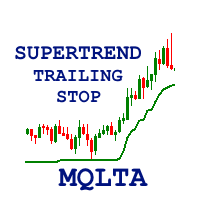
The Supertrend Trailing Stop will trail the Stop Loss price of your selected orders following the Supertrend Line, so you don't have to worry about having to change it manually. MQLTA Supertrend Trailing Stop requires you to install the FREE Indicator Supertrend Line https://www.mql5.com/en/market/product/25951
How does it work? The Expert Advisor sets and moves the Stop Loss price of the selected orders following the value of the Supertrend Line. You can filter the Orders by Symbol Comment Ma
FREE

MTF Heiken Ashi MA is a multiple timeframe Heiken Ashi & Moving Average indicator. Fully customizable for advanced & unique Heiken Ashi & Moving Average calculations.
Key Features Modified appearance and appeal from the traditional using only H eiken Ashi MA bodies. MTF Higher or lower timeframes available making this it great for trends and scalping. There are many settings that can be non-repaint for signals at a new bar and at bar 0.
Inputs Timeframe = PERIOD_CURRENT - timeframe of Movin
FREE
EnigmaMt4 is an Expert Advisor with an original trading strategy. The EA features a limited martingale (only four legs). It should be attached to any chart in the usual way.
Advantages of the EA It works on any timeframes. Works with any trading instruments. Built-in system of automatic profit calculation. It can work without user intervention.
Disadvantages of the EA Limited martingale is present.
Parameters Lot - position volume (0.1 lot per 1000 units of the deposit currency is recommen
FREE
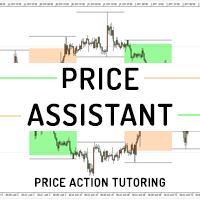
Price Assistant is a training indicator that will give you the ability to understand the primary logic of the price action. Designed for study, it has been programmed to provide to trader the ultimate ease of understanding the price logic. Price Assistant is not just a study aid provider, it is also an operational indicator that can provide you with good operating ideas. A label on chart gives you an input and it shows you the actual situation of the price action. You could work in real time upd

Some traders experience difficulties when it comes to limiting risks. This indicator helps traders define a suitable stop loss to limit trading risks. The indicator provides seven levels of risk limitation (recommended values are 1-3). The greater the risk, the greater the stop loss. Accordingly, the lower the risk, the smaller the stop loss, but the greater the probability of false triggering. In addition, the indicator shows trend signals and the current trend strength. This data can be used t

The Parabolic SAR Trailing Stop will trail the Stop Loss price of your selected orders following the PSAR indicator, so you don't have to worry about having to change it manually.
How does it work? The Expert Advisor sets and moves the Stop Loss price of the selected orders following the value of the PSAR Indicator. You can filter the Orders by Symbol Comment Magic Number Buy/Sell
Parameters PSAR Step - The Step of the PSAR PSAR Max Step - The Max Step of the PSAR PSAR Shift - The Shift of t
FREE

Automation for setting up Stop Loss, Take Profit and Trailing Positions can be opened with all platforms MetaTrader 4 MetaTrader Android MetaTrader iOS MT4 Web Trader The Expert Advisor will arrange Trailing of trades Market Execution Pending Order (Buy Stop, But Limit, Sell Stop, Sell Limit)
Input Parameters (all in pips) Take Profit - take profit value. Stop Loss - stop loss value. Trailing Start - trailing start. Trailing Step - trailing step/stop. Lock Start - lock start (first time traili
FREE

AR Canada is a fully automated Expert Advisor. It does not require any adjustments and is optimized for trading USDCAD H1. The product is a free version. It trades only using a fixed lot with the minimum volume. The Expert Advisor DOES NOT use hedging, martingale, grid strategies, arbitrage, etc. It uses a trading algorithm based on the intersection of two moving averages for analyzing the market conditions, as well as support and resistance levels. The Take Profit and Stop Loss values are fixed
FREE

AZscalper is an automatic Expert Advisor that works using pending orders. It has an advanced algorithm that uses the price like the principal indicator, in fact, during a substantial price movement (it doesn't matter if up or down), it places pending orders in both directions. This system has a preset small Stop Loss and big Take Profit, and the closure of the positive trades is reached by Trailing Stop. AZscalper works well on EURUSD, EURJPY, USDJPY and GBPUSD currency pairs with best result on

The ARIMA Trend Forecaster indicator is designed for analyzing and forecasting the trend component of a financial instrument based on the integrated ARIMA autoregressive model. The ARIMA methodology aims at identifying the presence of unit roots and the order of time series integration. In financial markets, autoregressive models are used for working with price time series to predict future price points. The ARIMA Trend Forecaster indicator using all the advantages of the ARIMA method allows to

Parabolic SAR strategies EA is a Parabolic SAR EA that can support multiple strategies. Purchasing this EA can save you the time taken to automate your existing PSAR strategy through coding a custom EA and it also helps you discover profitable Parabolic SAR strategies as its fully compatible with the strategy tester and all settings are editable. The EA supports both scalping, short term and long term strategies. The various supported settings are explained below: NOTE: The default settings in t
MetaTraderマーケットは、他に類のない自動売買ロボットやテクニカル指標の販売場所です。
MQL5.community ユーザーメモを読んで、取引シグナルのコピー、フリーランサーによるカスタムアプリの開発、支払いシステムを経由した自動支払い、MQL5Cloud Networkなど、当社がトレーダーに対して提供するユニークなサービスについて詳しくご覧ください。
取引の機会を逃しています。
- 無料取引アプリ
- 8千を超えるシグナルをコピー
- 金融ニュースで金融マーケットを探索
新規登録
ログイン