YouTubeにあるマーケットチュートリアルビデオをご覧ください
ロボットや指標を購入する
仮想ホスティングで
EAを実行
EAを実行
ロボットや指標を購入前にテストする
マーケットで収入を得る
販売のためにプロダクトをプレゼンテーションする方法
MetaTrader 4のための新しいエキスパートアドバイザーとインディケータ - 22
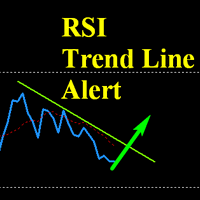
This indicator is an upgrade of traditional RSI on MT4. It can alert and push notificaton (if configured) when : -RSI line cross its MA line -RSI Enter and Exit Overbought and Oversold Zone. These zones can be set by input. -RSI cross line for both Trend line and Horizontal line. It has two working mode: on ClosedCandle and on RunningCandle. With ClosedCandle mode, it only alert when a candle is closed. Trader only draw a line (trend line or horizontal line) on RSI indicator window and the indi
Signal Trend Arrows is an indicator designed to generate trading signals. This indicator uses a number of different indicators and generates a signal using a number of historical data. It generally tries to calculate the trend return points. These trend returns may be sometimes very large, sometimes small. The investor should act with the belief that the signal may be small. These signals vary according to market conditions. The signals do not repaint. Currency pairs: Any. Work with at least 20

Colored Trend Bars indicator is a trend indicator working with a set of algorithms and a set of indicators. Trend finds trends by using many factors while you are there. This indicator has 4 mode features. Mode 1 represents short-term trends. Mode 2 represents medium to short term trends. Mode 3 represents medium to long term trends. Mode 4 represents long term trends. Easy to use and simple indicator. The user can easily understand the trends. This indicator has 3 trend features. Up trend, down

Trend rollback ea - полностью автоматический эксперт, для валютной пары GBPUSD Тайм фрейм M15 . Советник использует два авторских индикатора, 1 индикатор определяет направления тренда, 2 рисует канал. Советник открывает сделки, когда цена выходит за уровни канала (торговля по тренду) , после убытка робот будет удваивать лот , чтобы быстрее выйти в плюс. Советник не удваивает лот после каждого убытка, для того чтобы не было большой просадки баланса. Также советник использует фильтры , для бо
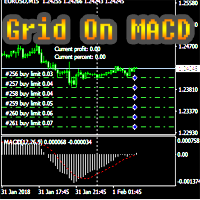
The Expert Advisor works according to the pattern of grid placement of limit orders both according to the trend and against the trend. The trend direction is determined according to the indications of the standard MACD indicator. MACD can be configured for any timeframe available in MT4. There is an opportunity to choose the direction of the order removal - according to the trend or against the trend. The Expert Advisor has flexible settings that allow you to tailor trading for any trading instr

Realization of trend movement indication with points for potential stops in the TrendCloud indicator. It can be easily used as an independent trading system. You can interpret this: the location of the course above or below the shadows show the presence of a trend. The transition to the shadow warns of a possible reversal. Entering the price inside the shadow speaks in a flat motion. The indicator tracks the market trend with unsurpassed reliability, ignoring sharp market fluctuations and noises
The EA's algorithm determines the current state of the market - a bullish trend, bearish, or sideways movement and opens positions in the direction of the intended price movement.
In addition, at the time of making a trading decision, the adviser analyzes 4 and 5 candlestick formations for a certain period of time. If more than 2 formations coincide with a positive result, the adviser makes an entry into the market.
The SAR indicator is used as a filter. The best results are achieved on trad

Strong Pivot trend indicator is a trend indicator that uses standard pivot calculation and some indicators. The purpose of the indicator is to calculate the possible trends using the pivot point. And to give the user an idea about trend direction.
You can use this indicator as a trend indicator. Or with other indicators suitable for your strategy.
Features The blue bar represents the upward trend. The yellow bar represents the downward trend. The blue pivot point represents the upward trend.

Super Trend Lines is an indicator that calculates trends using a set of channels and using a set of algorithms. This indicator helps to find trend return points. It generally represents an oscillator. This trend tracking system helps the investor to understand small or large trends and determines the direction according to it.
Time frames: M15, M30, H1
Parameters Period : general trend period. Bar : bar calculation setting Channel_Cal : channel calculation period. The smaller the value here,

Trend Waves indicator is a trend indicator that uses Average True Range and Standard Deviation indications. It is aimed to find more healthy trends with this indicator. This indicator can be used alone as a trend indicator.
Detailed review 4 different trend colors appear on this indicator. The aqua color represents the rising trend. Dark aqua color means the train is getting weaker. pink color represents the downtrend trend. The dark pink color means the trend is weaker. Parameters Stdeviati

Trade Trend indicator is an oscillator designed to calculate trend reversal points. A set of bar calculations and a set of algorithms to calculate trend reversals. Level probing system with high probability trends. All of these features combine to make it easier for investors to find trends.
Suggestions and Features There are two levels on the Trade Trend indicator. They are at levels of upper level and lower level. The oscillator bar should be below lower level to find the upward trend. And a

This indicator based on OBV. He is essentially trending , it can "feel" the trend change. The arrow-signal does not disappear and does not redraw after a bar closes. An order may be opened towards the arrow direction at the next bar after the signal appears. Using this indicator is intuitive. Once the first turquoise arrow appears, buying is preferred. Red – selling. I recommend using the indicator on the H1 timeframe. When the first hand of the opposite color appears and the hour bar clos

Relative Trend Bias
The Relative Trend Bias indicator is a simple indicator that helps you identify the current directional movement bias of a financial instrument based on the number of bars specified. Helps you identify the current trend based on a bar period of your choice Shows you level "safety zones" for reversals Shows you when the trade bias changes while the indicator is active on the chart
Indicator is forward facing. It does not backdraw/backpaint but it can be tested on the indi
The Expert Advisor places a grid of limit orders above and below the current price according to the settings. After the orders are triggered, the adviser controls the current state of profit. In case of reaching the profit specified in the settings (in the deposit currency), the adviser closes market and pending orders and opens the grid again. Settings Initial trading lot - Trading lot for the first order; LotKoef - The multiplication factor for each subsequent order; The distance to the firs
Данный индикатор отмечает участки разворота тренда, в точках разворота давая сигнал на вход в рынок в виде стрелок соответствующего цвета и направления движения в виде линий, а также звукового оповещения. Основан на закономерностях рынка FOREX, точных определениях текущего экстремума и нахождения свечных моделей на вершинах/низах рынка. Универсальный алгоритм помогает определить точки разворота указывая стрелками где осуществить вход в рынок. Дополнительно Индикатор не перерисовывается. Выводит

The work of the advisor is based on the lagging properties of trend indicators. At the time of finding the price in the consolidation zones, when the technical indicators data do not correspond to the current price formations, the adviser decides on entering the market.
Each transaction has a rigid stop-loss and take-profit.
Each trade is controlled by a trailing stop. Recommended trading instruments: EURUSD 5m, GBPUSD 5m, USDJPY 5m. Settings:
Comment to order - Comment to opened orders; Ta

The Trend Confirm indicator is a set of indicators and a set of channel movements. The purpose of the indicator is to find a healthy trend and designed to confirm these trends. There are two channels in the trend. The blue channel line is used to confirm the ascending trend. The green trend line is used to confirm the downtrend.
How to use? If the trend line in the indicator goes above the blue channel line, the trend is starting to rise. If the trend line within the indicator falls below the

Oscillator Trend indicator macd, divergence and a set of algorithms is a trend indicator. The aim of the indicator is to generate signals with high reliability using the above-mentioned calculations.
The indicator is very easy to use. Red arrows give sale signal. The Aqua arrows give a buy signal. Thanks to the alert feature, you can easily reach the signals. It works without any setting. It can be used in all time frames. The recommended time frames are m15, m30 and h1.
Parameters Trendline

Price action is among the most popular trading concepts. A trader who knows how to use price action the right way can often improve his performance and his way of looking at charts significantly. However, there are still a lot of misunderstandings and half-truths circulating that confuse traders and set them up for failure. Using PA Trend Reversal will be possible to identify high probability exhaustion moves of a trend. ️ AVOID NEWS AND SPEECHES - most of the bad signals are during the news/sp

Lite version of Muholov Trend Trader Multicurrency trend advisor. Analyzes and trades up to 8 trading instruments simultaneously. Always follows the trend. 4 timeframes are taken for analysis: W1, D1, H4, H1. The main trend is determined by the highest selected timeframe (W1, D1, H4 - selected by a trader in the settings). Transactions open with a signal on H1. Closing orders takes place by take profit or by chains, when the specified profit of the chain is reached (specified in the settings).

The advisor algorithm calculates the correlation between the built-in algorithms for determining the patterns of price movements. When the dynamically calculated required correlation level is reached, the adviser enters the market.
Each transaction is controlled by a short trailing stop, which accompanies each market order in both zones - profitable and unprofitable.
Advisor is recommended to use simultaneously on the following trading instruments: EURUSD M5, GBPUSD M5, EURGBP M5, USDCAD M5.

This Expert Advisor trades the trends, long and short. As soon as the momentum is big enough it enters a trader. When the momentum gets weaker the trade is being closed. So the Stop Loss and the Take profit is the momentum.
It is best suited for the currency pair EURJPY in H1 timeframe.
Inputs:
Lotsize: The lotsize for the trade StopLoss: Here you can set the S/L level (default: 0 = not active)
TralingStop: Here you can set the T/S (default: 0 = not active) TakeProfit: Here you can set th

The trend is your friend! This is what this indicator is all about. Follow this famous saying and be safe.
Characteristics:
Buy/Sell signals fixed on the close of a bar. Works on all symbols and all timeframes. Clear visual market trend laser line, Buy/Sell signal arrows, market strength meter, TP1 & TP2 boxes. Visual signals when to enter, when to exit the market. No repainting. Compatible with Flexible EA for trading automation. (Ask for a free set file optimized to perform 2010-2018) Para
This is the FXTraderariel TrendTrader .It analysis the trend and displays it, due to changing the changing the candle color. It took me over 12 Year to develop this system. But it shows the market perfect. Very easy to follow, even for beginners.
It works on all Pairs and all Timeframes (however we advice only pro traders to trade smaller Timeframes, novice traders should stick to higher TF like H4 and D1).
Depending on the settings it and trading style, it can be used for scalping or long-t

A trending market is one in which price is generally moving in one direction. ... When trading a trend-based strategy, traders usually pick the major currencies as well as any other currency utilizing the dollar because these pairs tend to trend and be more liquid than other pairs.
Best Trend Indicator That Tells You the Direction of the Trend
Trend MagicX_v1.1 displays the trend direction, duration, intensity and the resulting trend rating for all time frames in real time. You'll see at

Advisor trades inside the channel of the standard technical indicator Bollinger Bands. Advisor can work both in one and two sides simultaneously (option in the settings).
Closing of all positions on the trading instrument is made either by the total number of points, or when the profit is reached in percent of the balance.
Advisor is suitable for trading on relatively calm trading instruments.
You can see the principle of the adviser in a video. Settings:
Comment to Orders - Comments on

THE TREND IS YOUR FRIEND and I am your guide. Allow me to shed light to your surroundings in the darkness of trading. This indicator will give you the direction you need to trade with the trend. It does not require any specific settings, optimisation or curb fitting. No restrictions on symbols or time frames. It will work on metatrader 4 for any market and on all time frames. Does NOT repaint once candle closes. The Trend Qualifier is a great tool. It also helps to reduce the clutter on your c
Oscillator The Trend Signal indicator is an indicator designed to generate trend signals. It uses its own set of algorithms and the moving average indicator to find signals. It has the feature of filtering the signals with the channel system. In this way, it tries to improve the quality of the signals.
Features and Trade strategy There are two channels in the indicator. These channels are 70 and -70 channels. You will reach the signals without losing time thanks to the alarm features found on

Pro Strong Trend is an indicator that generates trend signal. It generates trend signal with its own algorithm. These arrows give buying and selling signals. The indicator certainly does not repaint. Can be used in all pairs. Sends a signal to the user with the alert feature.
Trade rules Enter the signal when the buy and sell signal arrives. Processing should only be initiated when signal warnings are received. It is absolutely necessary to close the operation when an opposite signal is receiv

Stronger Trend is an indicator that generates trend signal. It generates trend signal with its own algorithm. These arrows give buying and selling signals. The indicator certainly does not repaint. Can be used in all pairs. Sends a signal to the user with the alert feature.
Trade rules Enter the signal when the buy and sell signal arrives. Processing should only be initiated when signal warnings are received. It is absolutely necessary to close the operation when an opposite signal is received

This Cross Trend Signal indicator uses Donchian channel and ATR indicators. This trend tracking system uses historical data to buy and sell. This indicator does not repaint. The point at which the signal is given does not change. You can use it in all graphics. You can use it in all pairs. This indicator shows the input and output signals as arrows and alert. Open long deals on blue arrows Open short deals on red arrows When sl_tp is set to true, the indicator will send you the close long and cl
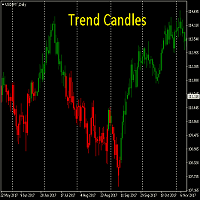
Know the TREND at first glance. The ability to see which way the market is heading instantly. This is a must for all trend traders. Works on all time frames. No need to optimise
DOES NOT REPAINT once candle is closed The Trend Candles are a great tool to replace standard candles. They also help to reduce the clutter on your charts and show you what you need to see - DIRECTION
Join my Telegram Analysis channel ( Free )
You will see how I use my indicators to get in & out of my trades.

The Super Cross Trend Advanced indicator is designed for trend and signal trading. This indicator generates trend signals. It uses many algorithms and indicators to generate this signal. It tries to generate a signal from the points with the highest trend potential. This indicator is a complete trading product. This indicator does not need any additional indicators. You can only trade with this indicator. The generated signals are displayed on the graphical screen. Thanks to the alert features y

Cross Trend Lines indicator trend indicator of find. This indicator, an array of works by using a series of indicator and algorithm. Uses two lines to find trends. The intersection of this line means that the start of the trend. These lines are green, tend to rise. Red lines indicate the downward trend. Use of this indicator is easy to understand. This indicator on its own or you can use other indicators that are appropriate for the strategy.
Suggestions and Features Starts a new trend at th
FREE
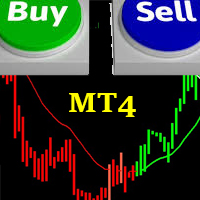
FRIENDLY TREND This indicator is based on the common saying in forex and stock trading that:"THE TREND IS YOUR FRIEND" It is easy to understand and follow; even newbies can achieve great trades out of it. It paints Green candles in an uptrend and signals BUY. It also paints Red candles in a downtrend and signals SELL. The indicator DOES NOT repaint. It is good for any time frame and currency pair. It can be used for Scalping, Day Trading and Swing Trading. Friendly Trend gives push notifications
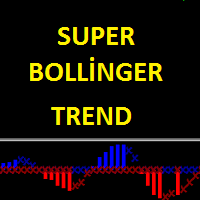
Super Bollinger Trend indicator is an oscillator designed to calculate trend points. A set of bollinger bands calculations and a set of algorithms to calculate trend reversals. Level probing system with high probability trends. All of these features combine to make it easier for investors to find trends. Prameters bollinger_Period - bollinger bands period setting bollinger_Deviations - bollinger bands deviations setting

TREND REBORN is a non-repainting indicator that shows you the trend of the market can be used as a trend filter or a trade entry or exit BUY when indicator is blue and SELL when Indicator is Orange only The indicator can be used alone or with another indicator based on your trading strategy
Timeframe All Timeframe can be traded Currency pairs All Currency pairs can be traded

The advisor determines the candle formations of the two timeframes (current and one timeframe below) and starts working towards the most likely price move. Main analyzable ligaments: Head-shoulders + flag; Head-shoulders + double top; Flag + tapering triangle; Absorption + hammer. Each transaction has a Stop-loss and Take-Profit. Each transaction is independent. Hazardous methods of work are not used. It is recommended to use currency pairs for the default settings: GBPUSD 15m и EURUSD 15m. You

This Expert Advisor is based on previous candlestick's price direction. Seven modes of operation with option to reverse signal. Assuming that current trend can be identified by checking status of one recent candlestick I have added additional strategies: 2/2, 2/3, 3/3, 3/5, 4/5, 5/5 candlesticks. For "1/1 Candles (Mode 1)": if previous candlestick's base currency has increased in value in reference to quote currency (close price is higher than open price) - uptrend is presumed and buy order is p

Kappa Trender is a unique indicator that will recognize trend direction and give you dynamically changing values for stop loss accordingly to further market movements and unique target calculations (take profit or trailing stop loss) based on last market movements. Even if you miss the signal (or close last trade at TP), this tool will give you range of price where you can re-enter with good risk-to-reward relation or you can enter manually and use current stop loss and take profit values. How

The advisor works on the basis of a strategy for determining the calm and volatile market conditions, as well as the phases of redistribution of trading activity.
In moments of increased volatility, the adviser analyzes similar price behavior (patterns) in the recent past, and if matches are found (the number of matches is configured by the user in the Strategy Accuracy parameter), the advisor decides to start trading.
Advisor does not use dangerous trading strategies based on lot increase a

The Trendes indicator works on all currency pairs and on all timeframes. The arrows indicate favorable moments and directions for entering the market. The probability of a successful trend is very high. Trendes can be used for both small pits and long-term trading. The indicator determines the entry points according to the methods described in the book "How to play and win on the stock exchange".
Options LengthA - The number of bars for calculating the first function; LengthB - The number of
This EA keeps an eye on drawn lines and opens orders according to a specification. Together with the included tool Trendline-Architect, which calculates and draws lines over the chart, it is a fully automatic EA.
There are two types of trends:
Trend A: the line is drawn using local lows for uptrends and local highs for downtrends
Trend B: the line is drawn using local highs for uptrends and local lows for downtrends
A few conditions have to be fulfilled. To understand and change

The Stepping Trend Indicator
The Steppi ng Trend indicator uses the average true range (ATR indicator) in its calculation. This gives you control to set your own average true range period, I set the Default as 10.
Indicator Details.
Green Arrow Up: This means you are at the starting point of a new bullish trend, it’s time to buy. Red Arrow Down : This means you are at the starting point of a new bearish trend, it’ s time to sell .
What if you miss the Arrow Signal?
No

This is the FXTraderariel PowerTrend . It compute a trendfollowing system based on it own algorithm. It gives you a buy or sell signal based on the trend. It based on the Supertrend, but our Version is not repainting. Furthermoore we added some Improvements and you can get an Arrow, Push or Alert when the trend changes.
Depending on the settings it and trading style, it can be used for scalping or long-term trading . The indicator can be used on every time frame , but we advise to use it on H1

The trading statistics indicator notifies the trader of the aggregate income of the trading account for different time intervals. The indicator has wide display settings on the graph. There is a choice of one of the two display languages on the chart- English and Russian.
Settings Indicator language (ENG, RUS) - Select the language to display on the chart; To control the magic (-1: any magic) - Entering the Magic for control (-1: any Magic); Angle of indicator tie - Selecting the angle of the
The Indicator automatically draws trend lines ( Support & Resistance Lines) when attached to any opened chart with any time frame. Button controls with on(green)/off(red) are provided to display the Support & Resistance lines of short, medium, long, very long, v.v.long trends. For ex: to display only short, long term trend lines, make sure that the short and long buttons are in green color and the remaining 3 buttons in red color. This free version works only with EURJPY pair. Please buy paid ve
FREE

The Indicator automatically draws trend lines ( Support & Resistance Lines) when attached to any opened chart with any time frame. Button controls with on(green)/off(red) are provided to display the Support & Resistance lines of short, medium, long, very long, v.v.long trends. For ex: to display only short, long term trend lines, make sure that the short and long buttons are in green color and the remaining 3 buttons in red color.

Multicurrency trend advisor. Analyzes and trades up to 300 trading instruments simultaneously. Always follows the trend. 4 timeframes are taken for analysis: W1, D1, H4, H1. The main trend is determined by the highest selected timeframe (W1, D1, H4 - selected by a trader in the settings). Transactions open with a signal on H1. Closing orders takes place by take profit or by chains, when the specified profit of the chain is reached (specified in the settings).
Parameters LotSize - base trade lo

Expert Advisor that uses breakthrough strategy to open positions. The EA allows one trade at a time(per currency pair), so there is no additional risk for the user. It offers Money Management Systems(MM) - AutoLot based on account equity and,of course, manual lot size set up. On further updates the Money Management strategies would be expanded. All parameters are optimized. Hour Selection Mode - When desired, user can easily set up hours of non-trade. Lot Management : Two setups available for m

The principle of this indicator is very simple: detecting the trend with Moving Average, then monitoring the return point of a chart by using the crossing of Stochastic Oscillator and finally predicting BUY and SELL signals with arrows, alerts and notifications. The parameters are fixed and automatically calculated on each timeframe. Example: If you install indicator on EURUSD M5: the indicator will detect the main trend with the Moving Average on this timeframe (for example, the Moving Average

DYJ TRENDWAVE features an advanced algorithm that detects new trends and current trend continuations for use as an entry strategy. DYJ TRENDWAVE's volatility is based on the power of buyers and sellers, it grabs total body size of candles and identifies the battle between buyers and sellers as a percentage of the total volume, like Sellers: (-)100% and Buyers: (+)100%. This information can be used for any entry and exit strategy. For bullish/Long Pin bar it is below the price line, for bearish/S

The Expert Advisor builds channels based on the data obtained using ATR and MA indicators according to the equations: Upper channel border = MA + ATR * (FIBO); Lower channel border = MA - ATR * (FIBO), where FIBO has the following values: Style of Trade - Aggressive = 1.61852; Style of Trade - Average = 3.26704; Style of Trade - Calm = 4.85556. Trades are opened inside the channel with the intervals defined in the settings. Long and short positions are opened independently. Positions are closed

The central strategy of the EA is based on the Elliott Wave Theory. When the second wave is a correction, you can open order in the direction of a trendline and use the fluctuations of the third wave to take profit. Stop loss will be set at the highest or the lowest price in the past. Each order has a stop loss. The EA is not Martingale, so the risk is controllable.
Parameters StoplossParameter: Actual stop loss = Theoretical stop loss multiplied by the stop loss factor, and the value range is

Советник работает по принципу хеджирования с периодическими "перекосами" в сторону трендовых направлений. Направления тренда советник определяет на основании стандартного индикатора Parabolic Stop and Reverse system (SAR). Уникальная стратегия установки балансирующих позиций позволяет избегать больших просадок даже при самых не благоприятных рыночных условиях. Параметры по умолчанию рекомендуется использовать на торговом инструменте: GBPJPY 15m. Разработка и оптимизация параметров производились

This Expert Advisor works using a grid in the direction of a trend movement with the step between opened positions defined in the settings. The positions are closed by the total take profit. The Parabolic SAR standard indicator is used to filter order opening, which comes in the MetaTrader 4 package. The EA has been developed and tested using 99,9% quality of quotes. Operation of the EA in real time can be viewed in the signals . The best trading results have been achieved on CHFJPY M15.
Setti
The trading system operates on seven pairs and one timeframe. The Expert Advisor uses trading systems for trend-based entries with the help of the Envelopes and CCI indicators. Each indicator uses up to five periods for calculating the trends. The EA uses economic news to calculate the prolonged price movements. The EA has the built-in smart adaptive profit taking filter. The robot has been optimized for each currency and timeframe simultaneously. Real monitoring: https://www.mql5.com/en/signal

Opening positions in the direction of the trend is one of the most common trading tactics. The main idea is that the probability of the trend continuation is higher than that of its change. This indicator determines the direction of a local movement, marking the beginning of a trend with a large dot and its continuation with a line of the corresponding color.
Distinctive features No Repaint. Simple and accurate settings. Clear and understandable signals. Works on all timeframes and symbols. Su

The strategy of this Expert Advisor is based on a hedging system, which implies placing opposite orders. The EA algorithm determines trend beginning and opens a position in the trend direction. In case of a wrong entry, the EA tries to neutralize the drawdown through opposite (hedging) orders at a preset interval (Coefficient of counter orders). Orders are closed when one of the two values is reached - profit in percent or profit in points. The EA does not use lot increase. The EA wast tested

Folding rule of 4 trend lines The indicator has been created based on the "Folding rule" trading strategy. It shows four pairs of inclined resistance and support lines. These lines are plotted based on the nearest High and Low of the ZigZag technical indicator with four given input parameters. The indicator draws dots above and below the price extremums that have been used for plotting the trend lines. The indicator of trend lines facilitates the plotting of trend lines, channels and technical p

DYJTRENDWAVE features an advanced algorithm that detects new trends and current trend continuations for use as an entry strategy. DYJTRENDWAVE's volatility is based on the power of buyers and sellers, it grabs total body size of candles and identifies the battle between buyers and sellers as a percentage of the total volume, like Sellers: (-)100% and Buyers: (+)100%. This information can be used for any entry and exit strategy. For bullish/Long Pin bar it is below the price line, for bearish/Sho
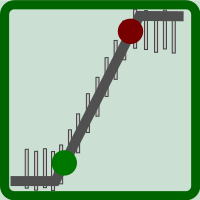
This indicator serves to depict the beginning of the trend (these are the green and red points of the graph). It is called simple because there are very few setup parameters, but it is essentially a set of rules - it is used a combination of WATR and a set of MAs. By combining their readings, it determines the direction of the trend.
How to use When there are green points on Main line of indicator, the trend direction is UP and you can BUY. When there are red points on Main line of indicator,
The Expert Advisor algorithm determines on daily charts those candlestick patterns, which set the intraday trading direction. The trading EA determines how long the price is moving in overbought/oversold zones and starts working in the direction of the expected trend movement. Each position is accompanied with a tight stop loss and take profit. Only one active position can be open in the market. The EA was developed and tested using 99% quality quotes. The Expert Advisor has a built-in news filt

Trends Hunter Expert Advisor is designed for medium-term trading. It is not a martingale and it does not depend on an account type (ECN, STP etc.) or spread level. This is a fully automated EA that features a custom algorithm for recognizing the price action and origination of a trend. If the EA identifies the beginning of a trend, one trade is opened. If a trend continues, the EA adds to the position. The number of addings is adjusted by the settings.
Options
Lots - fixed lot size; EMA1/EMA2

Trend-Scanner is an indicator for MetaTrader 4 that allows you to view 3 types of trends and signals on the charts. Trend-Scanner searches for 3 types of trading signals on all the underlying assets listed in the settings (and can be customized by the trader). If there are conditions that allow you to identify reliable trends then a pop-up alert will be displayed, a sound notification and a push notification will be sent. Trend-Scanner constantly searches for signals deriving from patterns devel

Arrow indicator utilizing variable Parabolic SAR and EMA for trending markets . Will show trend being established and trend continuation , allowing you to ride long trends or scalp. Designed for: Scalping Intraday trading Long-term trading Effective for: Currency Pairs Indices Oil Silver Gold Crypto Recommended timeframes: H1 H4 Daily Weekly Monthly For shorter timeframes, please adjust fully customizable settings. Test to find the optimum settings to suit your trading style. Function
Arrow is
The Omega Trend Indicator is an advanced tool that has been specifically designed to detect market trends early, and follow them efficiently. The indicator draws two lines. The main (thicker) Trend Line represents the presumed lower or upper volatility limits of the current market trend. A break in the main Trend Line indicates a potential reversal or shift in the movement of the trend. The Trend Line also indicates the best point to place a stop loss order. In Omega Trend Indicator, the Trend L
FREE
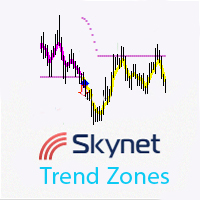
Skynet Trend Zones is based on classical indicators and some mathematical calculations and works in different market conditions for showing the trend. The principle of operation is as follows: if the price moves in a range, then a flat line is shown below or above the price depending on the previous trend; if the price moves down or up without a rollback, a line is shown at an angle to the price, and when a small rollback occurs, the indicator line is built again horizontally. Thus, you can work

Viper Trend indicator is an indicator designed to find trends. It uses a moving average, a set of candle combinations and High/Low levels to find trends. This indicator is a complete trading system. You can trade with this indicator as you like.
Features and Recommendations You can use this indicator on all pairs except for the volatile pairs. It is recommended to use it on M15 and over charts. The most important element in this indicator are alerts. Do not open orders unless you receive an al
CutTheTrend FX is an automated trading Expert Advisor, which does not use indicators, because the analysis of history often leads to incorrect decisions in the future. The Expert Advisor analyses the current market situation based on Price Action and opens a position according to these calculations. It opens one position, but, if necessary, can apply grid algorithms to maintain positive operation. Also the EA is equipped with protective techniques, such as Trailing stop and Risk Blocking (see th
MetaTraderマーケットが取引戦略とテクニカル指標を販売するための最適な場所である理由をご存じですか?宣伝もソフトウェア保護も必要なく、支払いのトラブルもないことです。これらはすべて、MetaTraderマーケットで提供されます。
取引の機会を逃しています。
- 無料取引アプリ
- 8千を超えるシグナルをコピー
- 金融ニュースで金融マーケットを探索
新規登録
ログイン