YouTubeにあるマーケットチュートリアルビデオをご覧ください
ロボットや指標を購入する
仮想ホスティングで
EAを実行
EAを実行
ロボットや指標を購入前にテストする
マーケットで収入を得る
販売のためにプロダクトをプレゼンテーションする方法
MetaTrader 4のための無料のエキスパートアドバイザーとインディケータ - 6

BolingCustom is a Trend indicator designed for all Time frames and all currency pairs. For a better experience, it is recommended to use in time frames above 15 minutes.
Due to its understandable and simple presentation on the chart, even beginners can easily learn how to use it.
If you have any problems or questions, let us know. We will be happy to contact you: Direct massage
How this indicator works is that it shows the trend using a combination of several indicators such as the Bo
FREE

Heiken Ashi Button Heiken-Ashi , often spelled Heikin-Ashi, is a Japanese word that means "Average Bar." The Heiken-Ashi approach can be used in conjunction with candlestick charts to spot market trends and forecast future prices. It's useful for making candlestick charts easier to read and analysing patterns. Traders can use Heiken-Ashi charts to determine when to stay in trades while the trend continues and close trades when the trend reverses. The majority of earnings are made when markets a
FREE

FREE UNLIMITED PM : https://linktr.ee/ARFXAUTOTRADE?utm_source=linktree_admin_share
Bagaimana Cara membaca market melalui FMCBR-W - Didalam dunia trading ini pelbagai cara digunakan oleh trader dan penganalisa market membaca dan memahami trend. - Dari sudut FMCBR permulaan trend atau permulaan pullback dikenali melalui CB1. Apa pun dari sudut FMCBR-W trend didefinasikan melalui 3 combinasi yang saya akan kupas di muka surat seterusnya nanti. - Saya amat berharap agar pengunaan FMCBR-W nanti
FREE
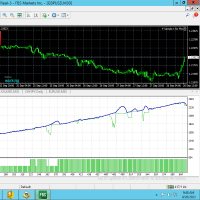
It's only good works on EURUSD M30 Timeframe. This robot is profitable. This robot requires minimum deposit of $1000 for small DD . You can get good results with it. You can test it first. You can increase the equity percentage. It will increase the volume in a certain ratio as the equity increases. You don't need to increase the volume by yourself. For the first few days, use the equity volume setup in this robot and then test and increase the equity setting. Another Same MT5 Product link: htt
FREE

This indicator uses a different approach from the previous version to get it's trendlines. This method is derived from Orchard Forex, and the process of making the indicator is demonstrated in there video https://www.youtube.com/watch?v=mEaiurw56wY&t=1425s .
The basic idea behind this indicator is it draws a tangent line on the highest levels and lowest levels of the bars used for calculation, while ensuring that the lines don't intersect with the bars in review (alittle confusing? I kno
FREE

Simple Trading System Update !!! Follow this link to see our 2024 Strategy !!! ( Download the EAs scanner )
INTRODUCTION : The strength meter is an trading tool that is used to identify trending and consolidating markets based on the percentage rate.
HOW TO USE IT :
You can use this indicator with Deal Trading Trend >> Click Here << To use this trading tool to identify trending and consolidating markets (the most important part)
FREE

Title: EGO ea - MQL4 Expert Advisor Description: Unlock the full potential of automated trading with Ego ea, a powerful MQL4 Expert Advisor designed to enhance your trading experience. Developed by experienced traders and programmers, this EA incorporates advanced algorithms and smart risk management to optimize your trading strategy. Key Features: Intelligent Trading Logic: Ego EA utilizes a sophisticated trading algorithm that adapts to various market conditions, ensuring consistent performanc
FREE

The product Divergence Mom Stoch Adx Bears Bulls is designed to find the differences between indicators and price. It allows you to open orders or set trends using these differences. The indicator has 4 different divergence features.
Divergence types Class A Divergence Class B Divergence Class C Divergence Hidden Divergence
Product Features and Rec ommendations There are 5 indicators on the indicator Indicators = Momentum Stochastic Adx Bears Bulls 4 different divergence types are used
FREE

Dear Friend.. I share with you this simple Expert Adviser .. it is full automatic this Expert Adviser following the trend of the pair you install on or any stocks or indices , it is works like that: - when the trend on H4 chart show a start of up trend the expert will wait till the 15M & 1H charts show an up trend the EA will open a buy order directly , and do the same for down trend and open a sell order the buy or sell order lot size and take profit and stop loss will measured manually by
FREE

The Keltner Channel is a volatility-based technical indicator composed of three separate lines. The middle line is an exponential moving average (EMA) of the price. Additional lines are placed above and below the EMA. The upper band is typically set two times the Average True Range (ATR) above the EMA, and the lower band is typically set two times the ATR below the EMA. The bands expand and contract as volatility (measured by ATR) expands and contracts. Since most price action will be encompasse
FREE

The Rapid Reaper EA is a fully automated hybrid averaging EA that trades in sequences of lot increase and multiplication on both sides of the book. The system trades using market orders with take profits set across trade groups. This EA will work on any pair but works best on GBPUSD and USDCAD on the M5 timeframe. A VPS is advisable when trading with this EA. Check the comments for back test results and optimized settings. Please note: I have made the decision to give this EA away and many more
FREE
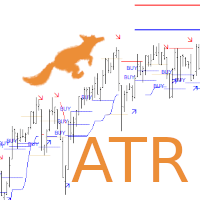
Are you looking for ATR Levels, ATR Trend, ATR Support and Resistance Indicators ? Now you have all in one !!! Info on your chart is showing you: where current price and levels are, what is current trend and signals. Search for an entry with low risk for trading by Lisek ATR Indicator. There are many ways to trade with Lisek ATR Indicator: Trade Support and Resistance Levels. Trade pullbacks (Range trading). Trade breakouts. Trade reversals. Take profit or set stop-loss based on ATR Levels.
FREE

Expert description
The Expert Advisor's trading system is based on entry and exit at a certain deviation of the asset price from the moving average value. The Expert Advisor has a number of parameters, by manipulating which you can implement different trading systems and also get different results when trading on different assets, keep this in mind when setting up an Expert Advisor and do not use standard settings on all instruments and time frames.
Recommendations for use
The EA working t
FREE

The Expert Advisor tool has been developed for NQ (Nasdaq), based on break logic and trend filter. The stop loss is based on fixed pips. It has been backtested on more than 10-year long on M1 data with high quality of modeling. The enclosed screenshots demonstrate the complexity and coverage of the test by Monte Carlo analysis with 200 simulations. The Expert Advisor passed via Cluster Analysis, Optimization profile, System parameter Permutation . There is no need to set up parameters - al
FREE

"Capture the sleeping and waking alligator." Detect trend entrance/exit conditions - this indicator can also be tuned according to your trading style. You can adjust a confidence parameter to reduce false positives (but capture less of the trend). This is based on a modification of the Alligator indicator by Bill Williams, an early pioneer of market psychology. 2 main strategies: either the " conservative" approach to more frequently make profitable trades (at a lower profit), or the " high r
FREE
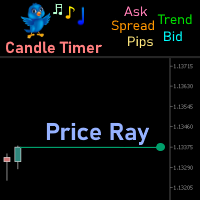
Price Ray indicator is a utility that will improve the way you trade. Primarily, it shows the Bid, Ask or Last price as a line ray which beams till the current candle, last visible chart candle or extended to all candle bars. The enhanced features in this indicator provide information in an area where you focus most, right next to the current candle. You can select text to be shown above or below the Price ray. The indicator is fully customizable, allowing it to fit any strategy requirements. Th
FREE

X-axis lines prevail in grid manner, ruled by Average True Range. There’s an inevitable change in specific periods of time of this matter! The Average True Range (ATR) indicator is not directly based on volume. Instead, it measures volatility in price movements. It’ll stretch, expand, shrink, and evolve with 4 timely choices of grid states! MATR means “multiplying average true range” in which grandeurs the grid pip-distant levels, seeming to grasp a wave of perfectly synched parameters in ac
FREE

I like a simple Robot and I will share with you. I can provide some information about using Simple Moving Average (SMA) as a trading strategy in Forex. SMA is a commonly used technical analysis tool in Forex trading. It calculates the average price of a currency pair over a specified period of time, and the resulting line can be used to identify trends in the market. Traders often use the crossover of different time period SMAs (e.g. 50-day and 200-day) to identify potential buy or sell signals.
FREE

A reversed engineered and improved version of the extremely popular AFSID scalper ( afs-id.com ). Includes re-modeled versions of these 2 well received scalping programs: " AF-Fibo ", and " AF-TrendKiller". Take note that this is a high risk scalper Though improvements have been made to mitigate some of the risks, the risks inherent to martingale scalpers still exists, so use it at your own risk.
afsida Scalper (improved AFSID)
This is a simple martingale scalper which works on any pair
FREE

Emulate TradingView drawing experience with magnet snap to the nearest price.
Supported drawing tools: Vertical Line Horizontal Line Trend Line Horizontal Ray (Angle Trend Line) Fibonacci Retracement Rectangle
Input:
Threshold (px) : The distance in pixel unit to snap the crosshair to the nearest price.
Feel free to write the review, request more features or report bugs.
FREE

Quantum nest is a robot advisor using trade hedging. Refers to trend advisers, working on a quantum variable system.. The Expert Advisor applies security varnishing orders and fixes the profit with only a positive balance. Suitable for any style of trading, scalping, medium and long-term trading. It is possible to use martingale in trade. The Expert Advisor works on all market instruments of the MT4 platform. ATTENTION! First of all, before work, it is necessary to optimize the adviser on your
FREE

The Fisher Transform is a technical indicator created by John F. Ehlers that converts prices into a Gaussian normal distribution. The indicator highlights when prices have moved to an extreme, based on recent prices. This may help in spotting turning points in the price of an asset. It also helps show the trend and isolate the price waves within a trend. The Fisher Transform is a technical indicator that normalizes asset prices, thus making turning points in price clearer. Takeaways Turning poi
FREE
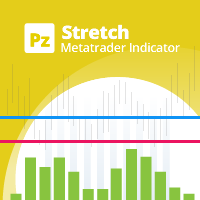
The Stretch is a Toby Crabel price pattern which represents the minimum average price movement/deviation from the open price during a period of time, and is used to calculate two breakout levels for every single trading day. It is calculated by taking the 10 period SMA of the absolute difference between the open and either the high or low, whichever difference is smaller. This value is used to calculate breakout thresholds for the current trading session, which are displayed in the indicator as
FREE

It's a multi-currency grid and martingale system that can trade all input pairs from one chart. The expert will close all orders for each pair using a profit level. The expert has the possibility to trade up to 100 pairs.
Information
Chose a broker with fast execution and low spreads for effective results. Please make some tests on a demo account to see how the expert works before using it on a real account. For 0.01 lot size and leverage 1:500, you need an initial balance of at least 10,000
FREE
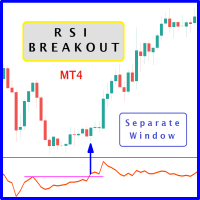
When prices breakout resistance levels are combined with Relative Strength Index oscillator "RSI" breaks out its historical resistance levels then higher chances emerges to record farther prices. It's strongly encouraged to confirm price breakout with oscillator breakout since they have comparable effects to price breaking support and resistance levels; certainly short trades will have the same perception. Concept is based on find swing levels which based on number of bars by each side to confir
FREE

Torakiki takes advantage from the only sure thing about Forex: price will move. It works 24/7 opening at any time two baskets, one in buy and one in sell. While the one that happened to be in the right direction keeps collecting profits, the other basket opens a grid with a clever recovery mechanism which closes positions one after the other as they reach their individual take profit in those usual bounces back you have even in the strongest trend formation, keeping track of the total profit
FREE
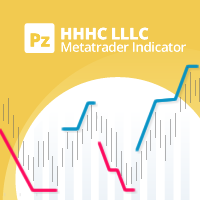
A personal implementation of a famous trend principle known as higher high, higher close, lower low, lower close (HHHC - HHHL). It uses price action alone to determine trend direction, trend changes and pullback zones. [ Installation Guide | Update Guide | Troubleshooting | FAQ | All Products ] Customizable breakout period Customizable colors and sizes It is non-repainting and non-backpainting It implements alerts of all kinds The indicator defines three price zones: Buy zones are blue Sell zon
FREE

Expert description
Algorithm optimized for Nasdaq trading The Expert Advisor is based on the constant maintenance of long positions with daily profit taking, if there is any, and temporary interruption of work during the implementation of prolonged corrections The Expert Advisor's trading principle is based on the historical volatility of the traded asset. The values of the Correction Size (InpMaxMinusForMarginCallShort) and Maximum Fall (InpMaxMinusForMarginCallLong) are set manually.
Recom
FREE

This is a smooth and responsive accelerometer which reveals the market trend and strength. [ Installation Guide | Update Guide | Troubleshooting | FAQ | All Products ]
Two moving averages indicate trend direction The histogram represents strength of the price movement It draws buy and sell zones as colored vertical lines Should be used as a confirmation indicator Customizable line widths and colors It implements alerts of all kinds This indicator is similar to MACD but aims to react faster t
FREE

In FX, signals from doji patterns can be effective in capturing potential trend developments. Therefore, setting pending orders simultaneously after the appearance of a doji can make it easier to capture the onset of a trend.
Setting stop-loss (SL) and take-profit (TP) levels more widely can enhance the probability of success, but it also increases the associated risk.
In the event of a loss, it is possible to recover by increasing the next position size through multi-lot trading, but this
FREE

Note : New in 1.6: the indicator now exports the trade signal (but not displayed). Go long with light blue. Go short with red. Exit otherwise. Signal to be imported to your EA using iCustom. This indicator provides Best of the Best linear filter momentum oscillators that I am aware of (Low Pass Differentiators, LPD's) . All of them are recent developments by this developer, or other researchers. The oscillator line is the first buffer of the indicator, and can be called in other indicators or
FREE

Limited time offer! For the launch of NextBot , which has been working on a real account for about a year doubling the initial capital, the price of this indicator will drop to FREE ! Introducing a pragmatic and innovative tool for MetaTrader 4 (MT4) traders: the Linear Regression Next channel indicator, enhanced with the determination coefficient R 2 . This indicator serves as a foundational tool for traders seeking to understand market trends through the lens of statistical analysis, spe
FREE
This indicator is a new version of the SuperTrend AM indicator. The indicator allows to open a position at the very beginning of the price movement. Another important feature of the indicator is the ability to follow the trend as long as possible to obtain all the potential profit while minimizing the potential losses. This indicator does not repaint or not recalculate. Signal of the indicator dot appearing above the price graph - possible start of a downtrend; dot appearing below the price grap
FREE
This is a custom indicator based on the Exponential Moving Average (EMA) angle, typically used to measure the trend angle of EMA lines. Here are the main parameters and functions of this indicator: Main Parameters: md1: Fast period for EMA, default value is 12. md2: Slow period for EMA, default value is 26. md3: Period for the MACD signal line, default value is 9. Functions: The indicator calculates the MACD indicator and categorizes data into different buffers based on the direction and angle o
FREE

Double Breakout is an automatic expert advisor with two separate strateges that uses martingale. The MACD indicator with adjustable parameters is used as inputs for each flow of orders. The specified takeprofit and stoploss levels are used to exit the position. General recommendation
The minimum recommended deposit is 1000 cents. Spread is recommended not more than 3 points. It is better to use trend currency pairs. The martingale parameter can be set from 0.1 to any value. When martingale
FREE

After purchasing, you can request and receive any two of my products for free!
После покупки вы можете запросить и получить два любых моих продукта бесплатно! The EA is based on third-party trend indicators, the EA has TP, SL and averaging. The entry is made on the signal of a trend indicator. By default, the currency pair is GBPUSD, EURUSD, H1 (other currency pairs are possible, and a different time interval), the recommended deposit with current settings is from $1000. You may be interested
FREE

This is an unconventional version of the Heiken Ashi Smoothed indicator implemented as lines rather than a histogram. Unlike a usual histogram, the indicator draws the readings of the two moving averages in the form of colored lines.
Example If the candle crosses two indicator lines upwards, a trend is assumed to be changing from bearish to bullish. If the candle crosses two indicator lines downwards, a trend is assumed to be changing from bullish to bearish. The indicator is good at displayin
FREE

SuperTrend AM is an indicator that allows you to open a position at the very beginning of a significant price movement. The second most important quality of the indicator is the ability to follow the trend as long as possible in order to obtain all potential profits while minimizing potential losses. This indicator does not repaint or not recalculate. A version of this indicator with advanced settings and signal notifications is SuperTrend 3 AM .
Signal of the indicator: red arrow appearing a
FREE

Ea Stepperは、mt4プラットフォーム用の完全に自動化されたExpert Advisorで、短期、中期、長期の戦略に使用できます。戦略は、ボラティリティが非常に低い期間を探して、日次トレンドの方向にエントリを配置することです。トレンドの方向が変化し、未解決の取引が不採算であることが判明した場合、ロットが増加した取引は反対方向に開かれます。
提供される条件:
スプレッドと手数料が可能な限り低いECNアカウント
ヘッジ口座レバレッジ500:1
VPS提供
1000ドルの最低預金が提供されます(少ない金額で使用できます)
入力パラメーター(最初にIN_ALL_CAPITALSパラメーターを最適化することをお勧めします):
MaxLotSize:取引の最大ロットサイズ。ブローカーの最大ロットサイズから分離できます。
MaxSpread:スプレッドがこれよりも高い場合、ピップはトレードされません。この値をブローカーのアドバタイズされた平均スプレッドに設定することを強くお勧めします。
MagicNumber1:アカウントの他のエキスパー
FREE
The Contraction/Expansion Breakout Indicator for MetaTrader 4 (MT4) is a powerful tool crafted to identify and signal the breakout of bullish and bearish contraction or expansion formations within financial markets. Utilizing advanced algorithmic calculations, this indicator assists traders in recognizing significant price movements that frequently accompany these formations, providing valuable insights for strategic trading decisions. Key Features: Contraction and Expansion Identification: The
FREE

Discover: The Quantum Forex Trading System _Mastering the Market with Advanced Algorithms & Multifaceted Strategies_ ---This system requires you to install https://www.mql5.com/en/market/product/104637 for trading signals to be generated. Redefining Forex Trading: In the vast realm of forex, where uncertainty is the only certainty, what if you had a tool that seamlessly combined the best trading strategies into one efficient system? Enter the Quantum Forex Trading System — a harmonious blend
FREE

McS Super Trend -This is one of the most popular classic trend indicators. It has a simple setting, allows you to work not only with the trend, but also displays the stop loss level, which is calculated by this indicator. Benefits:
Instruments: Currency pairs , stocks, commodities, indices, cryptocurrencies. Timeframe: М15 and higher. Trading time: Around the clock. Shows the direction of the current trend. Calculates the stop loss. It can be used when working with trading. Three types of no
FREE

Engulfing candlestick patterns are comprised of two bars on a price chart. They are used to indicate a market reversal. The second candlestick will be much larger than the first, so that it completely covers or 'engulfs' the length of the previous bar.
By combining this with the ability to look at trend direction this indicator eliminates a lot of false signals that are normally generated if no overall trend is taken into consideration
FREE

This indicator helps you to scan symbols which are in the Market Watch window and filter out a trend according to RSI.
The relative strength index (RSI) is a technical indicator used in the analysis of financial markets. It is intended to chart the current and historical strength or weakness of a stock or market based on the closing prices of a recent trading period. The indicator should not be confused with relative strength. The RSI is classified as a momentum oscillator, measuring the veloc
FREE

Concept
Market arranges in Time upcoming Phases according to the present Results of its Interest. Directing Modulations are an Interaction of immanent Periods, which show in Reference to Time cyclic Activity and to Price leveling Activity. PointZero is a projecting Price Mask of this Concept of Time and Price and categorizing developed Price Movements related to their own Range: how far moved ? indicating their Status by marking special Events: when which Action ? setting the Situation in a fu
FREE
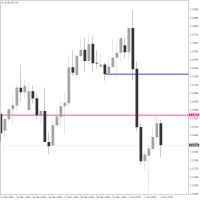
Crosshair Levels : Free version of Object Synchronizer. ** No synchronization of objects among grouped charts and no group chart features supported in this version. Are you bored to save and load template many times for the same symbol for many chart time frames? Here is the alternative. With this indicator, you enjoy creating 3 objects. All objects that you created/modified always are moved easily with clicking the object, moving cursor to the point you wanted and clicking again). Supported
FREE

The Most advanced and comprehensive EA to trade Trend Reversals/Pullbacks It is a very profitable EA, to trade trends breakout, and manage trades, takeprofit, stoploss, move to breakeven, and trailing stop.
The “Reversal Monster EA” trades Reversal/Pullbacks when the current price of the pair pullback to a predefined horizontal level or trendline on the currency chart. The opening of the position can be immediate after pullback to the drawn trendline or after closing the candle below/abov
FREE

The Flag Streamer Pattern indicator is an indicator designed to find flag and pennant patterns. When the legend finds patterns, it draws lines on the graph screen. Magenta lines represent the streamer pattern. Aqua colored patterns represent the flag pattern. You can change the pattern colors according to your request. Our Popular Products Super Oscillator HC Cross Signal Super Cross Trend Strong Trend Super Signal Parameters fs- =======Channel Trend Setting===== Channel - Channel period setting
FREE
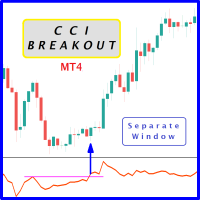
Probability emerges to record higher prices when Commodity Channel Index breaks out oscillator historical resistance level when exhibit overbought values. Since, oscillator breakout of support and resistance have similar effect as price breaks support and resistance levels, therefore, its highly advised to confirm price breakout with oscillator breakout; certainly, will have the same output in short trades. Concept is based on find swing levels which based on number of bars by each side of peak
FREE

If you trade or wish to trade the popular HLHB Trend-Catcher System, then this indicator is for you! It detects when the HLHB system entry rules are met and sends out an alert in the form of notifications to your mobile phone and to your pc. By automatically sending you notifications, this indicator lessens your trading work load as you don't have to sit in from of your pc all day checking all the chats for when the entry rules are met. This indicator does all the dirty work for you. When the si
FREE

This tools is design to easily forecast the projection of the current trend through the inputs of Zigzag and get out of the market when the trend do not the ability to maintain it's volatility to go further... the indicator gets the initial and final price from the value of zigzag automatically by adjusting the intdepth of zigzag. You can also switch from Projection to Extension from the inputs tab of indicator.
FREE

Market Insider is an excellent indicator for scalping the trend and also trading market breakouts and reversals. It is based on a ATR measured volatility channel and the CCI indicator. The green trend line and green bars indicates an uptrend and the red trend line and red bars indicates a downtrend. An intensive price breakout of some of the trend lines indicates a market breakout and a potential new opposite trend. In choppy-range behaving market and in low liquidity conditions the breakout sig
FREE

GTAS S-Trend is a momentum indicator that helps to determine trends using combination of MACD, RSI and moving averages. This indicator was created by Bernard Prats Desclaux, proprietary trader and ex-hedge fund manager, founder of E-Winvest.
Description The indicator oscillates between -65 and +65 with a neutral zone between -25 and +25 around a 0 equilibrium line. S-Trend between -25 and +25 indicates congestion zones with a bullish bias between 0 and +25, and a bearish bias between 0 and -25
FREE
Tipu Panel series is set of innovative indicators created to consolidate indicators in form of a panel. As a trader, indicators can easily create a cluster on the chart and distract you from the bigger picture. It can also be overwhelming and visually exhausting. Tipu Panel simplifies this by displaying each indicator in a beautifully boxed panel. You can customize the panel to display indicator signals for multiple time frames and also to quickly switch time frames. There are two types of indic
FREE

Forex Seeker USES THE TREND WAVE INDICATOR AND IT CAN IDENTIFY THE BEGINNING AND THE END OF A NEW WAVE TREND MOVEMENT.
AS AN OSCILLATOR, THE INDICATOR IDENTIFIES THE OVERBOUGHT AND OVERSOLD ZONES.
IT WORKS GREAT TO CATCH THE SHORT TERM PRICE REVERSALS AND USES A MARTINGALE STRATEGY TO CLOSE ALL TRADES IN PROFIT.
USE DEFAULT SETTINGS ON H1 OR HIGHER TIME FRAME ON ANY PAIR FOR MORE ACCURATE TRADES
WHY THIS EA :
Smart entries calculated by 3 great strategies The EA can be run on even a
FREE

FZR indicator determines fractal zigzag reversal pattern of all the time frames of the chosen symbol and shows the information in the Info label. Indicator draws the detected pattern in the chosen time frame and also you can select in the menu to draw the trend line according to FZR peaks. What it is FZR? See the first picture in the screenshots. As you can see for every peak of FZR the AO indicator must cross zero line. FZR indicator determines the trend direction.
How to use FZR for trading?
FREE

The "Trend Edges" indicator determines whether the trend is rising or falling. It is suitable for any time frame (tested on DAX).
The indicator should be treated like Bollinger Bands, meaning that if it breaks out upwards, you can buy with a stop loss below the lower edge.
Find a trending pair, index or CFD. Additionally :
-Sound alert on trend change.
-Alert Notification
-Alert Notification on your mobile phone Check my other indicator "Trend Edges histogram"
FREE

The MP Andean Oscillator is used to estimate the direction and also the degree of variations of trends. It contains 3 components: Bull component, Bear component and Signal component. A rising Bull component indicates that the market is up-trending while a rising Bear component indicates the presence of down-trending market. Settings: Oscillator period: Specifies the importance of the trends degree of variations measured by the indicator. Signal line per: Moving average period of the Signal line
FREE

Donchian channels are a tool in technical analysis used to determine the relative volatility of a market and the potential for price breakouts.
Can help identify potential breakouts and reversals in price, which are the moments when traders are called on to make strategic decisions. These strategies can help you capitalize on price trends while having pre-defined entry and exit points to secure gains or limit losses. Using the Donchian channel can thus be part of a disciplined approach to manag
FREE
Strategy for trend trading. The indicator shows entry points and displays TakeProfit and StopLoss levels on the chart, as well as calculates the overall result. ATTENTION! TI Opti Pro – a powerful tool for testing the input parameters for the TrendImprovement indicator will allow you to quickly find the most profitable options for the input parameters. New project.
Description.
It is no secret to anyone that there is no universal indicator that would be profitable on all currency pairs and
FREE
The Fractal LVL AM indicator analyzes the price patterns that form on the candlestick chart and display the turning points of the market trend. A fractal consists of candles, the middle of which is either the highest (upward fractal) or the lowest (downward fractal) of all the candles taken for analysis. Unlike the original indicator where fractals are formed by five candles (maximum/minimum in the center and two candles with smaller/larger maximum/minimum values on each side), the proposed ve
FREE

The indicator draws price channels. It can be customized so that only buy or sell channels are displayed. Also, trend lines can be displayed instead of channels. This indicator is easy to use, but nevertheless, there are many trading strategies based on channel trading. Advisor based on this indicator: https://www.mql5.com/en/market/product/37952 Parameters History - maximum number of bars to build channels; Distance - minimum distance from one High (or Low) to another when constructing a chann
FREE
Download the free version here.
A Full Concept of BUY/SELL Scalping Strategy Trend detection is one of the basic challenges of every trader. Finding a way to tell when to enter a trade is very important, timing is a game changer, not too early and not too late. Sometimes, due to not knowing the market conditions, the trader closes his positions with a small profit or allows the losses to grow, these are the mistakes that novice traders make. Indicator Trend Whipper is a complete trading st
FREE
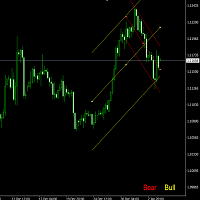
This indicator judges current trend, with Linear regression and the angle. Each parameters setting contents below. Period Period from current
Angle The angle of judging the trend
Width of Lines Width of Linear regression lines* Font size Font size of display text
Lines&Text colour Colour of display lines and test
* This parameter judges that if lines spreads too wide, there is no trend.
FREE

The GU_H1_120114111_S_Pi_CF_0712_SQ3 is an algorithmic trading strategy for MetaTrader, tested on GBPUSD using the H1 timeframe from April 1, 2004, to April 24, 2024. There is no need to set up parameters, all settings are already optimized and fine-tuned.
Recommended broker RoboForex because of EET timezone.
You can find the strategy source code for StrategyQuant at the link: http://quantmonitor.net/listing/gbpusd-pivots-trend-master/
Key details are:
Parameters
Main Chart: Curren
FREE

PrecisionWedge Detector X
Description: PrecisionWedge Detector X is an innovative indicator designed to identify and analyze wedge patterns on financial charts with unparalleled accuracy and precision. Developed using advanced algorithms, this indicator provides traders with a powerful tool to detect potential trading opportunities based on wedge formations. Key Features: Automatic Wedge Detection: Powered by sophisticated algorithms, PrecisionWedge Detector X automatically scans price data to
FREE

Record Session High Trader uses the concepts of within candlesticks trading to gauge when a trend might be wearing out and therefore ready for reversal or pause simply by looking at the candles. We call it a record session high when we get 8 or more previous candles that have higher closes. We call it a record session low when we get 8 or more previous candles that have lower closes. We don't rely on the typical Oscillation Indicators for recognizing overbought or oversold but more we rely on lo
FREE

Defines extremes. This indicator consists of two parts. The first draws lines on the chart indicating low volatility in relative daily market activity. The second is responsible for determining the extremum and gives signals to buy or sell. This system is suitable for all instruments. It is recommended to use a timeframe from m15 to h4. Before using, you need to choose the settings for yourself. Configure lines deviation. Specify volatility coefficient. Advantages The indicator does not repaint
FREE
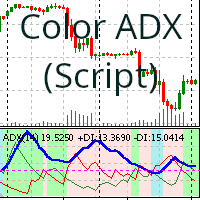
平均方向指数 (ADX) 指標の背景を買いまたは売りのトレンドに応じて色付けする (ドラッグアンドドロップ) スクリプト
平均方向指数 (ADX) 指標は、トレンドの強さを測定するために使用されるテクニカル指標です。この (ドラッグアンドドロップ) スクリプトは、買いまたは売りのトレンドに応じて ADX 指標の背景を色付けします。背景色は、スクリプトのパラメータによって決まります。 変更可能なパラメータ: Period: ADX 指標の期間。 Level: トレンドが強気か弱気かをフィルタリングするために満たす必要がある最小レベル (デフォルトは 0)。 Apply To: (Close price, Open price, High price, Low price, Median price, Typical price, Weighted price)。 Color Positive Trend: 強気トレンドの背景色。 Color Negative Trend: 弱気トレンドの背景色。 Color Neutral Trend: 中立トレンドの背景色。 Save variabl
FREE

Never miss a trend change again! This indicator uses various calculation methods based on price action to detect changes in the direction of the trend. It can be used on high timeframes (from H1 to D1) and is most suitable for H4 and Daily timeframe. This indicator is compatible with all broker symbols (forex, indices, CFD, commodities, crypto…). It is also possible to open the indicator on several charts to follow several symbols at the same time. In addition, you don't have to stand by your P
FREE
MetaTraderマーケットは自動売買ロボットとテクニカル指標を販売するための最もいい場所です。
魅力的なデザインと説明を備えたMetaTraderプラットフォーム用アプリを開発するだけでいいのです。マーケットでプロダクトをパブリッシュして何百万ものMetaTraderユーザーに提供する方法をご覧ください。
取引の機会を逃しています。
- 無料取引アプリ
- 8千を超えるシグナルをコピー
- 金融ニュースで金融マーケットを探索
新規登録
ログイン