仕事が完了した
指定
Hello,
i need an experienced developer for the following task. I have bought an indicator that draws so called "BlueBoxes" int the chart, see screen shot below. This indicator works only with my live trading account and could not be shared with developer.
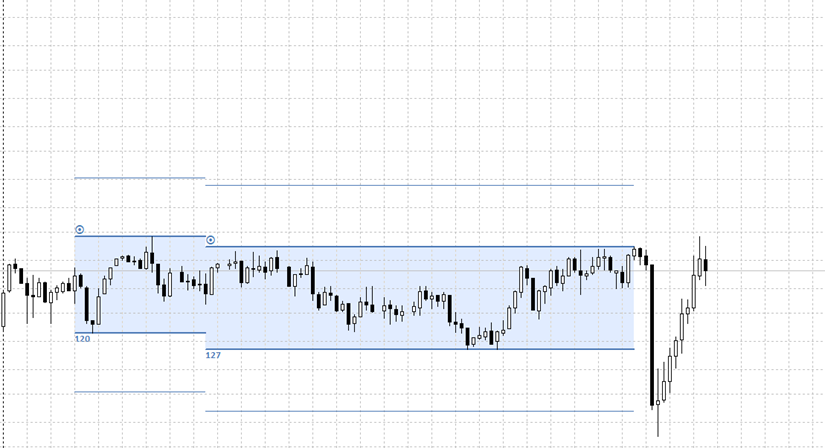
The screenshot shows two of the BlueBox in a M1 chart. The BlueBoxes are Objects (Trendline, Text). The color of the objects cannot be changed as it is given by the indicator, it is 74,120,181. The EA must be able to detect the actual BlueBox. In the screenshot above the right one. You see that the BlueBox has a top and a bottom, represented by two trendlines. The principle of the BlueBox trading is to go long at the top OR to go short at the bottom. Take a look at the screenshot again, the second BlueBox appeared with the last small white candle. At this moment the EA must place a pending long at the top and a pending short at the bottom. The levels of the pending orders must include the spread of the instrument. In this example the long black candle had triggered the pending short. If one pending short order is triggered, the other order must be deleted cause it is not necessary anymore. In this case the pending long must be deleted.
The EA must have a panel with a START and a STOP button to manually start the EA and stop it. When START is hit, the EA detects the actual BlueBox in the chart. Also it detects if there are any open trades regarding the EA. When START activated, it also detects if the actual BlueBox ist still valid to trade. The STOP button deletes all pending orders and closes all positions.
The panel and the input of the EA also includes a Risk parameter. Risk input is done in amount of currency, e.g. 100€. Also it had an input for the Stop Loss Level as for the Take Profit Level. Those inputs are multipliers of the distance between the top and bottom line of the Blue Box. Look at screenshot again. The difference is 127 pips. A Stop loss multiplier of 1.0 will set the stopp loss 127 pips away from the top or bottom line NOT from the entry level of the order!!! In this example the pending short order was triggered and the stop loss level would be +127 pips. Of course spread must be included into calculation. When SL is set to 0.5 then Stop Loss Level will be 0.5x127pips.
Same principle for the Take Profit level, multiplier of 0.6 means that the Take Profit is 0.6x127pips below the level of the bottom line. Also spread must be included when necessary.
Based on the risk input and the stop loss level the position size must be calculated and shown on the panel.
As said the EA must be able to detect if the actual BlueBox is valid to trade. The EA must check if the StopLoss or the Take Profit level had been triggered. If so the BlueBox is not valid to trade. Ckeck screnshot again, below the second (right one) BlueBox is a small bliue line. This blue line is 0.6x127 pips below the box. You see that this TP line was triggered. If i would hit START at the actual moment as i made the screenshot, the BlueBox wasnt valid to trade as the TP level was triggered.
Example how the panle must look like
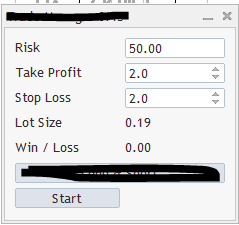 The developer of this panel shows the STOP button after the START button is activated. Actual win/loss shoudl be displayed.
I will use the EA to backtest the strategy. For this i need in the input of the EA a trade start and trade end setting. Trade start in hh:mm means that no trade starts before this, but if a BlueBox appears before and it is valid a trade would start when the trade start condition is true. At trade end (hh:mm) now new trades will be done. If there are open orders they will run into SL or TP. There will be no trailing stop.
EA must work on all timeframes (the BlueBox indicator does) and with all assets.
What if the EA detected a valid blue box, the actual price is outside the box but has not triggered the TP yet? When the price is above the top of the BlueBox it should place a limit buy at the top level of the BlueBox, if it is below the bottom of the BlueBox it should place a limit sell at bottom level.