指定
Three parts to it:
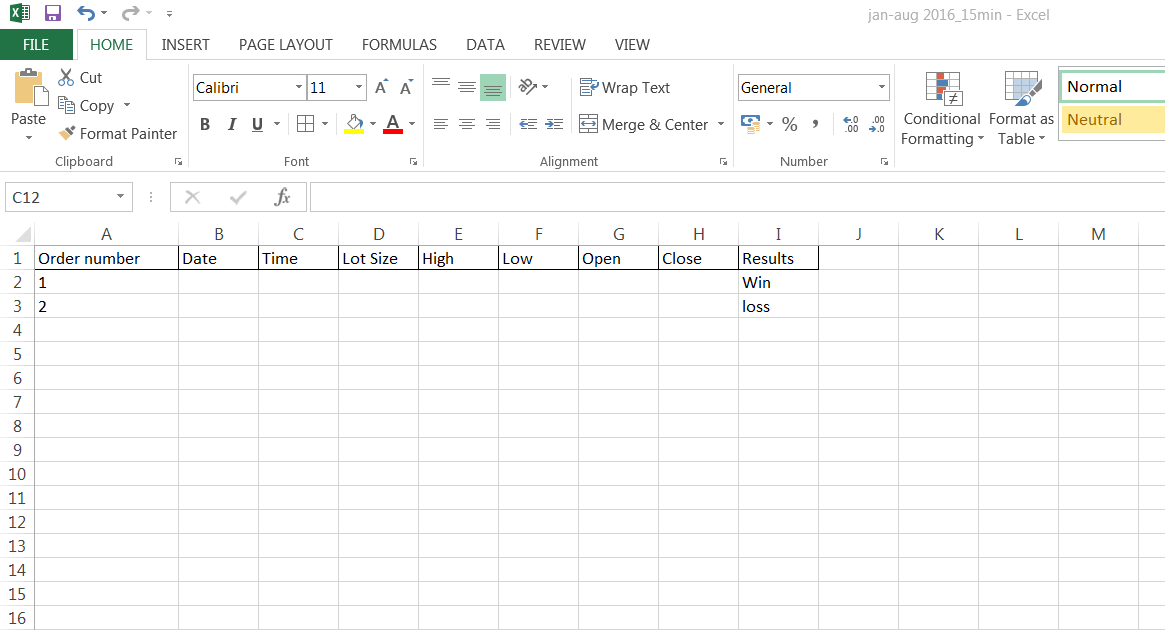
Part 1: to capture all candle data of each candle of whatever time graph i am using it on an excel spreed sheet.
e.g if i am running it on the 1min graph, then the required data would be:
A) high
B) low
C) open
D) close
also the time and date of such candle are to be displayed as well.
Part 2: The Martingale Strategy
I would like to incorporate the martingale strategy whereby for one trade lost the next trade would double the mount to win back what was lost in the previous trade plus a profit.
The input variables are:
a) The max consecutive loss (Max_loss) = this is the number that would represent a consecutive maximum loss and would also stop the EA from trading immediately. (Default value = 5)
b) Lot size (Lot_S) = this is the initial amount of money used for each trading. Note: whatever value chosen the martingale strategy must be able to adjust its lot size automatically for the next trade.
Part 3: Options of trading with martingale strategy (only one strategy can be selected at a time while trading):
1) Alternated option (Alt_op) = this is an option that would allow the martingale strategy to buy and then sell alternately regardless of conditions
2) Alternated option (Alt_op) = this is an option that would allow the martingale strategy to buy and then sell alternately regardless of conditions
3) One up and two down (1u_2d) = this is an option that would allow two buy trades consecutively and then followed by a sell trade.
4) Two up and One Down (2u_1d) = this is an option that would allow two sell trades consecutively and then followed by a sell trade.
The results of the data are to be captured in the excel spread sheet as well in either a win or loss grade
Please see the attached pic of how the data are to be captured in the excel spread shoot.