指定
I need a programmer familiar with Lua to convert an EA written in Lua (Atached) for Trading Station platform to MET4 and make some additional modifications as explained below to it:
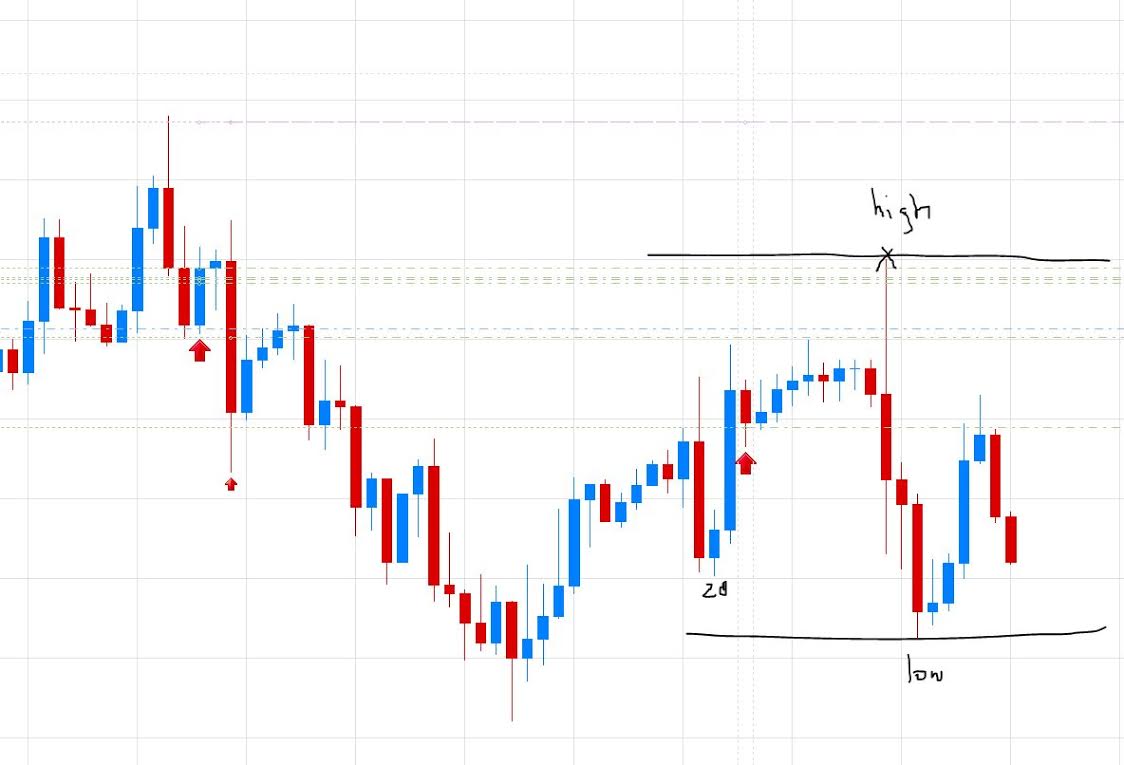
Option 1) EA needs to identify the High and Low price within the last X hours
EA to write down the two values found above on the active screen for manual confirmation by user and draw a horizontal line through the two values
EA Properties variable Options to include:
No of Hrs prior for Highs and Lows determination NOHPHLD
Example of high low when NOHPHLD = 20 hours
 a
a
Option 2) Also EA need to identify the Highs and Lows in the 2 previously completed ZigZag patterns And to draw the zigzag pattern on the active instrument chart as well as a horizontal line identifying the previous completed zigzag high and low. (I have included below the code for the ZigZag pattern I obtained from the list of TD Ameritrades indicators for your review and conversion to MET4 (granted the programming language of TD Ameritrade platform is different that the trading stations, but there are enough commonalities that you could possibly use that as a template for the type of variables and parameters I'd like the ZigZag indicator to include in it)
(Properties to be included are as follow):
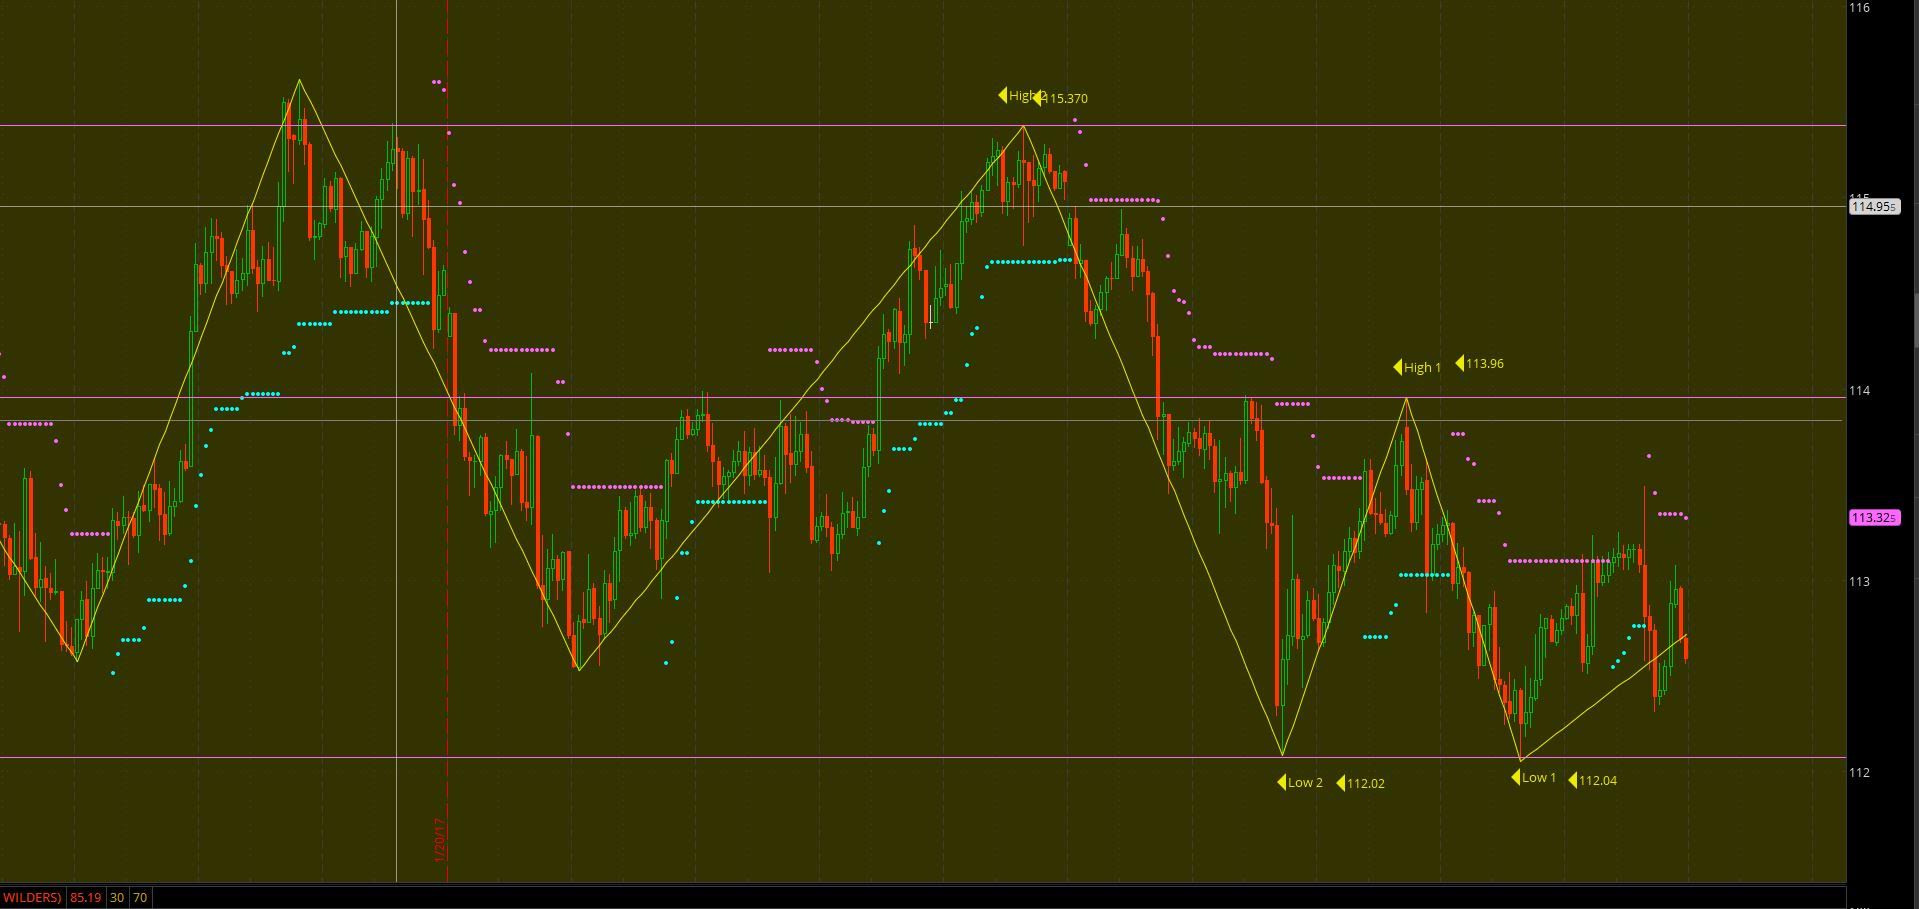
If the difference between the highs and lows is less than another user defined variable by the name of "Minimum accepted high low difference", then the EA will pick the higher or the lower of the previous zig zag High and Low until the difference between the highs and lows is greater than the "Minimum accepted high low difference".
Example: in the following figure, lets say that I set the Minimum accepted high low difference as 3.0
The previously completed zigzag high and low as seen below is 113.96 and 112.04. But the difference between 113.96 - 112.04 is less than 3. Therefore, the program would go back and pick the higher high and lower of the low of the two previous completed zigzag patterns which are 115.370 and 112.02. Now the difference between those two high and lows are greater than 3. Therefore, the program uses those two figures as the highs and the lows instead for the next part of the program.
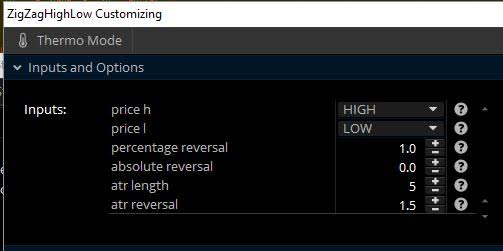
Other Variables to be included for this part of the EA:
ZZ Percent Reversal
Absolute Reversal
ATR Length
ATR Reversal
and Option to apply ZZ to one of the following chart times
30 min
1 hour
2 hour
4 hour
Trend stop_Color add ons:
Property to be added to the Trend Stop_Color strategy include options to either use the High Low value obtained from Option 1 above or option 2 above
Property to include a variable called “Delta pips from high Low (DPFHL)”
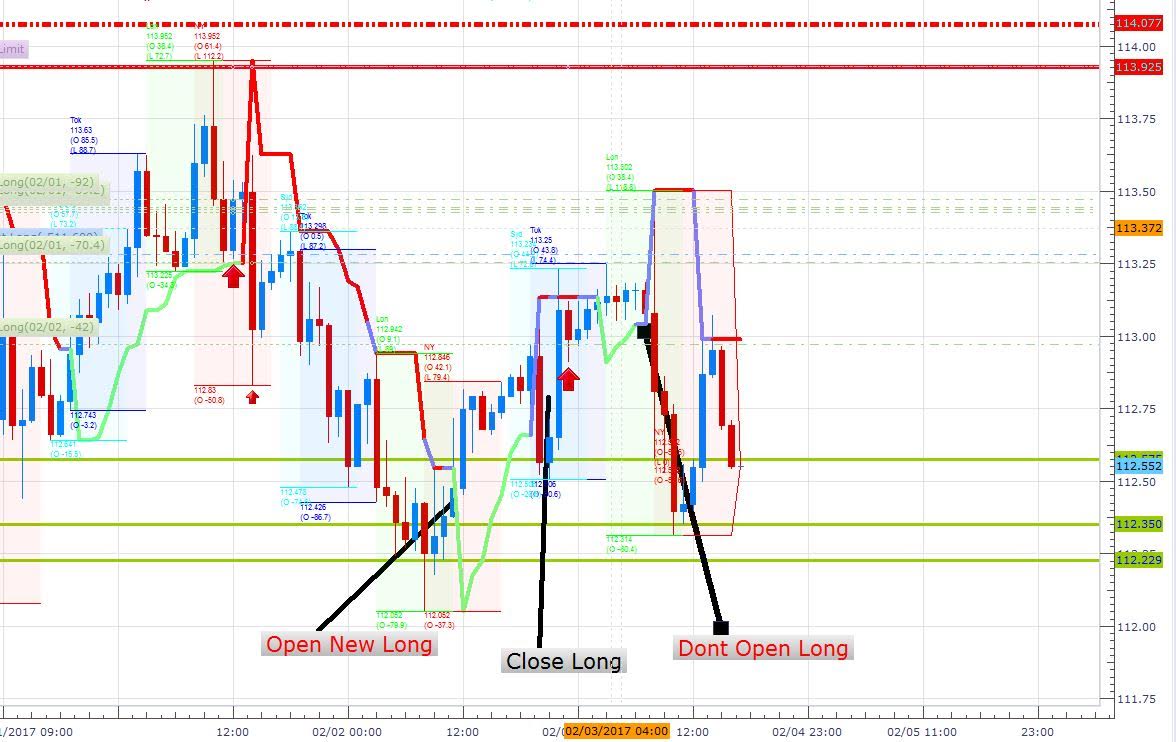
Criteria: only IF the price point is within the High +/- DPFHL, or Low +/- DPFHL, Trend Stop_Color can open a new position (Trend stop can always close the position at any point). Trendstop should not be able to open a new position if the price is outside of the High +/- DPFHL or Low +/- DPFHL
Example. Lets say that after establishing that the high and low in the option 2 above was 115.370 and 112.02, I set the DPFHL at 0.6. This means that anytime the TrendStop has an open position order within price range of 115.37 +/- 0.3 or 112.02 +/- 0.3, then it should act on that order. Otherwise it should not open the new position. So, in the example below, the EA opens a long position when the trend stop line crosses below at 112.40 and closes that position when it crosses above at 112.8, but does not open a new position again when the trendstop line crosses below at 113.2 or when it crosses above at 113.1 because those values are outside of the range defined above.
Additional variables to include options to allow opening the trades at any point in time or only during one or more of the following Trading Session (times are Eastern Standard Time):
NYT: 8:00 to 16:00
London: 3:00 to 11:00
Tokyo: 19:00 to 3:00
Sydney; 17:00 to 1:00
Add Variable to trigger new trade when bar crosses above (long position) or crosses below (short position) the Trendstop line or when the bar closes above or below the trendstop line.
Last thing to be added is with regards to the amount to be traded. Id like the EA to be able to break the dollar amount of the trades into multiple smaller orders, executed at X seconds from each other: (for example, if I am sending an order for 1 million, I'd like to be able to break down the orders by a factor of 10 (variable to be added) or 1 Lot per order, submitted to the broker within a second of each other. When closing the trades, all lots to be closed at the same time
Variable to be included: Trade size:
Trade broken down by a factor of:
Trades executed within how many seconds of one another:
input priceL = low;
input percentageReversal = 5.0;
input absoluteReversal = 0.0;
input atrLength = 5;
input atrReversal = 1.5;
Assert(percentageReversal >= 0, "'percentage reversal' must not be negative: " + percentageReversal);
Assert(absoluteReversal >= 0, "'absolute reversal' must not be negative: " + absoluteReversal);
Assert(atrReversal >= 0, "'atr reversal' must not be negative: " + atrReversal);
Assert(percentageReversal != 0 or absoluteReversal != 0 or atrReversal != 0, "Either 'percentage reversal' or 'absolute reversal' or 'atr reversal' must not be zero");
def hlPivot;
if (atrReversal != 0) {
hlPivot = percentageReversal / 100 + WildersAverage(TrueRange(high, close, low), atrLength) / close * atrReversal;
} else {
hlPivot = percentageReversal / 100;
}
def state = {default init, undefined, uptrend, downtrend};
def maxPriceH;
def minPriceL;
def newMax;
def newMin;
def prevMaxH = GetValue(maxPriceH, 1);
def prevMinL = GetValue(minPriceL, 1);
if GetValue(state, 1) == GetValue(state.init, 0) {
maxPriceH = priceH;
minPriceL = priceL;
newMax = yes;
newMin = yes;
state = state.undefined;
} else if GetValue(state, 1) == GetValue(state.undefined, 0) {
if priceH >= prevMaxH {
state = state.uptrend;
maxPriceH = priceH;
minPriceL = prevMinL;
newMax = yes;
newMin = no;
} else if priceL <= prevMinL {
state = state.downtrend;
maxPriceH = prevMaxH;
minPriceL = priceL;
newMax = no;
newMin = yes;
} else {
state = state.undefined;
maxPriceH = prevMaxH;
minPriceL = prevMinL;
newMax = no;
newMin = no;
}
} else if GetValue(state, 1) == GetValue(state.uptrend, 0) {
if priceL <= prevMaxH - prevMaxH * hlPivot - absoluteReversal {
state = state.downtrend;
maxPriceH = prevMaxH;
minPriceL = priceL;
newMax = no;
newMin = yes;
} else {
state = state.uptrend;
if (priceH >= prevMaxH) {
maxPriceH = priceH;
newMax = yes;
} else {
maxPriceH = prevMaxH;
newMax = no;
}
minPriceL = prevMinL;
newMin = no;
}
} else {
if priceH >= prevMinL + prevMinL * hlPivot + absoluteReversal {
state = state.uptrend;
maxPriceH = priceH;
minPriceL = prevMinL;
newMax = yes;
newMin = no;
} else {
state = state.downtrend;
maxPriceH = prevMaxH;
newMax = no;
if (priceL <= prevMinL) {
minPriceL = priceL;
newMin = yes;
} else {
minPriceL = prevMinL;
newMin = no;
}
}
}
def barNumber = BarNumber();
def barCount = HighestAll(If(IsNaN(priceH), 0, barNumber));
def newState = GetValue(state, 0) != GetValue(state, 1);
def offset = barCount - barNumber + 1;
def highPoint = state == state.uptrend and priceH == maxPriceH;
def lowPoint = state == state.downtrend and priceL == minPriceL;
def lastH;
if highPoint and offset > 1 {
lastH = fold iH = 1 to offset with tH = priceH while !IsNaN(tH) and !GetValue(newState, -iH) do if GetValue(newMax, -iH) or iH == offset - 1 and GetValue(priceH, -iH) == tH then Double.NaN else tH;
} else {
lastH = Double.NaN;
}
def lastL;
if lowPoint and offset > 1 {
lastL = fold iL = 1 to offset with tL = priceL while !IsNaN(tL) and !GetValue(newState, -iL) do if GetValue(newMin, -iL) or iL == offset - 1 and GetValue(priceL, -iL) == tL then Double.NaN else tL;
} else {
lastL = Double.NaN;
}
plot ZZ;
if barNumber == 1 {
ZZ = fold iF = 1 to offset with tP = Double.NaN while IsNaN(tP) do if GetValue(state, -iF) == GetValue(state.uptrend, 0) then priceL else if GetValue(state, -iF) == GetValue(state.downtrend, 0) then priceH else Double.NaN;
} else if barNumber == barCount {
ZZ = if highPoint or state == state.downtrend and priceL > minPriceL then priceH else if lowPoint or state == state.uptrend and priceH < maxPriceH then priceL else Double.NaN;
} else {
ZZ = if !IsNaN(lastH) then lastH else if !IsNaN(lastL) then lastL else Double.NaN;
}
ZZ.SetDefaultColor(GetColor(1));
ZZ.EnableApproximation();