仕事が完了した
指定
AMBER HEADSTONE EA
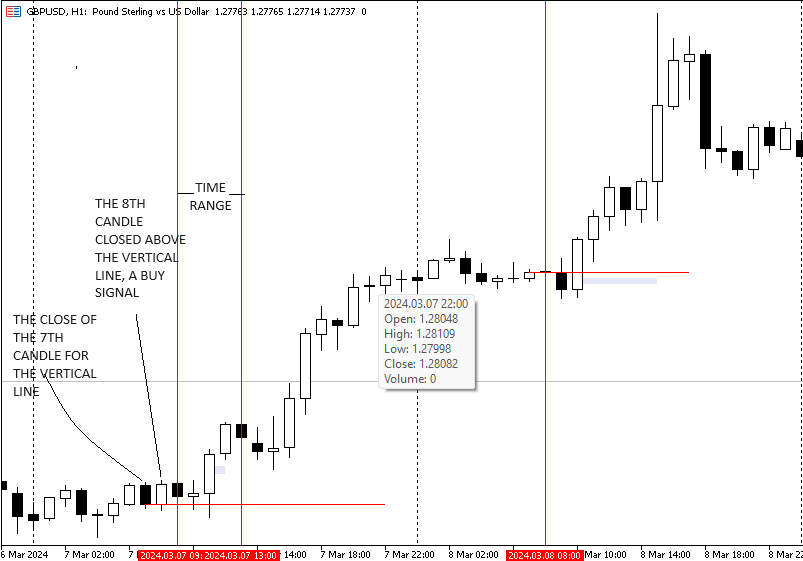
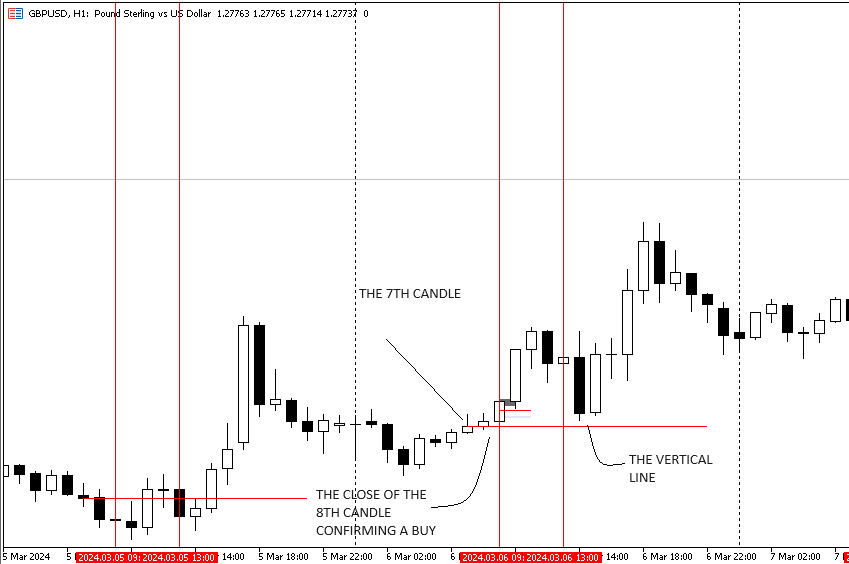
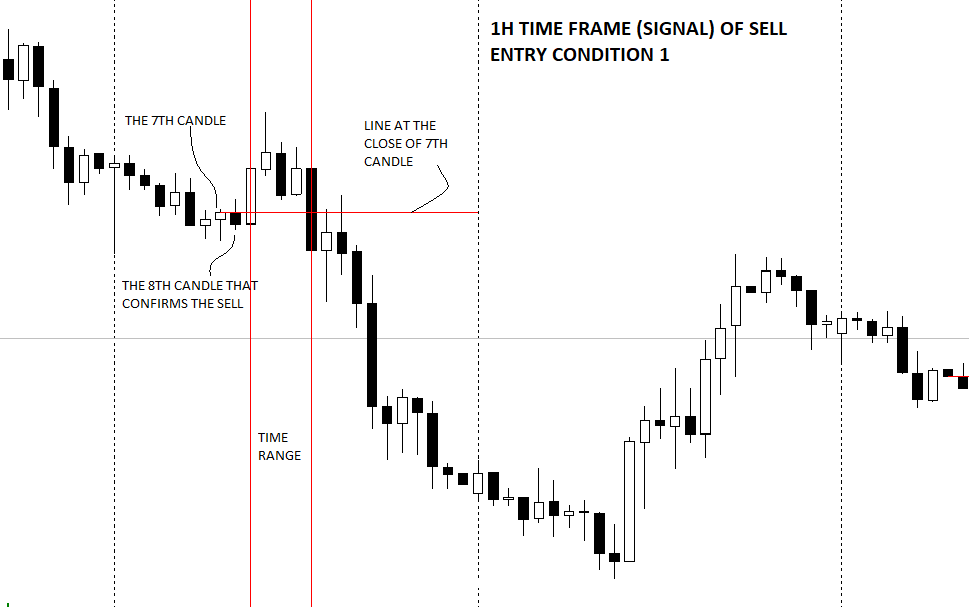
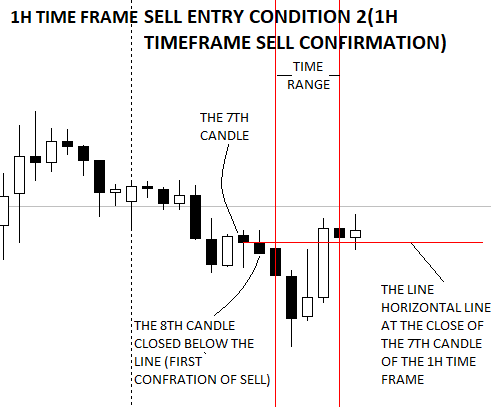
STEP ONE: On the 1H time frame draw a horizontal line at the end of the 7th candle after the period separator
STEP TWO: Wait for the close of the 8th either above or below the horizontal line. When the 8th candle of the 1H time frame closes above the horizontal line it is our first signal of buy while, when the 8th candle of the 1H time frame closes bellow the horizontal line it is our first signal of sell.
STEP THREE: have two vertical lines between 9:00 to 13:00 standard time of MT5 or the 9th to the 13th candle after the period seprator , this determines the time range of entry.
BUY ENTRY CONDITION 1: SEE ATTACHMENT DIGRAMS FOR THIS ENTRY CONDITION
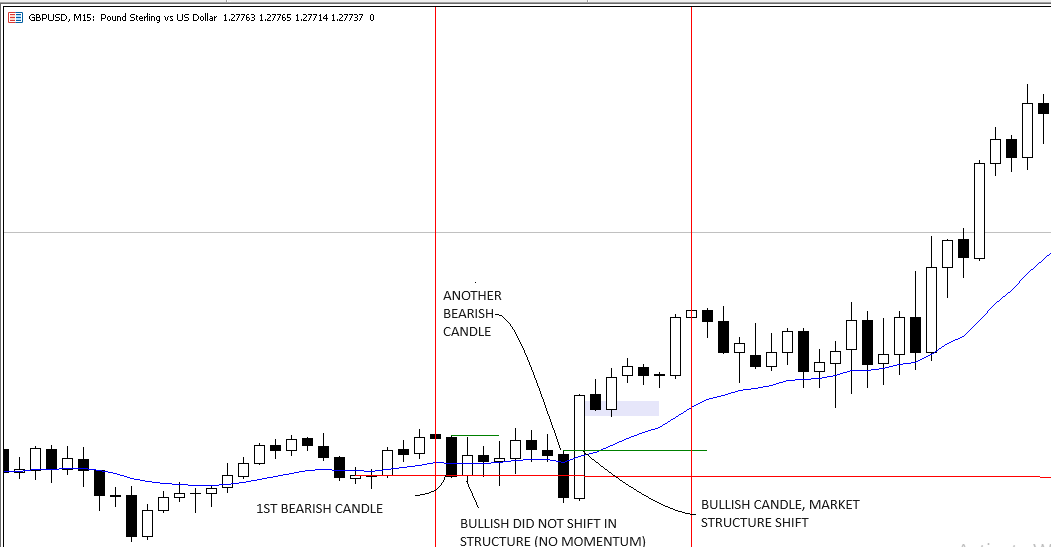
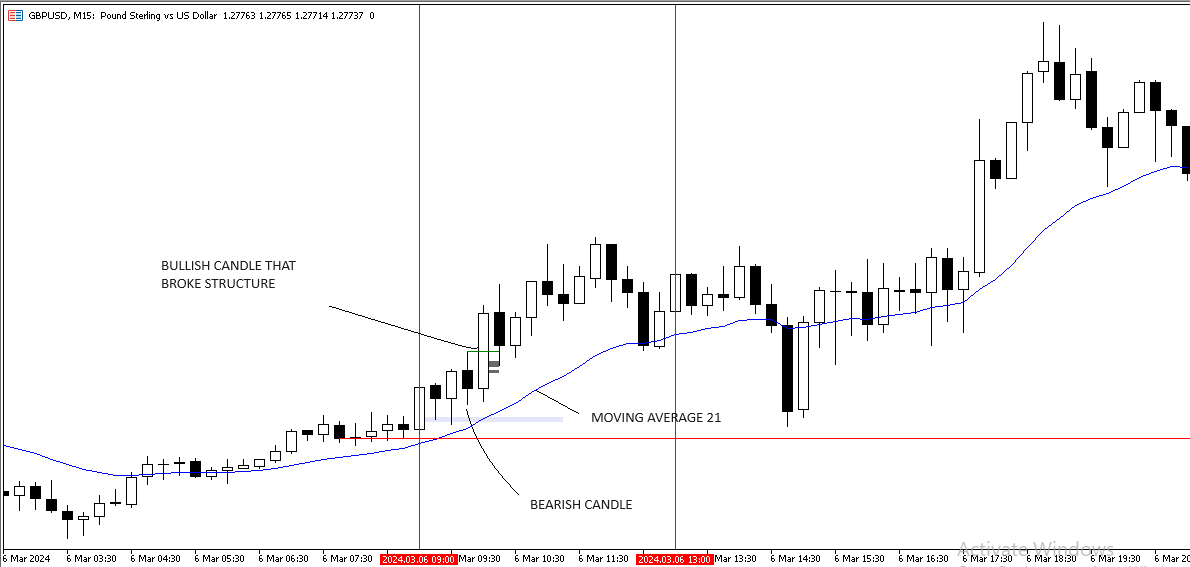
1. SIGNAL 1: We drop down to the 15 minute time frame and wait for a bearish candle(s) break to the downside of the horizontal line
2. SIGNAL 2: Once we have a bullish candle (see attachments for better illustration) is another signal to buy.
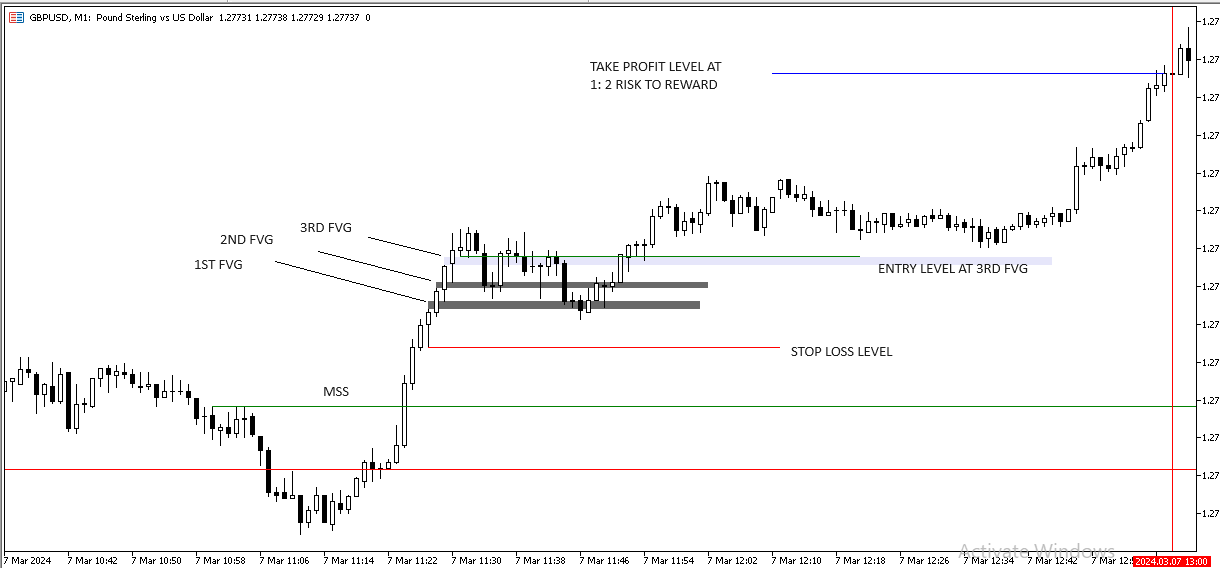
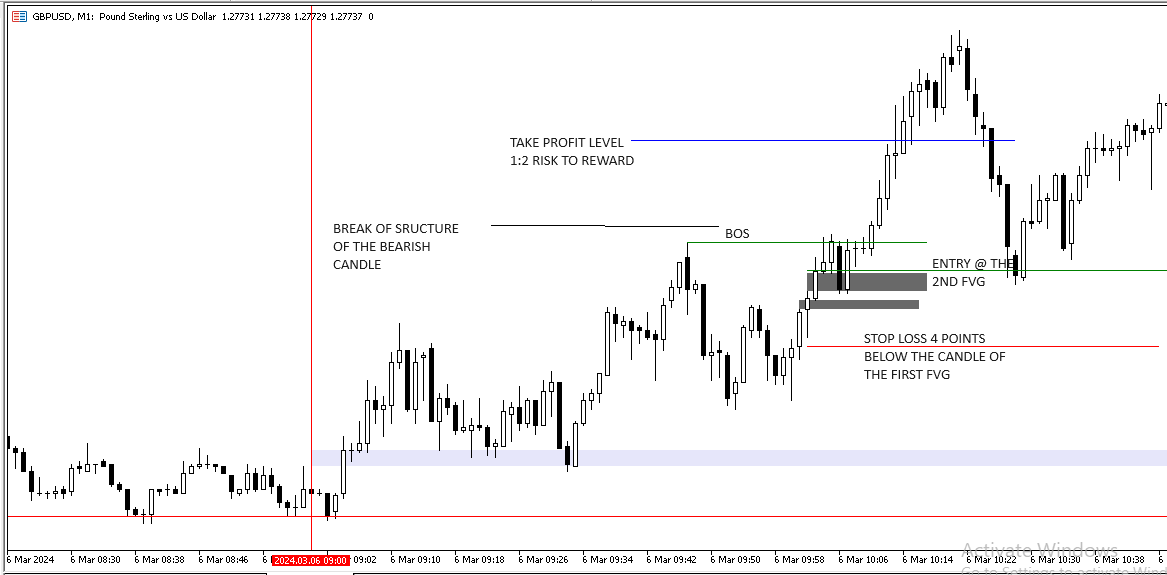
3. ENTRY: The next bullish candle move is where we BUY from, which is determined by dropping down to the 1 Minute time frame and either a retracement into an FVG formed before the bullish move or the FVG formed during the bullish movement.
NB: For the entry to be valid there must be a market structure shift (MSS) showing a change in direction to a buy (see attachment).
BUY ENTRY CONDITION 2: SEE ATTACHMENT DIGRAMS FOR THIS ENTRY CONDITION
1. SIGNAL 1: We drop down to the 15 minute time frame and wait for a bearish candle(s) and opposing bullish to bounce off the Exponential moving average 21 of the 15 minute timeframe. (This may wick bellow the horizontal line).
2. SIGNAL 2: Once we have these bullish candles forming (see attachments for better illustration) is another signal to buy.
3. ENTRY: BUY is determined by dropping down to the 1 Minute timeframe and either a retracement into an FVG formed before the bullish move or the FVG formed during the bullish movement. This move is so accurate from 10:00 move which may retrace into an FVG formed at 9:00.
NB: For the entry to be valid there must be a break of structure (BOS) of the low of the bearish showing a buy continuation (see attachment).
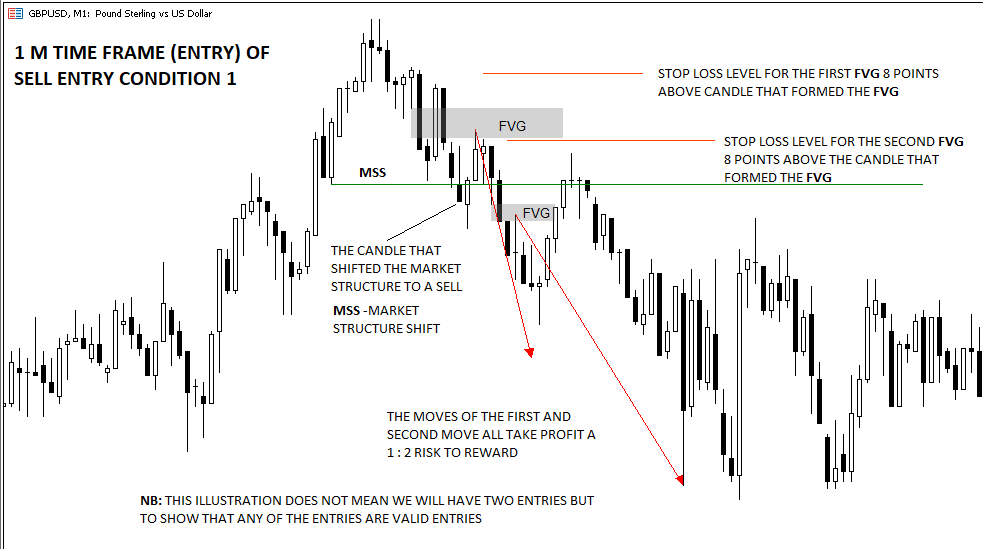
SELL ENTRY CONDITION 1: SEE ATTACHMENT DIGRAMS FOR THIS ENTRY CONDITION
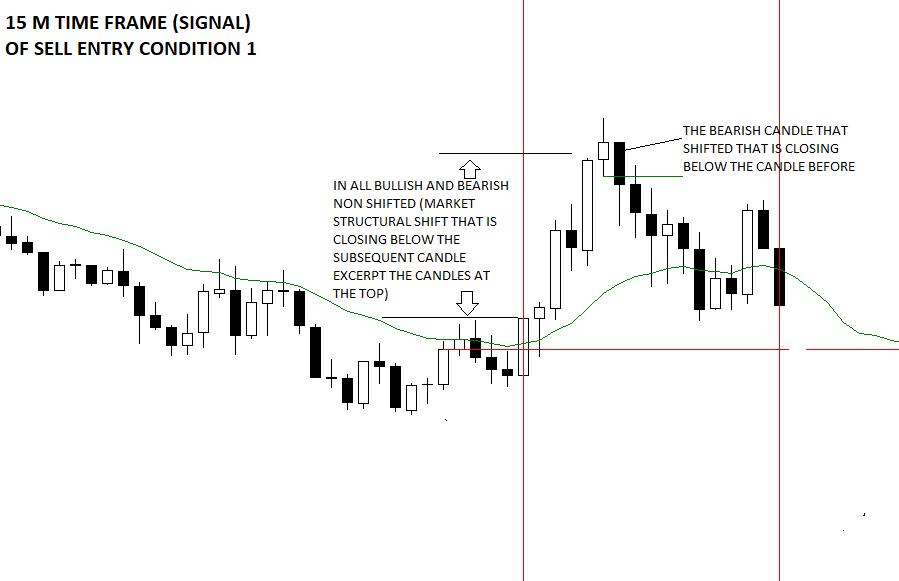
1. SIGNAL 1: We drop down to the 15 minute time frame and wait for either a bullish candle(s) break to the downside of the horizontal line.
2. SIGNAL 2: Once we have a bearish candle (see attachments for better illustration) is another signal to sell).
3. ENTRY: The next bearish candle move is where we SELL from, which is determined by dropping down to the 1 Minute time frame and either a retracement into an FVG formed before the bearish move or the FVG formed during the bearish movement.
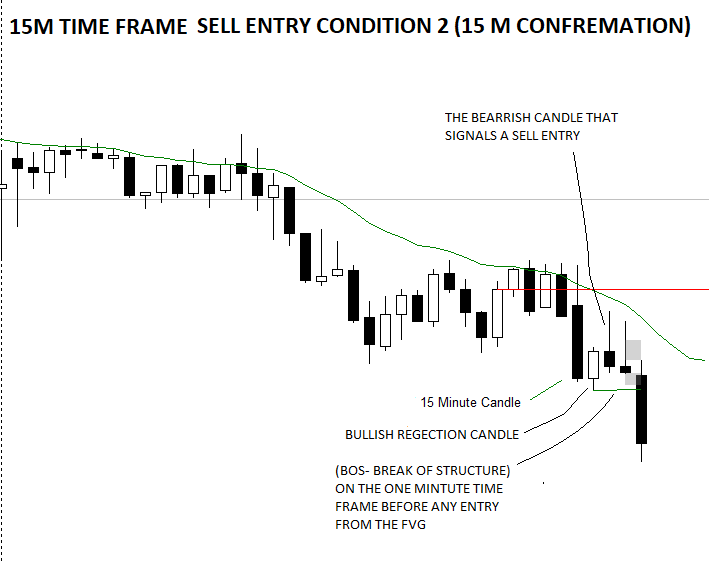
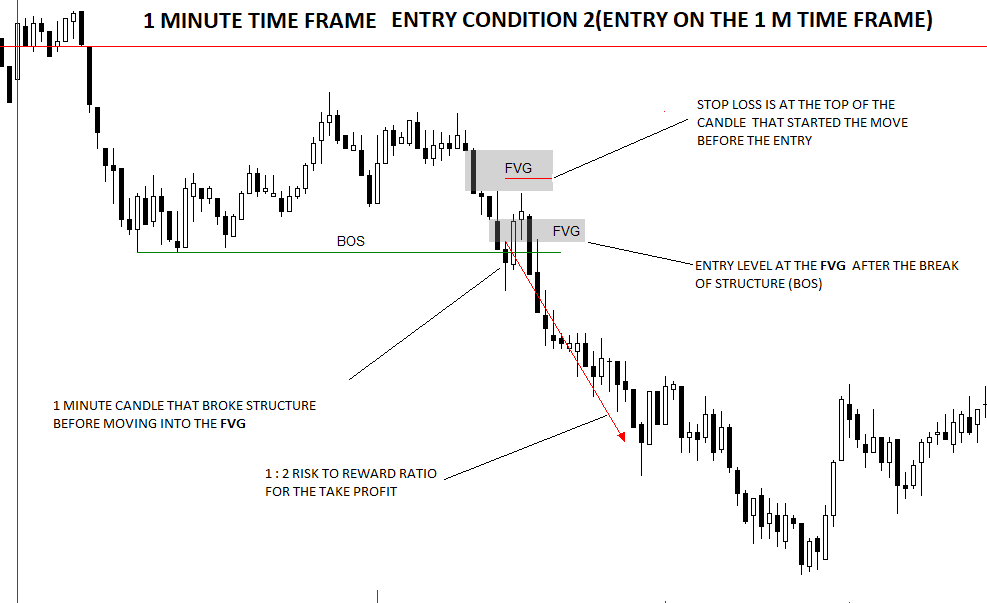
SELL ENTRY CONDITION 2: SEE ATTACHMENT DIGRAMS FOR THIS ENTRY CONDITION
1. SIGNAL 1: We drop down to the 15 minute time frame and wait for a bullish candle(s) and opposing bearish to bounce off or above the Exponential moving average 21 of the 15 minute timeframe. (This may wick above the horizontal line).
2. SIGNAL 2: Once we have these bearish candles forming (see attachments for better illustration) is another signal to sell.
3. ENTRY: SELL is determined by dropping down to the 1 Minute timeframe and either a retracement into an FVG formed before the bearish move or the FVG formed during the bearish movement. This move is so accurate from 10:00 move which may retrace into an FVG formed at 9:00.
NB: For the entry to be valid there must be a break of structure (BOS) of the low of the bullish showing a sell continuation (see attachment)
MANAGING OPEN POSITIONS:
1. All trade will target 1:2 risk to reward while risking 5% of the account balance. An 80% move in profit EA moves Stop loss to breakeven.
2. STOP LOSS FOR ENTRY CONDITION 1: The stop loss of the entry is at the low or high (8 points below or above) of the first candle that formed the FVG. (This applies if there only one FVG formed and price retraces into it). The stop loss of the entry at the second consecutive FVG will be slightly below (4 points below or above) the first candle that formed the first FVG, And the stop remains there for all the other retracement into any FVG
3. STOP LOSS FOR ENTRY CONDITION 1: remains the same as the stop loss condition stated above in entry condition 1.
FILTERS
1. Pair to trade GBPUSD
2. 150 points and above FVG are invalid.
3. Check diagrams for valid FVG(s)