I am looking for a developer that has some strong experience in developing indicators, since I'm hoping to have this project completed rather quickly. I am looking for this indicator to help me define when to open trades in my trading project. To save time, please provide a summary of your previous development work and history. If not, I will ask for that information and that will just take more time.
I REALLY appreciate the level of skill and expertise that exists here among the developers on MQL5.
I believe that the rules are rather simple, so the coding should be quite straight forward.
The source code is to be delivered at the completion of the project.
Thank you!
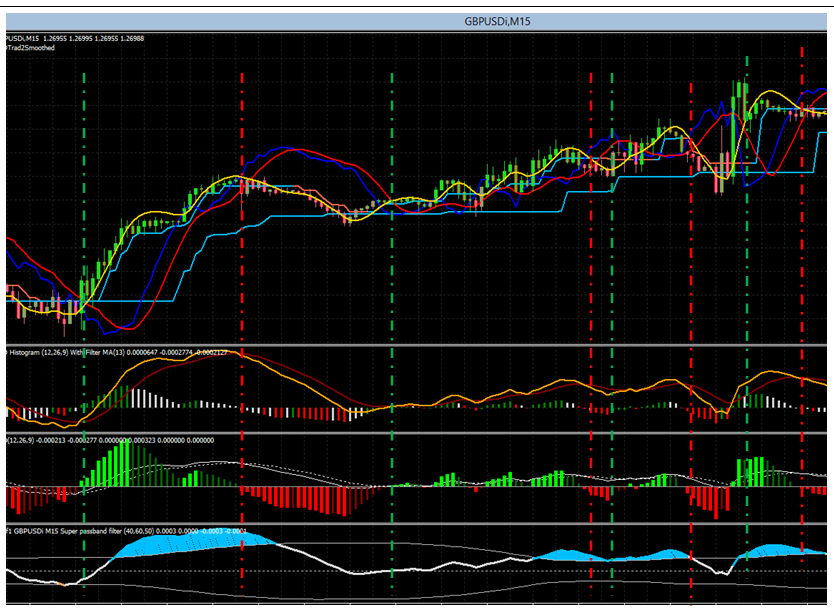
The definition of this indicator is as follows...
Rules for Trade Open Signals (BUY Example, SELL signals use the opposite rules)
1. MACD Trad2 Smoothed Blue Line is below the candle body at the close of the candle AND
2. OT3MA (yellow line) is UP AND
3. MACD Histogram Wis is above zero AND
4. Scrolling back to the first candle where the body of the candle is above MACD Trad2 Blue Line, there was no other BUY signal (This condition MIGHT be at the closed candle... but this rule just allows for MACD Histogram Wis to 'catch up' if it is behind in crossing above zero)
5. THEN display a LIME bar with a value of +1 in the new indicator window (SELL Signals are -1 and display a RED bar)
Rules for Trade Close Signals (BUY Example, SELL signals use the opposite rules)
1. The previous signal generated by this indicator was a BUY signal AND
2. The MACD Histogram Wis bar at the closed candle is lower than the same indicator at the previously closed candle AND
3. Super Passband Indicator is BLUE or WAS BLUE at its most recent high
4. THEN display a GREEN bar with a value of +1 in the new indicator window (SELL signals are -1 and display an ORANGE bar)
Secondary rules for Trade Close Signals (BUY Example, SELL signals use the opposite rules)
1. The previous signal generated by this indicator was a BUY signal AND
2. The MACD Histogram Wis bar at the closed candle is lower than the same indicator at the previously closed candle AND
3. MACD Histogram Wis bar at the previously closed candle was a minimum of (Minimum Close MACD Size) AND
4. Super Passband Indicator is DOWN
5. THEN display a GREEN bar with a value of +1 in the new indicator window (SELL signals are -1 and display an ORANGE bar)
類似した注文
Hello, Hope you are doing well. I need urgent help with a project, and if done successfully, there will be long-term work available. Requirements: Accurate POC Calculation: Identify the POC (Point of Control) as the price level with the highest traded volume within a selected session or time range. Allow users to select volume source: trade volume, tick count, or bid/ask volume. Correct Value Area Calculation (68%)
Very important note \ You must provide a working prototype that can be tested for 3 days before choosing you as a developer or giving you the project to ensure that you fully understand the terms of work (so that no type of disagreement occurs) \ It does not redraw itself \ It hangs on the M1 time frame \ Its signals appear exactly with the beginning of the candle (not late)
Hello to all, I'm looking for a coder that has a great attention to details and is able to code me and EA that works on anytime frame chart.. For example H4 chart, currencies, indices, stocks, or commodities using a fast MA (e.g. 20) crossing a slow MA (e.g. 120) as its core signal, with optional confirmation filters (RSI levels and H4 candle breakouts). It must be fully configurable with MA periods, ATR settings
I need a modification of the standard Donchian indicator that is already included in the MT5 terminal (I can provide you with the source code; alternatively it can be found in the Data Folder at MQL5\Indicators\Free Indicators). I want it to draw a cross and a box (a horizontal line and a vertical line at the point of candle close, as well as a box around the crossing point [see image "Example 1" attached]; thickness
I have a purchased MT4 custom indicator (Rapid Trend.ex4) located in the Market folder: MQL4 > Indicators > Market > Rapid Trend.ex4 I want to create a new custom indicator ( iCustomRapidTrend.ex4 ) that: Uses the original Rapid Trend indicator via iCustom with path input: Market\\Rapid Trend.ex4 Adjusts the width and size of the lines and arrows (Green/Red lines: width 2; Up-arrow Blue and Down-arrow Magenta: size
Hi coders, Please i need an indicator created from different indicators and if it's fine, i wil appreciate, will really appreciate. Please i need only professional programmers. If you are very good, will select you immediately
LOT SIZE WITH MULTIPLIER WHEN INITIAL TRADE ENTERED WHEN PARABOLIC REVERSES IT SHOULD NOT CLOSE OPEN ENTRY AND DO HEDGING AS FOLLOWS: PARABOLIC BUY MOVING AVERAGE BUY OPEN TRADE BUY 0.01 WHEN PARABOLIC REVERSE AGAIN ENTER SAME LOT & HEDGE THE POSITION 0.01 SELL WHEN AGAIN PARABOLIC BUY ENTER IF MULTIPLIER IS 2 THEN 0.02 BUY AGAIN PARABOLIC SELL 0.02 AS SO ON.. AS BELOW EXAMPLE.. First Buy: 0.01 Reverse → Sell: 0.01
Hello, I wanted to modify a Zig Zag indicator and make it better. The zig zag indicator is basically running on percentage reverse rather than pipe amount. For example: a signal appears when the market has reached a certain percentage. This is creating many false signals especially when its slow or fast movement. It also misses a lot of highs and lows. I believe the solution is to remove the percentage function
Project Name: Automatic Trend Channel and Bounce Detection Indicator Platform: TradingView (Pine Script v6) or lastest version Project Description: I want an indicator that automatically detects trend channels and bounce signals without manual drawing. It must: Identify swing highs and swing lows using pivot logic (for example, 5 candles left and 5 candles right), Draw a dynamic channel based on these swing points
Dashboard panel for indicator + Fiboanacci + Bullish candle + Bearish candle + Candle highier high + Candle highier low + Candle Lower high + Candle Lower low + Strong signal candle + PO3 + Session + examples