仕事が完了した
指定
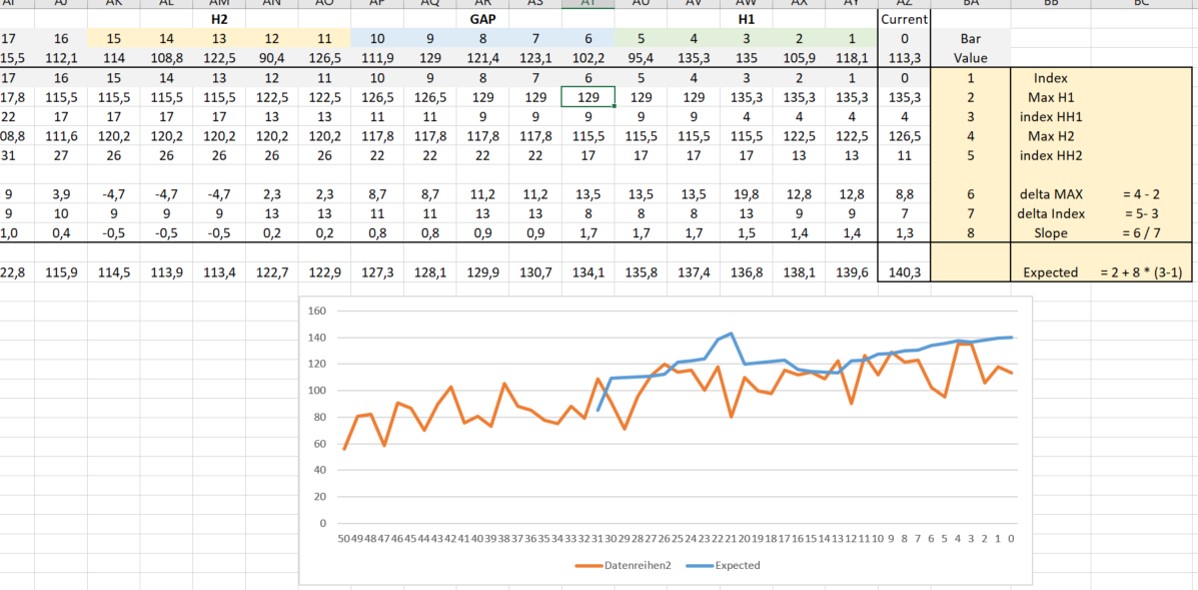
I am looking for an MQL5 indicator that is calculating the maximum expected value for a bar and gives a signal if current high is > expected.
Deliverables:
1. Source code, clean and well commented
2. Good optimization for fastest performance
Inputs:
Period H1 number of bars to the left of the current bar (for example H1 = 5; last 1 to 5 bars)
Perod Gap number of bars between Period H1 and Period H2 (for example Gap = 5; last 6 to 10 bars)
Period H2 number of bars in the second period considerd for the calculation of the highest high (for example H2 = 5; last 11 to 15 bars)
The expected max of current bar is calculated by
- adding to the Highest High of Period H1
- the average change (slope) between the Highest High of Period H2 and Period H1
- times the number of bars between current bar and bar of Highest High
Expected = MaxValue of Period H1 * Slope * (bar of Highest High in H1 - current bar)
Slope = DeltaHH / DeltaBars with
DeltaHH = Value of Highest High in Period H2 - Value of Highest High in Period H1
DeltaBars = Barnumber of HighestHigh in Period H2 - Barnumber of HighestHigh in Period H1
See picture for an example.
Signal (Green Arrow Up) if current high > expected value of respective bar