スピーディに自動売買ロボットを注文する方法を見る
注文を投稿するまたは受注する前にルールをご覧ください。
MQL5およびMQL4で自動売買ロボットを注文する方法
ロボットを注文するにはサンプル要件仕様をご覧ください
カテゴリでの新規注文:
30+ USD
300 - 700 USD
40 - 80 USD
60 - 100 USD
500+ USD
30 - 50 USD
30 - 100 USD
仕事が完了した
実行時間38 日
指定
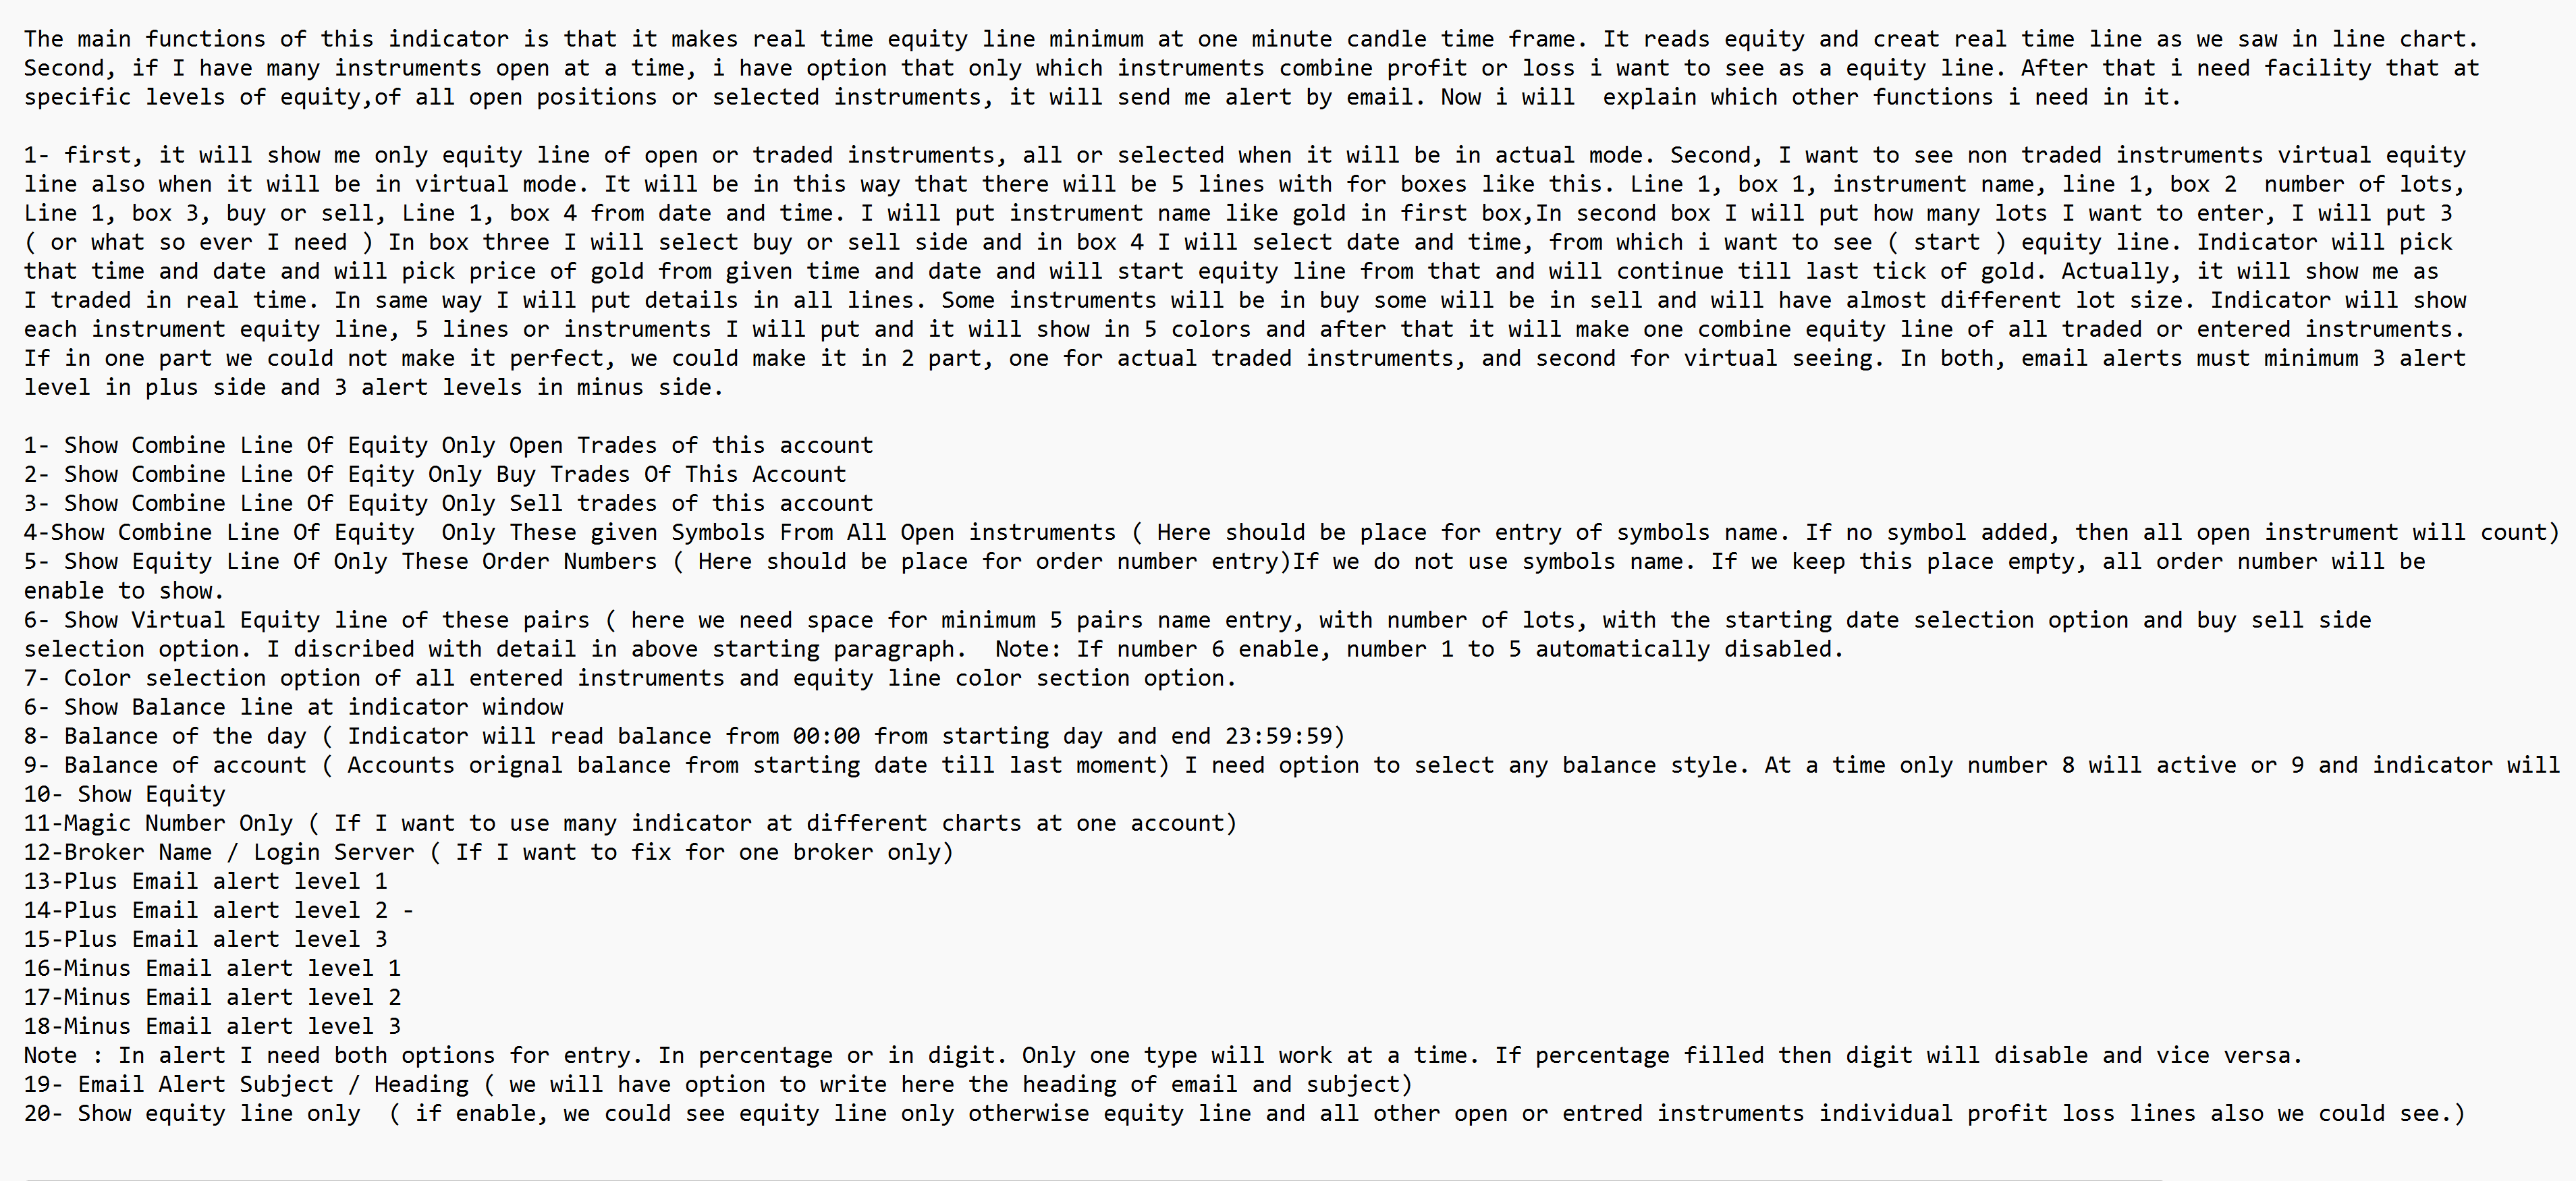
The main functions of this indicator is that it makes real time equity line minimum at one minute candle time frame. It reads equity and creat real time line as we saw in line chart.
Second, if I have many instruments open at a time, i have option that only which instruments combine profit or loss i want to see as a equity line. After that i need facility that at
specific levels of equity, of all open positions or selected instruments, it will send me alert by email. Now i will explain which other functions i need in it.
1- first, it will show me only equity line of open or traded instruments, all or selected when it will be in actual mode. Second, I want to see non traded instruments virtual equity
line also when it will be in virtual mode. It will be in this way that there will be 5 lines with for boxes like this. Line 1, box 1, instrument name, line 1, box 2 number of lots,
Line 1, box 3, buy or sell, Line 1, box 4 from date and time. I will put instrument name like gold in first box,In second box I will put how many lots I want to enter, I will put 3
( or what so ever I need ) In box three I will select buy or sell side and in box 4 I will select date and time, from which i want to see ( start ) equity line. Indicator will pick
that time and date and will pick price of gold from given time and date and will start equity line from that and will continue till last tick of gold. Actually, it will show me as
I traded in real time. In same way I will put details in all lines. Some instruments will be in buy some will be in sell and will have almost different lot size. Indicator will show
each instrument equity line, 5 lines or instruments I will put and it will show in 5 colors and after that it will make one combine equity line of all traded or entered instruments.
If in one part we could not make it perfect, we could make it in 2 part, one for actual traded instruments, and second for virtual seeing. In both, email alerts must minimum 3 alert
level in plus side and 3 alert levels in minus side.
1- Show Combine Line Of Equity Only Open Trades of this account
2- Show Combine Line Of Equity Only Buy Trades Of This Account
3- Show Combine Line Of Equity Only Sell trades of this account
4-Show Combine Line Of Equity Only These given Symbols From All Open instruments ( Here should be place for entry of symbols name. If no symbol added, then all open instrument will count)
5- Show Equity Line Of Only These Order Numbers ( Here should be place for order number entry)If we do not use symbols name. If we keep this place empty, all order number will be
enable to show.
6- Show Virtual Equity line of these pairs ( here we need space for minimum 5 pairs name entry, with number of lots, with the starting date selection option and buy sell side
selection option. I described with detail in above starting paragraph. Note: If number 6 enable, number 1 to 5 automatically disabled.
7- Color selection option of all entered instruments and equity line color section option.
6- Show Balance line at indicator window
8- Balance of the day ( Indicator will read balance from 00:00 from starting day and end 23:59:59)
9- Balance of account ( Accounts original balance from starting date till last moment) I need option to select any balance style. At a time only number 8 will active or 9 and indicator will follow the active balance type.
10- Show Equity
11-Magic Number Only ( If I want to use many indicator at different charts at one account)
12-Broker Name / Login Server ( If I want to fix for one broker only)
13-Plus Email alert level 1
14-Plus Email alert level 2 -
15-Plus Email alert level 3
16-Minus Email alert level 1
17-Minus Email alert level 2
18-Minus Email alert level 3
Note : In alert I need both options for entry. In percentage or in digit. Only one type will work at a time. If percentage filled then digit will disable and vice versa.
19- Email Alert Subject / Heading ( we will have option to write here the heading of email and subject)
20- Show equity line only ( if enable, we could see equity line only otherwise equity line and all other open or entred instruments individual profit loss lines also we could see.)
応答済み
1
評価
プロジェクト
475
40%
仲裁
83
36%
/
33%
期限切れ
13
3%
仕事中
2
評価
プロジェクト
73
47%
仲裁
2
50%
/
50%
期限切れ
2
3%
暇
3
評価
プロジェクト
205
80%
仲裁
18
33%
/
44%
期限切れ
10
5%
仕事中
4
評価
プロジェクト
359
71%
仲裁
4
100%
/
0%
期限切れ
0
取り込み中
類似した注文
Indicator development
30+ USD
Hello I'm trying to fix a indicator that I have, It's a .ex4 file, Can I just code a new indicator because I only have a failed version of it in a ex4 file. Here are the three files. They are EX4 files. So i wanted to have a trade panel that can fill up the whole screen where it shows all the pair symbols. MTF_TMA_Harmonic ex4 file is exactly what I'm looking for however the ex4 file for some reason doesn't work
Develop indicator for MT5
30+ USD
I have a machine learning library in MT5 that I want to make an indicator with… You think you can help me? My strategy is simple... Predicting the Daily, Weekly, and Monthly High, Low, and Close prices... Then BUY @ LOW and SELL @ HIGH
My EA places orders when an arrow appears according to the pz day-trading indicator. 1) I need to change the indicator, so that it places orders when the stock indicator arrow appears. All other EA conditions remain the same. 2) I need it to place orders when the candle turns colored according to the Pvsar indicator. The only change is that for pvsra I need a buy order to be placed above the high of the candle that
I want to fix the indicator
30+ USD
Hello there, I'm trying to fix a indicator that I have, It's a .ex4 file, Can I just code a new indicator because I only have a failed version of it in a ex4 file. Here are the three files. They are EX4 files. So i wanted to have a trade panel that can fill up the whole screen where it shows all the pair symbols. MTF_TMA_Harmonic ex4 file is exactly what I'm looking for however the ex4 file for some reason doesn't
Hello I'm trying to fix a indicator that I have, It's a .ex4 file or Can I just code a new indicator because I only have a failed version of it in a ex4 file. Here are the three files. They are EX4 files. So i wanted to have a trade panel that can fill up the whole screen where it shows all the pair symbols. MTF_TMA_Harmonic ex4 file is exactly what I'm looking for however the ex4 file for some reason doesn't work
Rewrite the short code
30 - 31 USD
Hi everyone I have a question, is there anyone who can rewrite the code from tradinvivew pineditor to mql5 meta trader? It is about 150 line. My strategy has 50% success rate with RR 2,6. Tested for last one year, strategy works only in bull market. This is trading on gold, unfortunately I am not in the best financial position, in return I would send you the code, if you don't like it I understand that you will stop
Editing of strategy
30 - 60 USD
I have a strategy that i would like edited. I have a strategy where right now it takes profit at the next high or low. That can be removed if necessary. The SL is set using the current RSI Band Gap. I'd like the same to be done for the TP. You'll see in the settings that I have a SL and TP buffer. I would also like for those to be kept the same but again I just want the TP to be the RSI Band Gap. It'll make more
Need to modify indicator
30+ USD
need a professional developer to modify my current indicator. Need to add time frame parameter with true .false option. Which i set true show only those TF signal and when all signal match with the current TF ( to enter trade). Alert get generated. Price is non negotiable .please don't respond if you don't agree to price. Thank you
Create a bos and choch scanner indicator
30 - 50 USD
create a scanner for find bos and choch indicator on the chart, I want the indicator based on line charts rather than candlesticks .the indicator can scanner all symbols and all timefimes when i want. Create a panel that displays symbols, time and indicates whether it is bos or choch. the scanner can alert to my phone terminal. If you are interested please contact me
EA to trade daily time based range and pound average entries with partial close management.
50 - 300 USD
I'm looking for a skilled developer who can produce an indicator and trading bot for the following specification: Input parameters Parameter Data type Range start time Time Range end time Time Range buffer Number pips Range colour Colour EMA Cross EMA 1 EMA 2 Period 50 200 Days to include Mon Tue Wed Thur Fri Tick box to select Entry on close TF Time Frame 5, 10, 15, 30 Mins 1hr, 4hr Max time to enter Time
プロジェクト情報
予算
100 - 200 USD
開発者用
90
- 180
USD
締め切り
最低 3 最高 7 日