スピーディに自動売買ロボットを注文する方法を見る
注文を投稿するまたは受注する前にルールをご覧ください。
MQL5およびMQL4で自動売買ロボットを注文する方法
ロボットを注文するにはサンプル要件仕様をご覧ください
カテゴリでの新規注文:
100 - 400 USD
250+ USD
35+ USD
30+ USD
30 - 80 USD
30 - 300 USD
仕事が完了した
実行時間31 日
指定
- EA has 2 types of Grid working together: Grid is losing and Grid is making profit.
- Grid LOSS can open the BUY/SELL entry at the same time (can open the Sell entry when there is a Grid Buy and vice versa).
- Grid PROFIT can open BUY/SELL entry at the same time (can open BUY entry while Grid Sell is available and vice versa).
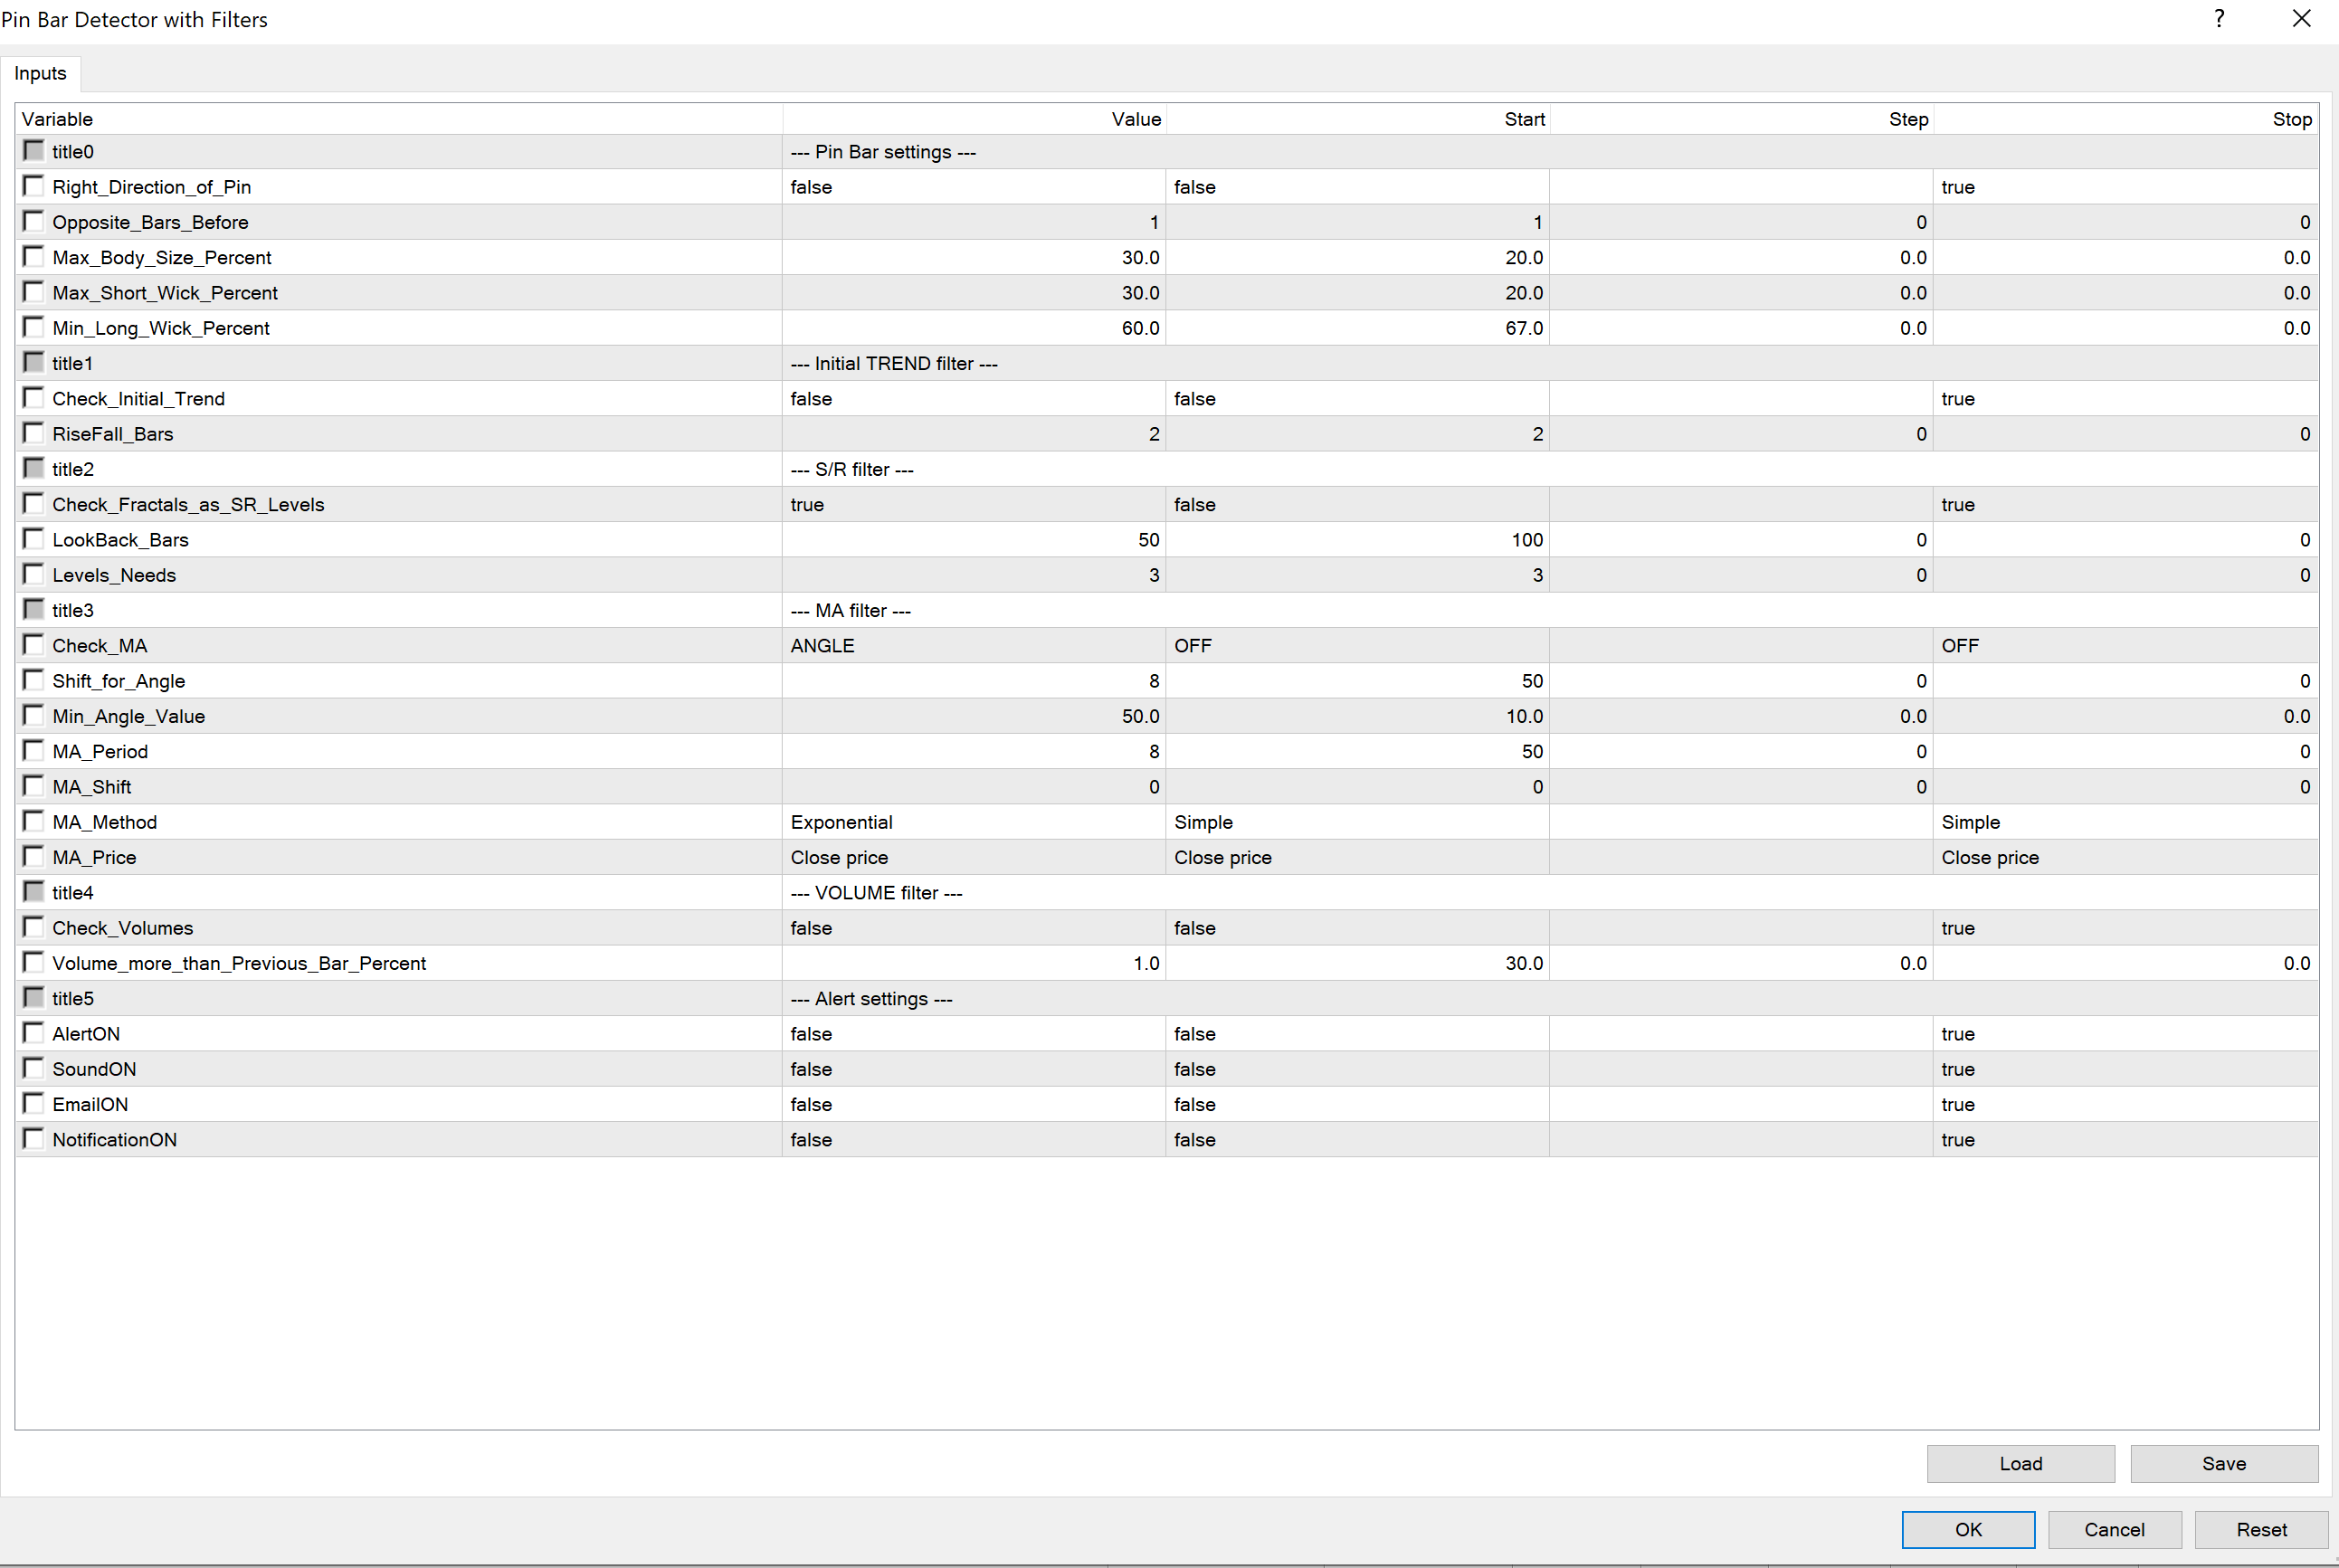
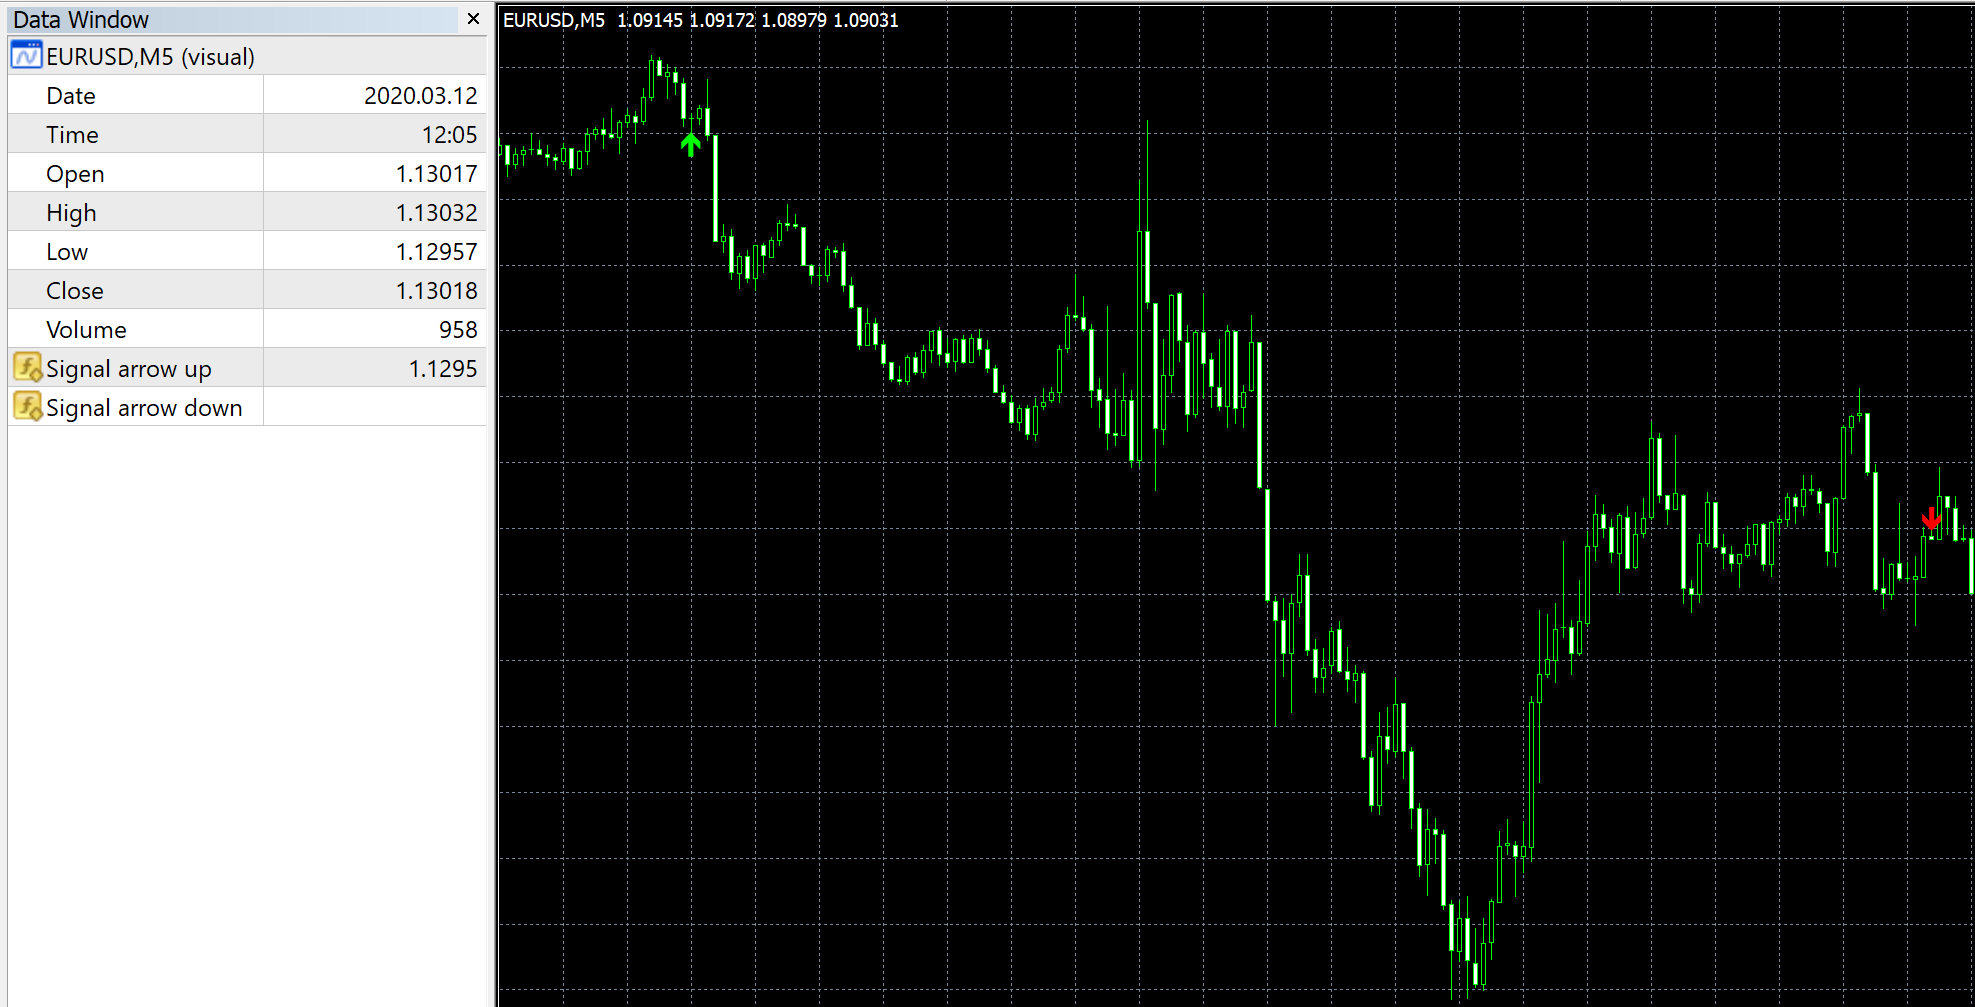
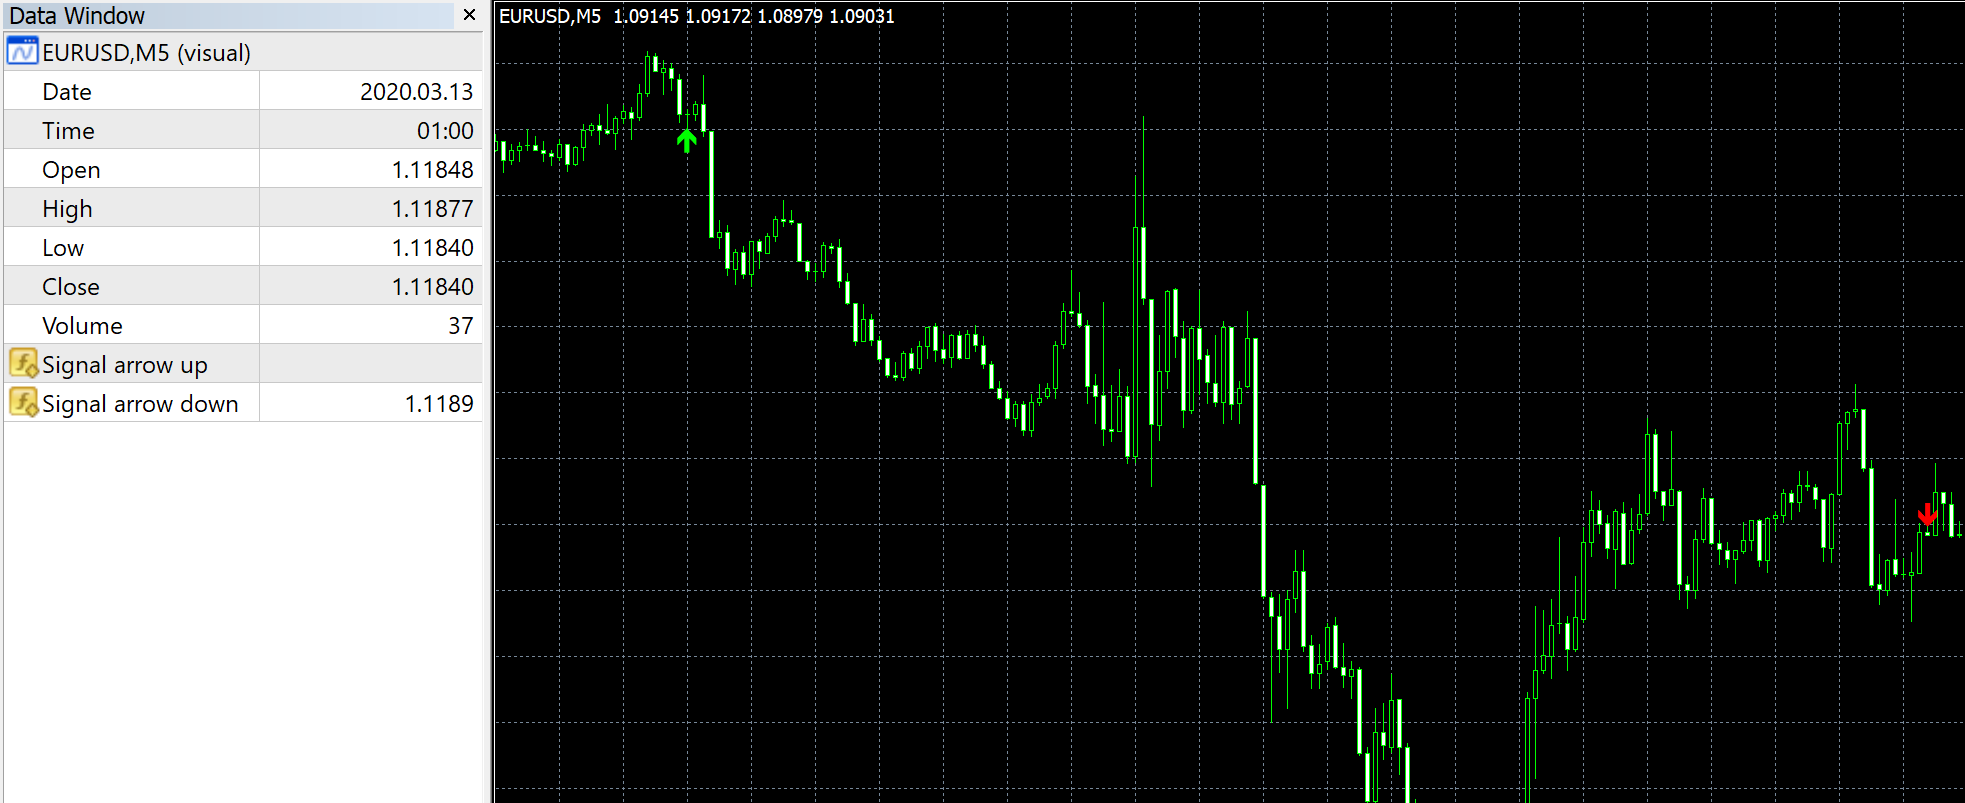
- Grid only opens trades according to icustom Arrow Buy Sell Signal signal of "Pin Bar Detector with Filters" indicator AND TrendFilter MA AND TrendFilter RSI.
- The next open levels of Grid must open according to the icustom Arrow Buy Sell Signal signal of the indicator "Pin Bar Detector with Filters" AND TrendFilter MA AND TrendFilter RSI.
- Level Grid does not open at a fixed distance, only opens according to the signal of icustom Arrow Buy Sell Signal of the indicator "Pin Bar Detector with Filters" AND TrendFilter MA AND TrendFilter RSI.
- Reference Grid same: https://www.mql5.com/en/market/product/24061
- Link Indicator Pin Bar Detector with Filters: https://www.mql5.com/en/market/product/20193
A. INITIAL TRADE SETTING:
- Trade Direction: 3 Options
+ Both Side (Buy and Sell) (Buy Sell at the same time)
+ Only Buy
+ Only Sell
- Order Price Type: 3 Option
+ Market
+ Limit
+ Stop
- Max Spread: 31
- Fix lots size (Start lots size): 0.01
B. GRID LOTS SETTING:
- Lot Type: 3 Option
+ Multiple Lots
+ Add Lots
+ Fix Lots
Input for Option Lot Type:
- - Multiple Lots (for Grid): 1.5
- - Add Lots (for Grid): 0.01
- - Fix Lots (for Grid): 0.01
C. GRID SETTING: 2 GRID SIDE - GRID PROFIT & GRID LOSS (EACH GRID CAN OPEN BUY SELL AT SAME TIME)
C.1 ** GRID SETTING (FOR LOSS SIDE)
C.1.1. [BUY DIRECTION] IN LOSS SIDE:
- [BUY] Active Loss Side Grid: On/Off
- [BUY] Max Level Grid: 100 levels
- [BUY] Minimum distance between Level Grid: 230 points
C.1.2. [SELL DIRECTION] IN LOSS SIDE:
- [SELL] Active Loss Side Grid: On/Off
- [SELL] Max Level Grid: 100 levels
- [SELL] Minimum distance between Level Grid: 230 points
C.1.3. [PROFIT & LOSS] IN GRID LOSS SIDE: (Stoploss and Take Profit for 1 side Grid Loss Side)
- Take Profit: 400 points
- Trailing Stop for LOSS SIDE: Average Grid Loss Side positions
(When LOSS SIDE is profitable, will trailing in Step 10 pips)
+ Trailing On: True/False
+ Trailing Start: 400 points
+ Trailing Step: 20 points
- Stoploss: 400 points
C.2 ** GRID SETTING (FOR PROFIT SIDE)
C.2.1. [BUY DIRECTION] IN PROFIT SIDE:
- [BUY] Active Profit Side Grid: On/Off
- [BUY] Max Level Grid: 100 levels
- [BUY] Minimum distance between Level Grid: 230 points
C.2.2. [SELL DIRECTION] IN PROFIT SIDE:
- [SELL] Active Profit Side Grid: On/Off
- [SELL] Max Level Grid: 100 levels
- [SELL] Minimum distance between Level Grid: 230 points
C.2.3. [PROFIT & LOSS] IN GRID PROFIT SIDE: (Stoploss and Take Profit for 1 side Grid Profit Side)
- Take Profit: 400 points
- Trailing Stop for PROFIT SIDE: Average of Grid Profit Side positions
(When PROFIT SIDE is profitable, will trail by Step 10 pips)
+ Trailing On: True/False
+ Trailing Start: 400 points
+ Trailing Step: 20 points
- Stoploss: 400 points
D. SETTING CUSTOM INDICATOR:
Conditions for considering Entry Order execution: Using AND điều condition
(Entry Indicator AND Trendfilter MA(If ON) AND Trendfilter RSI (If ON))
D.1. Icustom Entry Indicator:
- Parameters of indicator "Pin Bar Detector with Filters"
D.2. Trend filter MA: Option True/False
The MA Fast signal above the Slow MA is Uptrend.
The Slow MA signal above the Fast MA is Downtrend.
- MA Fast:
+ MA Fast TimeFrame: Option All TimeFrame
+ Period MA Fast: 8
+ MA Fast Price Type: Close Price/Open Price/High Price/Low Price
+ MA Fast Method: Simple/Exponential/Smoothed/Linear Weighted
+ MA Fast Shift: 1
- MA Slow:
+ MA Slow TimeFrame: Option All TimeFrame
+ Period MA Slow: 50
+ MA Slow Price Type: Close Price/Open Price/High Price/Low Price
+ MA Slow Method: Simple/Exponential/Smoothed/Linear Weighted
+ MA Slow Shift: 1
D.3. Trend filter RSI: Option True/False
If the RSI is above 60, the trend is up.
If the RSI is below 40, the trend is down.
- RSI Timeframe: Option All TimeFrame
- RSI Period: 14
- RSI Price Type: Close Price/Open Price/High Price/Low Price
- RSI Shift: 1
E. EA BASIC CONFIGURATION:
- Magic Number: 09091986
- EA Commnet: GridBuySell
- Max All Trade Limit: 200
I NEED SOURCE CODE WHEN I COMPLETE JOB
応答済み
1
評価
プロジェクト
88
14%
仲裁
30
30%
/
57%
期限切れ
36
41%
仕事中
2
評価
プロジェクト
72
49%
仲裁
4
0%
/
50%
期限切れ
19
26%
暇
3
評価
プロジェクト
35
54%
仲裁
8
63%
/
38%
期限切れ
1
3%
暇
4
評価
プロジェクト
132
50%
仲裁
5
80%
/
0%
期限切れ
6
5%
暇
5
評価
プロジェクト
407
70%
仲裁
3
100%
/
0%
期限切れ
2
0%
取り込み中
6
評価
プロジェクト
2
0%
仲裁
1
0%
/
100%
期限切れ
0
暇
7
評価
プロジェクト
0
0%
仲裁
0
期限切れ
0
暇
8
評価
プロジェクト
1
100%
仲裁
1
0%
/
0%
期限切れ
0
暇
9
評価
プロジェクト
439
34%
仲裁
56
36%
/
38%
期限切れ
161
37%
取り込み中
10
評価
プロジェクト
422
38%
仲裁
86
44%
/
19%
期限切れ
70
17%
多忙
11
評価
プロジェクト
0
0%
仲裁
0
期限切れ
0
暇
12
評価
プロジェクト
24
17%
仲裁
15
20%
/
40%
期限切れ
6
25%
暇
類似した注文
Hello! I am looking for an experienced Pine Script coder to create a custom indicator for mapping market structure based on fractals. The developer must be skilled in Pine Script and have a solid understanding of how to code market structure indicators. Looking forward to working with a talented developer
Mobile bot plug and play
250+ USD
CHAPTER 1: BASICS 1.THE BASICS 1.1. EXPANSION AND RETRACEMENT Expansion =>occurs when there is an impulse movement towards a direction. Retracement => is the correction movement after an impulse movement. 1.2. FIBBONACCI RETRACEMENT USED TO DETERMINE THE END OF THE RETRACTION MOVEMENT, USUALLY THE PRICE RETRACTS TO 50% OR UNTIL OTE (0.62, 0.705, 0.79) BEFORE ANOTHER IMPULSE MOVEMENT OCCURS. 1.3. BMS - BREAK IN MARKET
I want a program that automatically disables manual trade execution once a specified number of trades have already been placed. ie. After a total of 3 trades have been placed on that day, manual trade execution should be disabled. I want the program to also limit the amount of lots that can be traded in any given day. ie. Maximum of 15 standard lots in any given day. The program should disable manual trade execution
Greetings to all developers that see this post, I have a task, I would like to work with an expert. I have an indicator that is written in the Pine script (TradingView) language; I would like it converted to MQL5, which will then lead to the creation of a trading bot based on the circumstances. I'll give you access to the indicator file
Hi , i want a indicator that shows the trades history on the chart, just for current day, like : first trade : -54 Second trade : -52 Third trade : +126 , and after three trades, display "No more trades"
I am looking for a highly sample and ready and tested profitable EA to purchase.if it meets my requirements i will order same one.EA must be low drawdown high profit on any timeframe
AngelShark system
30+ USD
Hello i need someone who can convert a trading view indicator into an mt5 indicator that can work smoothly also need to add an alert on the indicator i will require to test the indicator run it for 1-2days to confirm all is okay thank you
SMC trading bot debugging and adding features
30 - 300 USD
i have a ready made SMC EA and looking for optimizing and debugging and also adding back the missing things in the requirement file. Basically work with the current code and refine it to fit the requirement file. Most indicator is already in the EA and the requirement file below are mostly finish. here are the things need to add back and debug based on the requirement file 1. TP from the filter and need to check
Hello. I would like to get a TOS script converted to Tradingview for my alerts. I’m haven’t a hard time getting my entry point because the script does not fire off alerts on thinkorswim. I will send the script so you can see if it’s possible
Here's a clearer step-by-step guide to checking the last 50 candles on your chart and applying Fibonacci retracement levels based on their colors: Identify Candle Color: Start from the 100th candle from the left on the chart and check its color. If the 100th candle is green (i.e., the close is higher than the open): Draw a Fibonacci Retracement: From the highest price to the lowest price of this candle. Check the
プロジェクト情報
予算
30 - 150 USD
開発者用
27
- 135
USD
締め切り
最低 1 最高 10 日