スピーディに自動売買ロボットを注文する方法を見る
注文を投稿するまたは受注する前にルールをご覧ください。
MQL5およびMQL4で自動売買ロボットを注文する方法
ロボットを注文するにはサンプル要件仕様をご覧ください
カテゴリでの新規注文:
30+ USD
30 - 500 USD
30+ USD
40 - 80 USD
指定
Hi guys,
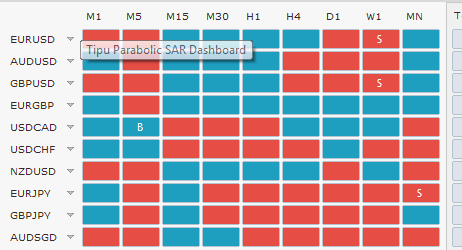
i need a multiframe dashboard of MT4 which showss buy and sell signal with respect to condition mentioned below.
BUY - RSI above mentioned value + CCI above mentioned value + WPR above mentioned value + Price above PSAR ( 0.02/0.2 ) + Price above PSAR ( 0.01/0.1 )
SELL - RSI below mentioned value + CCI below mentioned value + WPR below mentioned value + Price below PSAR ( 0.02/0.2 ) + Price below PSAR ( 0.01/0.1 )
Output dashboard should be like pic attached
応答済み
1
評価
プロジェクト
96
40%
仲裁
13
38%
/
62%
期限切れ
25
26%
暇
2
評価
プロジェクト
246
45%
仲裁
42
10%
/
57%
期限切れ
5
2%
暇
3
評価
プロジェクト
204
30%
仲裁
25
40%
/
44%
期限切れ
12
6%
暇
4
評価
プロジェクト
258
35%
仲裁
12
25%
/
58%
期限切れ
42
16%
暇
5
評価
プロジェクト
1054
40%
仲裁
47
49%
/
23%
期限切れ
84
8%
暇
6
評価
プロジェクト
181
24%
仲裁
23
22%
/
39%
期限切れ
13
7%
暇
7
評価
プロジェクト
23
39%
仲裁
26
8%
/
38%
期限切れ
0
暇
8
評価
プロジェクト
414
69%
仲裁
4
75%
/
0%
期限切れ
2
0%
取り込み中
9
評価
プロジェクト
506
40%
仲裁
147
18%
/
72%
期限切れ
99
20%
多忙
10
評価
プロジェクト
542
50%
仲裁
55
40%
/
36%
期限切れ
225
42%
仕事中
11
評価
プロジェクト
1782
61%
仲裁
14
64%
/
7%
期限切れ
84
5%
暇
12
評価
プロジェクト
395
28%
仲裁
155
20%
/
52%
期限切れ
112
28%
暇
13
評価
プロジェクト
133
35%
仲裁
13
38%
/
31%
期限切れ
32
24%
暇
14
評価
プロジェクト
446
34%
仲裁
56
36%
/
38%
期限切れ
164
37%
取り込み中
15
評価
プロジェクト
13
15%
仲裁
6
17%
/
33%
期限切れ
1
8%
暇
16
評価
プロジェクト
0
0%
仲裁
0
期限切れ
0
暇
17
評価
プロジェクト
35
54%
仲裁
8
63%
/
38%
期限切れ
1
3%
暇
18
評価
プロジェクト
933
47%
仲裁
302
59%
/
25%
期限切れ
125
13%
取り込み中
19
評価
プロジェクト
2
0%
仲裁
1
0%
/
100%
期限切れ
0
暇
20
評価
プロジェクト
143
34%
仲裁
10
10%
/
60%
期限切れ
26
18%
暇
類似した注文
Master Pattern Indicator
30+ USD
Hello, I need a master pattern indicator. It is important that the lines of the indicator are generated for each candlestick, as there are also master pattern indicators where this is not the case. In the link is an example of a TradingView indicator, how the lines should be. It is also important that the lines are a buffer and I also need the source code. Here is the link
MT5 Indicator which Highlights HTF Wicks
30 - 50 USD
MT5 Indicator which Highlights Wicks Hi. I require an indicator which highlights the Wicks of a selected Time frame. So that even if I go to another time frame, the selected Time frame Wicks remain highlighted. For example If I select 'Weekly wicks' to be displayed, then if I got to a 4 hour chart, the Weekly wick area should remain highlighted. The Time Frame selections I want are: Monthly Wicks Weekly Wicks Daily
I need someone to code NinjaTrader 8 indicator
50 - 80 USD
Here’s a comprehensive specification document in English for developing your NinjaTrader bid/ask imbalance indicator: --- ### Bid/Ask Imbalance Indicator for NinjaTrader: Full Specifications #### **Objective**The goal is to develop a custom bid/ask imbalance indicator for NinjaTrader 8. The indicator will calculate and visualize bid/ask imbalances in real-time and on historical tick data using Tick Replay. It will
Convert tradingview indicator into tradelocker ea
80 - 100 USD
I would to develop a trading bot with some confluences I use TradeLocker Settings must be adjustable…… I am based in uk and very keen to move my strategy to trade automatically 1. Market Structure Break And Order block. By EmreKb 2. Rainbow Adaptive RSI By LuxAlgo 3. Multiple Moving Average using only 1 indicator By Myfye13 4. Average True Range Trailing Stops By HPotter we have to combine this four indicator into a
Preciso de um orçamento. Conversão de estratégias do TradingView para uso em MQL5. Todas são estratégias abertas, porém, não consigo contato com o desenvolvedor. 🔑 Principais recursos: - 🛠 Configurações personalizáveis do PSAR: ajuste o ponto inicial, o incremento e os valores máximos do PSAR para adaptar o indicador à sua estratégia. - 📏 Padronização: suavize a volatilidade padronizando os valores do PSAR
I am looking for an experienced MQL5 developer to build a custom indicator that displays retail stop-loss (SL) clusters on the chart. This indicator should integrate with an external data feed (preferably free, though I’m open to a paid solution if necessary) to show the order book of retail traders, highlighting where stop-losses are likely positioned. The goal is to use this information for entry and take-profit
Hello, i would like to have a fix on my plotted lines I use a liquidity strategy on the 1 hr time frame but the indicator that i am using for plotting the 1 hr lines is having a issue and printing the plot lines all over the place on the current 1 and 4 hr plot line as you can see in the screenshot this is very disturbing while i am trading can u fix that or just remove the current 1 hr plot line ?and or only show
Just need script for trading view.
30 - 40 USD
I’m looking to turn into code. Trading Instrument - Crude Oil Futures (CL) Chart and Timeframe - 30-second chart Entry Setup 1. Time Focus on the first 30-second candle after 11:00:00 AM New York time. (11:00:00 candle) 2. Candle Size Limit : Skip the trade if the first candle is greater than 10 points. 3. Entry Orders - Place stop orders at the high and low of the first 30-second candle after 11:00:00. - Long Entry
Variable Inputs to be added Order Type : Market , Pending Trade Type : Buy, Sell , Buy & Sell Pending Pips Step : ( Pips Value can be negative or positive to decide on what type of Pending Order ) // If trade type Buy is selected Close Type : Close All ( Bulk Close Option in MT5 ) , Close Individually Close Option : %of Equity , %of Balance , Amount $ , %of No: of Trades Close Type : Buy Only , Sell Only , Buy & Sell
Conversão indicador MQL4 para MQL5
30 - 200 USD
Olá! Tenho 4 arquivos que gostaria que fossem modificados para uso no mt5 1.color-fisher-m11 - Seria criar 1 buffer para cada cor de barra do histograma e fazer com que o cálculo fique o mais próximo da versão do mt4. 2.Caso a opção 1 não seja possível, Realizar o port/conversão do arquivo "FISHER SMOOTHING MT4" para ser usado no mt5 de maneira que ele possua apenas dois buffers e o cálculo seja exatamente igual ao
プロジェクト情報
予算
30+ USD
開発者用
27
USD
締め切り
最低 3 最高 5 日