仕事が完了した
指定
Hello Everyone,
I am currently interested in Programmers to help me build up my logic into an EA. The logic is based on the robot identifying data from the marketing and updating them as soon as possible. Every period of the Month, Week or Day, the market will have 2 positions. HIGH PRICE and LOW PRICE.
I want the HIGH price to predict and take actions for a SELL BIDS and a LOW price to predict a BUY BIDS
I have a template that has different computations which i created on Excel sheet. It calculates 2 key positions that will help in determining what actions to take.
i will show you some pictures and explain the actions and what i want to create
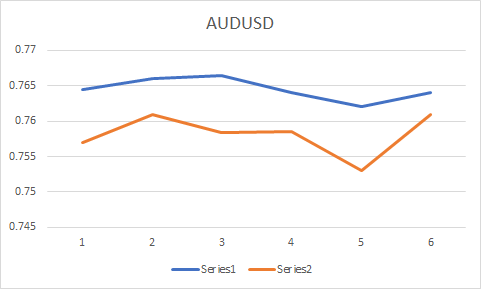
Series 1 shows daily High prices, Series 2 shows daily low prices
Robot starts with the start price, and identify market movements to know which bids to take and when to backup.
so according to the above picture, i want to know when to BUY and SELL and Take profit as well
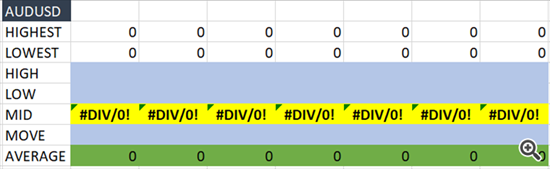
so using the above positions, i have created additional data input. But the only information i need is the above 2 positions to populate the others
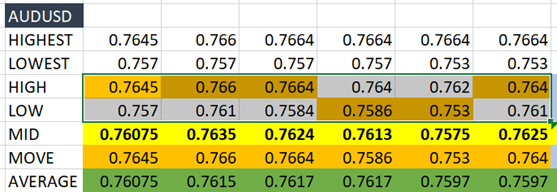
A plain template is below
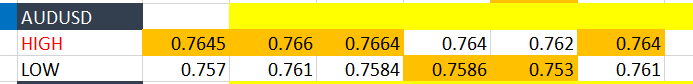
so it only needs the Daily High and Low data, and the daily high and low will be used to determine the Move data.
Move data is based on a condition as follows. If my previous day move is HIGH, then todays actual price HIGH, must be Higher than yesterday High to make today HIGH MOVE, else today will be LOW move
so thats why i colour the moves on the HIGH and LOW data at the top, which is now the move for the period. so i am going to copy that now to the template and makes other computations itself
The Highest will be based on the highest value to date of all datas from inception, and same to Lowest price as well from inception
Mid is the middle of daily high and low, so todays actions in the Morning will be based on Yesterdays data, while by 5 hours to the trading Day, the data will be updated to use the data for the day till the end of the day
Average is the middle of the Historical Highest and the Historical lowest from start to date
so the MID and AVERAGE are same thing but only uses different datas. Mid uses daily data only, while average uses historical data This is the daily data as shown above, just that i added daily gap here, which is the difference between the daily High and Lowe prices.
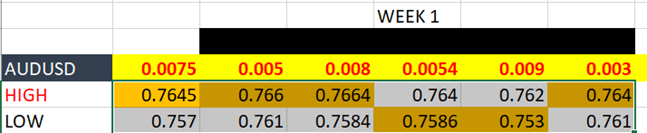
so you can see that i coloured the trend based on the market moves as specified above. started with high, then next price must be higher to make the day high, else it will be low. When low, then next move should be lower to make it low, else it reverses back to HIGH
I only copied the daily high and low, and then updated the moves using the coloured value of the daily high and low. and all other computations are computed
So to make it easier, let me now explain the whole data using pictures. The Move is now the REAL PRICE MOVEMENTS. so we project ahead of the MOVE. we use Monday update to plan ahead for Tuesday, we use Tuesday to plan for wednesday etc, We can also use 9Am Tuesday data to plan for next 1 hour, or use the first 4 hours to plan for next 4 hours etc. so we always plan ahead of the market with the data we have
UPDATE ON DAY 1 cos first data is previous period information.
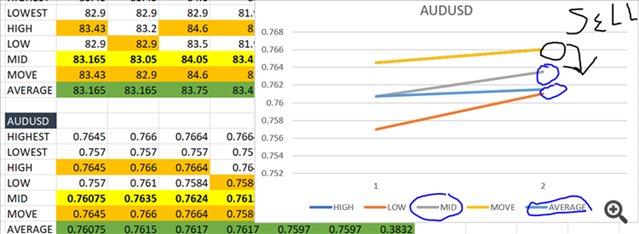
Because High and Move is same price, so thats why we only have 4 lines. So the rule is that the Move will always cut across the mid price at all times every period the prices changes over time. so thats why when the actual price is at the top of the mid, it will plan to SELL downwards and BUY when the price is below the mid and plans to go upwards
Hope you get the explanation to this point of the logic
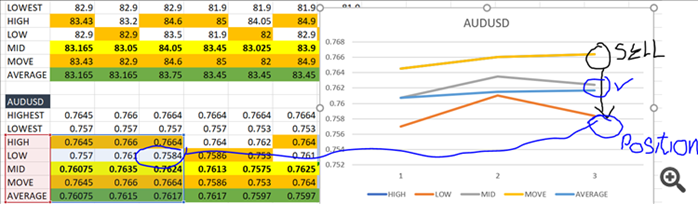
AT NEXT MOVE THE SELL WILL ACTIVATE DOWNWARDS FROM PRICES ABOVE TO THE PRICES OF EITHER OR BOTH MID AND AVERAGE. IT WILL ALWAYS CROSS THE MID PRICE EVEN IF IT DOESNT REACH THE AVERAGE PRICE.

STAGE 3. PRICE IS NOW AT LOW SIDE AFTER CROSSING BOTH MID AND AVERAGE PRICES. SO WE CONSIDER BUYING NOW ESPECIALLY UNTIL PRICE GOES ABOVE MID PRICE.

ALSO NOTE THAT OUR CURRENT LOW -L2 OF .7586 IS NOT UP TO OR BELOW FIRST LOW L1- .757. SO THE ROBOT WILL BE READY TO BUY. IT WILL ONLY CCHANGE TO SELL WHEN PRICE REACHES .757 AND GOES DOWNWARDS.
SO BASED ON NEW MOVE, PRICE FELL BELOW L1 TO .753. SO .753 BECOMES OUR NEW LOW. HOWEVER WHEN PRICE REVERTS BACK ABOVE OLD LOW OF .7586, WE WILL CONTINUE TO BUY UPWARDS UNTIL IT ROSSES THE MIDPOINT AND THEN WE STOP BUYING AND START TO SELL ABOVE IT.
AND FINALLY THE LAST MOVE RESULT.
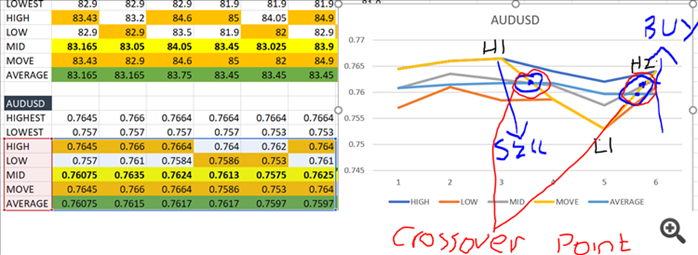 SO AT CROSSOVER POINT, IT STOPS SELLING WHEN PRICE IS FALLING FROM H1, AND IT STOPS BUYING WHEN PRICE GOES FROM L1 UPWARDS.
so from the above analysis, you can see that with just the daily high and low prices, the other data of the reports were generated and the robot will be taking actions based on the data as well as closing bids automatically in profits. also note that at every side of the MID or average points, new bids will increase from old ones after certain gaps are achieved. so for example if first SELL is .763 at .01, next SELL will be at .765 at .02, next SELL will be .767 at .03 or .04 etc depending on level of increases. Once the market falls below the updated MID prices, it can close the SELL bids and then start Buying using same logic
I have the excel template that is already formatted which may assist in coding the formulars needed for the positions.
NB:
Please only serious and immediately available programmers should bid.
I will test the robot for 15 working days minimum after submission of robot before concluding on the project
I will also need additional time after conclusion of the project to test among various products to perfect the robot in case of any anomalies not initially noticed in the 15 working days testing.
Will also get the source code to the Robot
Robot should be with password setting
Thanks