指定
I want a software that works with trading reports from METATRADER 4 and 5.
Once that the report is uploaded, the code must show the lowest and highest point from each input until the gains and losses of each operation; this must appear in a graphic and on the traders report spreadsheet from METATRADER.
EXAMPLE: when the input is consider a “sale” and is going toward the opposite direction (up, 200 points) and has reached the goal of 500 points (positive during the sale). The graphic must show the highest point of 200 points and the lowest of 500 points as a profit, just as if there is a minimum less than 500 points, the code should plot this information on a graphic and export it to an excel spreadsheet.
EXAMPLE 2:
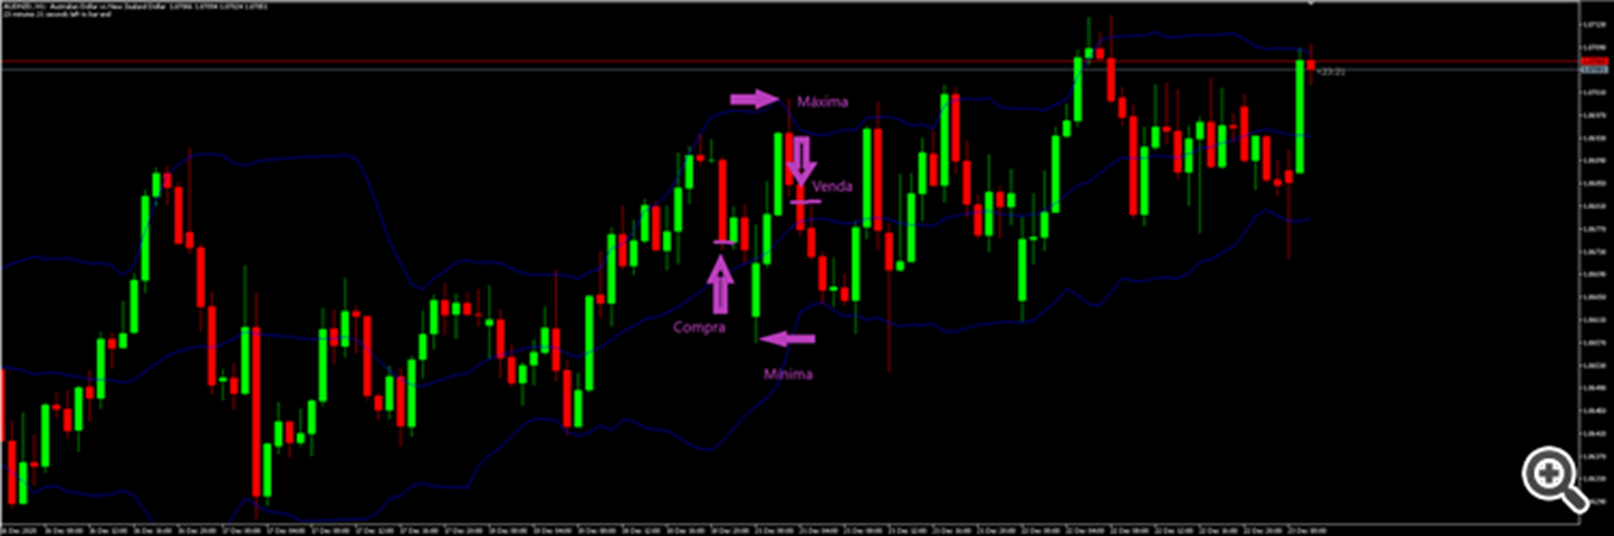
Note that the points of maximum and minimum of this particular operation are different from the values of input (purchase) and output (sale).
Therefore, in the end, we should have:
1) An excel spreadsheet with the values of maximum, minimum, profit or loss of every operation. Note that the value of profit and loss may not be the points of maximum amplitude, since there might higher values before closure.
2) A graphic plotted with the values of maximum, minimum, profit or loss. Again, observe the amplitude issue before the operation closure.
3) The software should work on a single input or many. It must use the information of an trader excel spreadsheet report from the METATRADER itself, even if it contains a single operation, as well as many.
The code must import a excel file saved in a specific folder, with a specific name, both to be chosen at an appropriate time.
It must work on any operable assets of METATRADER 4 and 5.
It also should be an open source software in order for me to perform any future alterations that I see fit.
A simple code where the exported reports from METATRADER will be uploaded and plotted in a graphic.