Hi there,
I have a TradingView indicator that would like to convert into a trading robot for MT5.
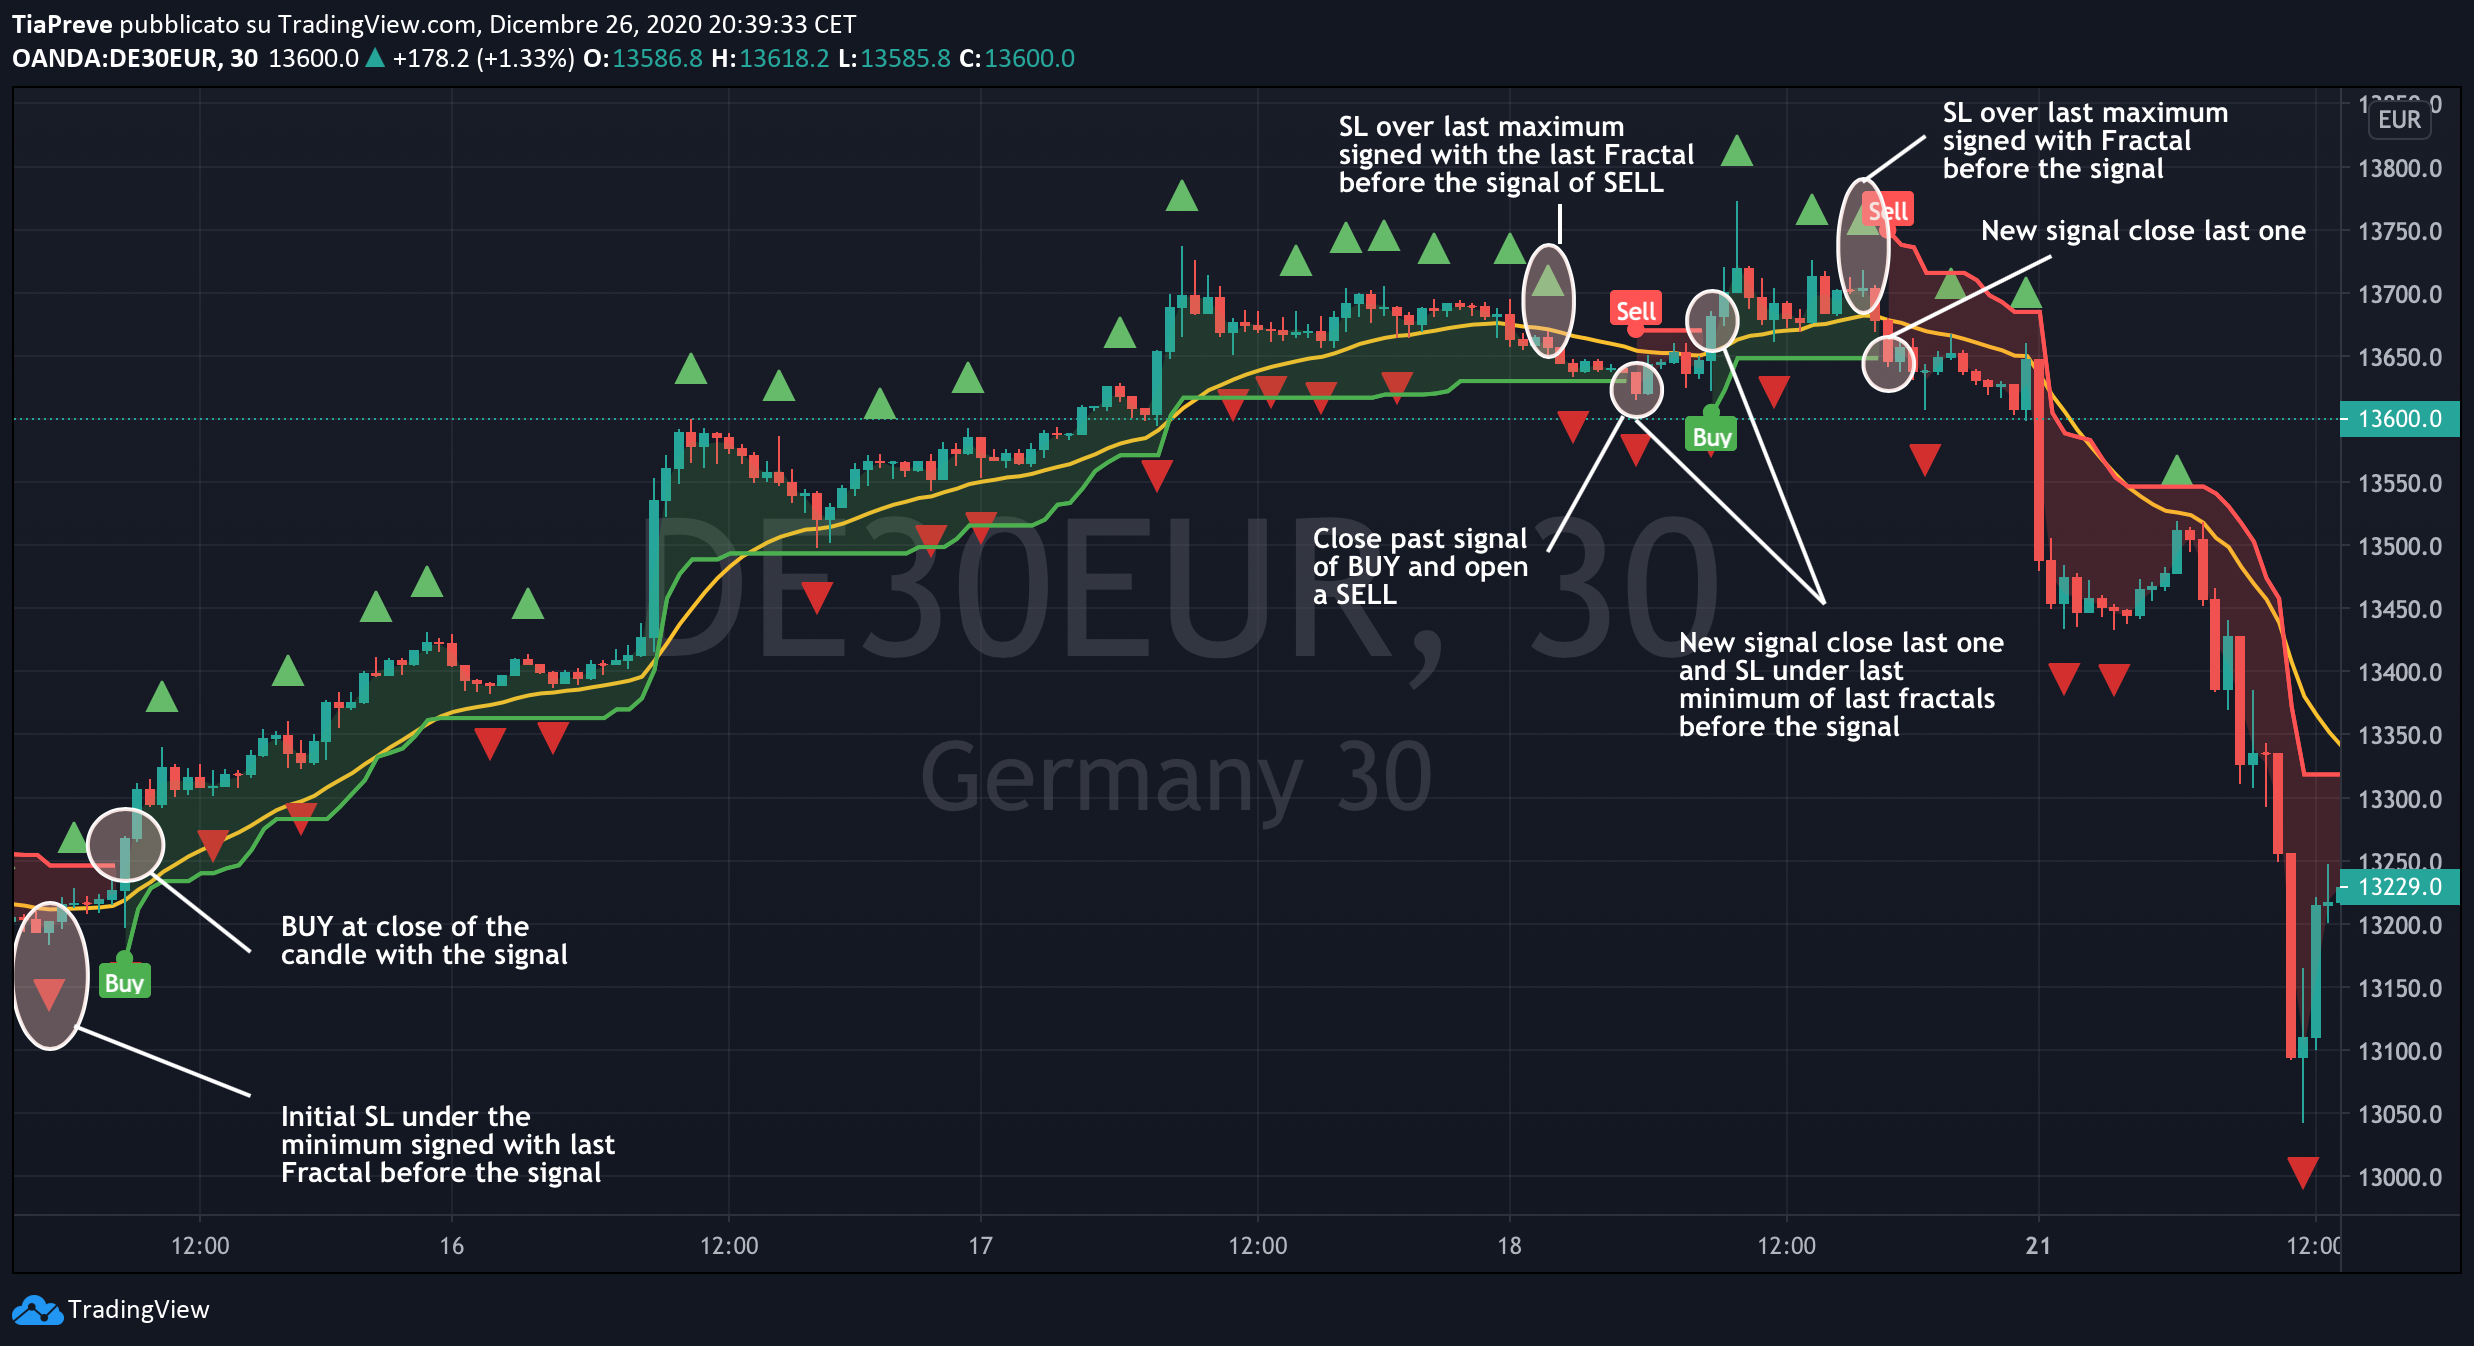
1. Initial SL should put above/below last Fractals signed on the chart (Fractals in not part of the indicator as I use them separately and combined both of them for the strategy).
2. The position opens once the candle is closed.
3. The opposite signal should close the last position and open a new one.
4. I want a multi-timeframe into an only single chart (with the possibility in the setting to write by myself the timeframes I'm interested).
I need the code at the end when I insert the EA I want all the settings to be settable by myself like in the TW indicator + the Timeframe of the FRACTALS and the possibility to choose the multi-timeframe where the EA should operate.
I'd like to have, if it's possible, by 31st of December.
This is the code (is not mine, is a public code that I implement it with use of another indicator like Williams Fractals with timeframe=2 to put the initial timeframe):
study("Supertrend", overlay = true)
Periods = input(title="ATR Period", type=input.integer, defval=10)
src = input(hl2, title="Source")
Multiplier = input(title="ATR Multiplier", type=input.float, step=0.1, defval=3.0)
changeATR= input(title="Change ATR Calculation Method ?", type=input.bool, defval=true)
showsignals = input(title="Show Buy/Sell Signals ?", type=input.bool, defval=true)
highlighting = input(title="Highlighter On/Off ?", type=input.bool, defval=true)
atr2 = sma(tr, Periods)
atr= changeATR ? atr(Periods) : atr2
up=src-(Multiplier*atr)
up1 = nz(up[1],up)
up := close[1] > up1 ? max(up,up1) : up
dn=src+(Multiplier*atr)
dn1 = nz(dn[1], dn)
dn := close[1] < dn1 ? min(dn, dn1) : dn
trend = 1
trend := nz(trend[1], trend)
trend := trend == -1 and close > dn1 ? 1 : trend == 1 and close < up1 ? -1 : trend
upPlot = plot(trend == 1 ? up : na, title="Up Trend", style=plot.style_linebr, linewidth=2, color=color.green)
buySignal = trend == 1 and trend[1] == -1
plotshape(buySignal ? up : na, title="UpTrend Begins", location=location.absolute, style=shape.circle, size=size.tiny, color=color.green, transp=0)
plotshape(buySignal and showsignals ? up : na, title="Buy", text="Buy", location=location.absolute, style=shape.labelup, size=size.tiny, color=color.green, textcolor=color.white, transp=0)
dnPlot = plot(trend == 1 ? na : dn, title="Down Trend", style=plot.style_linebr, linewidth=2, color=color.red)
sellSignal = trend == -1 and trend[1] == 1
plotshape(sellSignal ? dn : na, title="DownTrend Begins", location=location.absolute, style=shape.circle, size=size.tiny, color=color.red, transp=0)
plotshape(sellSignal and showsignals ? dn : na, title="Sell", text="Sell", location=location.absolute, style=shape.labeldown, size=size.tiny, color=color.red, textcolor=color.white, transp=0)
mPlot = plot(ohlc4, title="", style=plot.style_circles, linewidth=0)
longFillColor = highlighting ? (trend == 1 ? color.green : color.white) : color.white
shortFillColor = highlighting ? (trend == -1 ? color.red : color.white) : color.white
fill(mPlot, upPlot, title="UpTrend Highligter", color=longFillColor)
fill(mPlot, dnPlot, title="DownTrend Highligter", color=shortFillColor)
alertcondition(buySignal, title="SuperTrend Buy", message="SuperTrend Buy!")
alertcondition(sellSignal, title="SuperTrend Sell", message="SuperTrend Sell!")
changeCond = trend != trend[1]
alertcondition(changeCond, title="SuperTrend Direction Change", message="SuperTrend has changed direction!")
類似した注文
Preciso de um EA que abra ordens a mercado a partir de um indicador, Ele precisa obter take e stop loss fixos, spread máximo, horários de início e final das operações, meta e stop diário, martingale, painel e a função no script para que eu possa ceder o EA apartir do id do mt4 de terceiros
Hello Investors, I'm selling a profitable and stable expert advisor trading on the Gold (XAUUSD) pair using a cutting-edge scalping strategy. The EA is able to generate a stable monthly income without using martingale strategy, and with an optional cut loss in place. Particularly the average monthly gain can go from 2-3% (at a relatively low risk, with an historical max DD of 6%) to 20-30% (with an aggressive style
Hello, I have a strategy and I need a very good programmer who will create me an exprt or make me an indicator that will open positions for buy/sell limit (see picture below). The indicator/Expert will have to open positions (buy/sell limit) regarding the strategy and indicators (I will explain it more in collaboration). Below I will give pictures of what I mean. I will send a link to the telegram group where it
Atomic Analyst Indicator to EA. I have an mt4 indicator called Atomic Analyst. The indicator gives buy/sell signals as shown in the screenshot. I want to know if you can take this indicator, and create an EA that automatically takes the signals. The indicator puts in the SL and TP1, TP2, TP3, TP4, TP5 automatically. I would like the option to put in my lot size parameter and I would also like an automatic trail stop
can you help me with Ctrader i need modification on the linkhttps://docs.google.com/document/d/1fggk49xWbnwahtfOlE-U7G6muZB1FT8eWmftGiY7R-s/edit?usp=sharing can you assist with cTrader modifications to enhance functionality and improve performance. do text me if you a professional on it i will be looking forward to your response best regards
EA sittings The EA utilises the concept of grid and hedging by creating a zone for recovering losing trades It is a continues trading EA without any stop loss. The EA initially aims to trade continually without the need to hedge. The EA enter the first trade following the direction of the moving average (when price is above or below the moving average), and only hedge when, the trade goes against the trend and reach
Would I honestly need is someone who can make a profitable EA for me that can at least make me around $80 a day starting with $50 and the EA must be able to work with exness the EA should automat trades 24/7. Broker = Exness Pairs = USD/JPY XAU/USD and etc Chart time frames = M1 M15 History = last month till last 6 months. Lot size 0.10 take profit at $2 stop
Hello i am seeking a skilled MetaTrader 5 (MQL5) developer to modify an existing Telegram signal copier. The goal is to enhance the copier's functionality, reliability, and user experience. kindly bid this job to get started immediately
Hello, I’m looking for assistance with creating or customizing a TradingView indicator to suit my trading needs. If you have experience in this area, please reach out. Your help would be greatly appreciated. Thanks
# MT4 Expert Advisor Development Rules ## Time Period Definition 1. Allow user to define a specific time period (e.g., 10:00 to 15:00). 2. Identify and store the high and low prices within this period. ## Price Breakout Detection 3. Monitor current price for breakouts above the period high or below the period low. ## Signal Confirmation (signals will be taken on m5 timeframe) 4. After a breakout, wait for a signal