仕事が完了した
指定
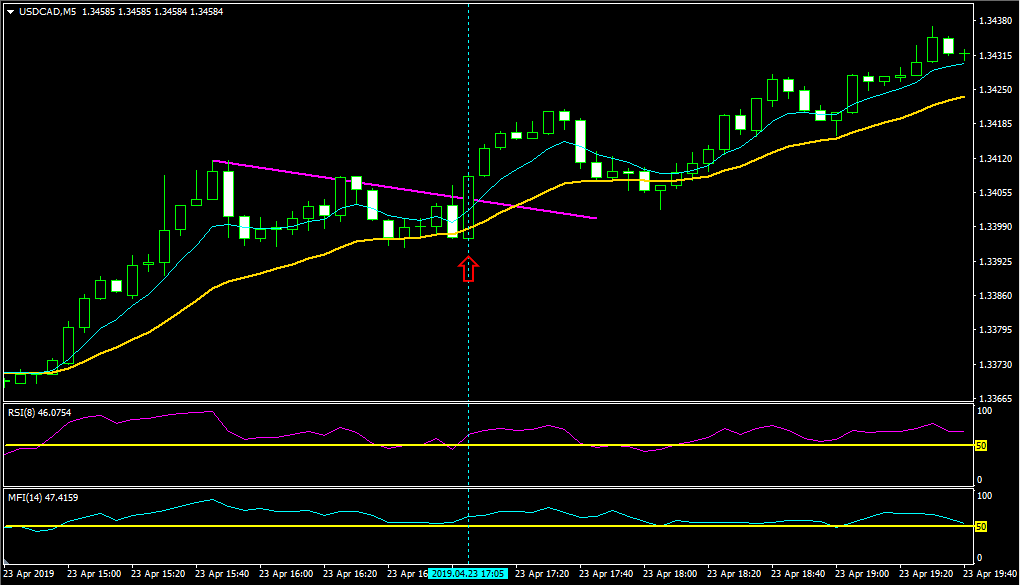
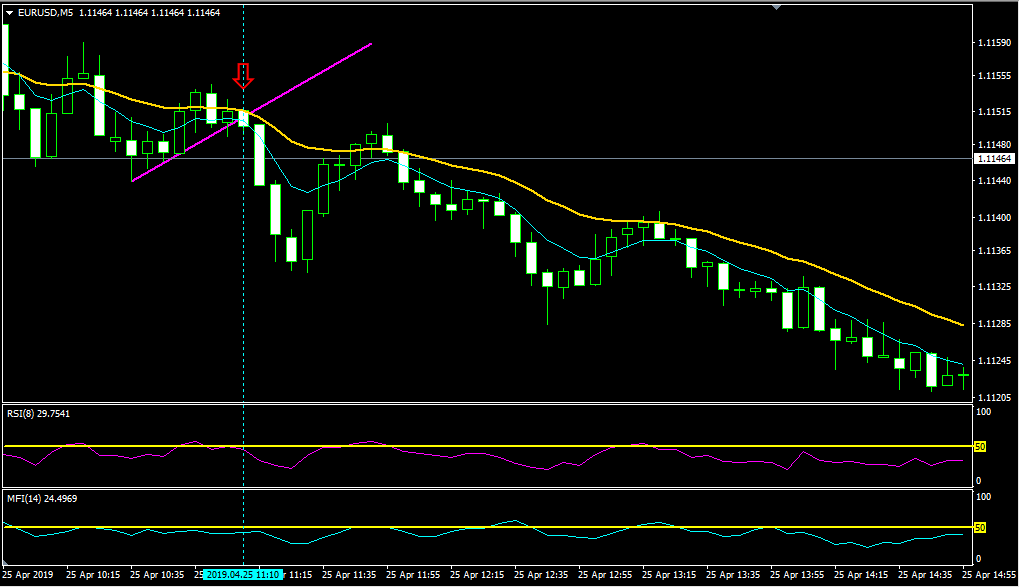
TMT strategy is to catch the higher high / lower low pull back situation during a big trend.
https://www.forexfactory.com/showthread.php?t=912456
Buy stop order:
==============
1) Confirmation of UPTREND (MA 7 line is above MA 20 line),
2) Daily candle >50,
3) MFI >50,
4) RSI >50,
5) After the candle price has pull back, moved inside EMA 7 & 20 line, and closed (ref: "example 1.png"),
6) Draw trendline immediately,
- Trendline joint 1 and joint 2 points must consist of the previous e.g. 2 - 30 candles, that before the pull back candle,
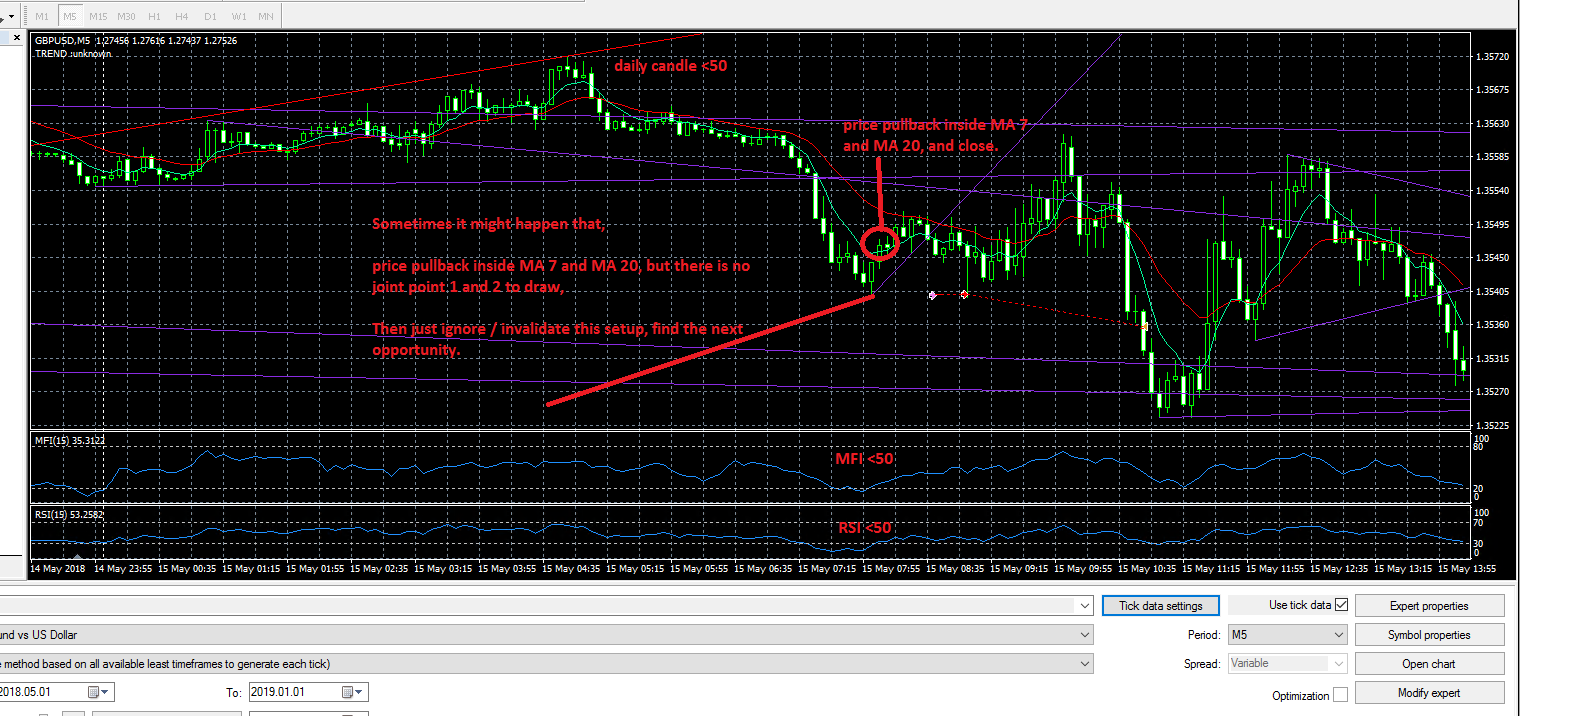
- It may not able to find joint 1 and 2 points sometimes, then dont draw trendline (ref: "example 2.png"),
- If cannot draw trendline, restart condition checking from 1) again,
7) Wait until new candle price breaks ABOVE trendline, and closed,
8) Place buy stop order immediately at closed candle price + XXX pips (ref: "Entry Buffer Pips (for the buy/sell)" at Inputs).
Conclusion:
==========
It should determine condition 1 - 5 first, then only proceed to draw the trendline (condition 6), then place buy stop order immediately (condition 7 - 8).
Sell stop order:
===============
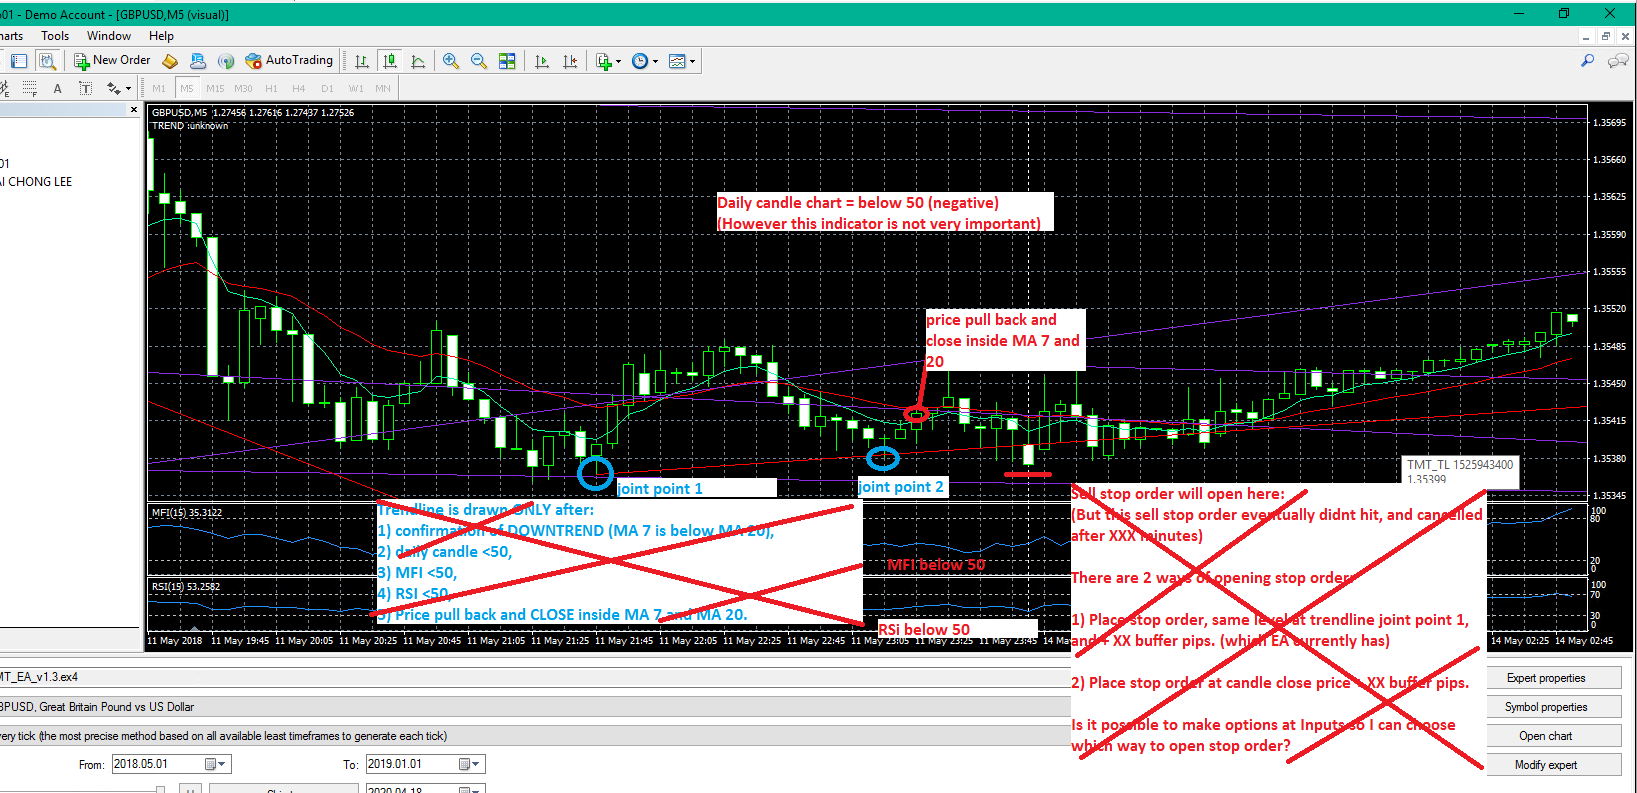
1) Confirmation of DOWNTREND (MA 7 line is below MA 20 line),
2) Daily candle <50,
3) MFI <50,
4) RSI <50,
5) After the candle price has pull back, moved inside EMA 7 & 20 line, and closed (ref: "example 1.png"),
6) Draw trendline immediately,
- Trendline joint 1 and joint 2 points must consist of the previous e.g. 2 - 30 candles, that before the pull back candle,
- It may not able to find joint 1 and 2 points sometimes, then dont draw trendline (ref: "example 2.png"),
- If cannot draw trendline, restart condition checking from 1) again,
7) Wait until new candle price breaks BELOW trendline, and closed,
8) Place buy stop order immediately at closed candle price + XXX pips (ref: "Entry Buffer Pips (for the buy/sell)" at Inputs).
Conclusion:
==========
It should determine condition 1 - 5 first, then only proceed to draw the trendline (condition 6), then place buy stop order immediately (condition 7 - 8).
INPUTS PARAMETERS
=== DAILY CANDLE ===
Enable Daily Candle true/false
Positive Green To Buy (this is not input, just explanation)
Negative Red To Sell (this is not input, just explanation)
=== RSI ===
Enable RSI filter true/false
RSI Period 8
RSI Value to buy 70
RSI Value to sell 30
=== MFI ===
Enable MFI Filter true/false
MFI Period 15
MFI Value to buy 70
MFI Value to sell 30
=== EMA ===
Enable MA Filter true/false
MA1 Period 7
MA2 Period 20
MA Method EMA
MA Apply To Close
=== MONEY MANAGEMENT ===
Money Management Model Risk / Fixed Lot
Risk Percent 1
Fixed Lot Size 0.01
SL in Pips 30 (if SL risk = 1%, 30 pips = 1%)
TP in Pips 30 (if SL risk = 1% = 30 pips, TP 30 pips = 1%)
Entry Buffer Pips (For Stop Orders) 5
=== TRAILING STOP ===
Use Trailing Stop true / false
Trailing Stop Trigger in Pips 15
Move to Breakeven + XX Pips 5
Trailing Stepping in Pips 3
=== GENERAL ===
Hour Start 00:00:00
Hour End 23:59:59
Pending Order Expiry Minutes 600
Magic Number 23382338
Comment TMT
=== TRENDLINE ===
Draw Trendline true/false
Max Candles to Search for Trendline Joint Points 50
Min Trendline Slope 20 (to open pending orders)
Max Trendline Slope 60
Min Trendline Candle Joint Point #2 Distance from Pull Back Candle 2
Min Candle distance for Trendline Joint Point #1 & #2 5
Trendline Color XXX
Trendline Width 2
On the Chart:
=============
1) Successful buy order - blue dot color.
2) Successful sell order - red dot color.
3) Closed orders - dot line link from order price to closed price.
4) If stop orders cancelled (by either new conditions met cancellation, or specific time expiry), leave a short red horizontal line on chart to indicate there was an cancelled order.
Other Conditions:
===============
1) Only 1 buy/sell stop order for each pair & chart. If new conditions met, cancel previous order, and place new order.