私たちのファンページに参加してください
- ビュー:
- 18058
- 評価:
- パブリッシュ済み:
- 2010.08.16 07:56
- アップデート済み:
- 2014.04.21 14:54
-
このコードに基づいたロボットまたはインジケーターが必要なら、フリーランスでご注文ください フリーランスに移動
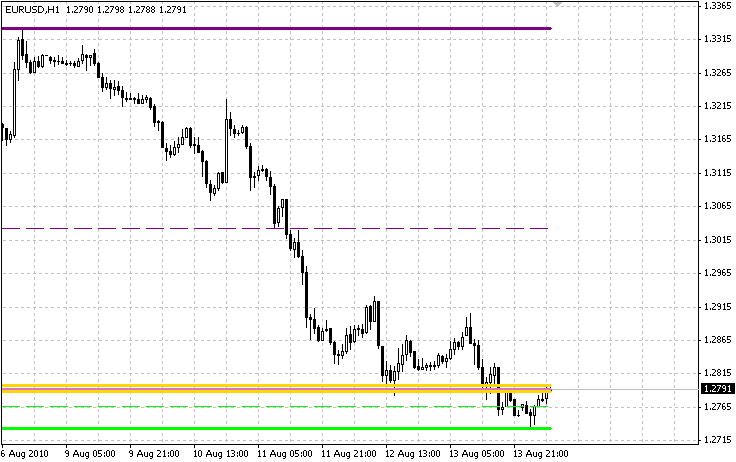
It is well known that MT4 is limited to the number of lines that can be drawn in a single indicator, this family of lines is drawn out in 3 different indicators which work together to provide you with a full array of highs, lows and median lines from all timeframes. the significance of this makes for a suitable series of support and resistance lines for evaluating price movement.
My theory here is that when the price is moving toward a price level where 2 or more price lines are draw, there will be heavy resistance to cross the lines and typically the price will rebound to previous location. If not, the price has a tendency to flow through the level of resistance. If you couple this with Bollinger Bands, something interesting shows up, explore, take a look for yourself.

The downside for this indicator is that when more than one line is drawn for the same price, you only see the last one drawn. I am working on resolving this, but you can open the data window and it will show you which prices are overlayed.
It's like seeing a ghostly candle of each timeframe on your chart. notice the thin lines moving with the price, this is the lower timeframes being pushed in the direction the price is moving, or it might be the median as the smaller timeframe prices push in that direction.
 Cycleidentifier-cyclops
The Cyclops follows the Cycleidentifier indicator, plus SMA and RSI for filter. It is taking a trade when the indi shows a bold two spike. The filter is suppose to confirm with that but the repaint of the spike seems to make this a Martingale effort.
 Syntax checker Revision 1
Check a MetaQuotes Language 4 program for basic syntax errors like unbalanced braces, parentheses, brackets,.sin....
 Slope Rsi MTF Expert
Enjoy this simple Expert Advisor
 Huge Income
Start balance 10000$, trade on eur/usd ,Daily timeframe, only short
