無料でロボットをダウンロードする方法を見る
Telegram上で私たちを見つけてください。
私たちのファンページに参加してください
私たちのファンページに参加してください
記事を気に入りましたか?MetaTrader 5ターミナルの中でそれを試してみてください。
- ビュー:
- 25012
- 評価:
- パブリッシュ済み:
- 2010.07.13 13:24
- アップデート済み:
- 2014.04.21 14:54
-
 取引の機会を逃しています。
- 無料取引アプリ
- 8千を超えるシグナルをコピー
- 金融ニュースで金融マーケットを探索
-
 このコードに基づいたロボットまたはインジケーターが必要なら、フリーランスでご注文ください
フリーランスに移動
このコードに基づいたロボットまたはインジケーターが必要なら、フリーランスでご注文ください
フリーランスに移動
Author:
Diego Alonso Vallejo Duque
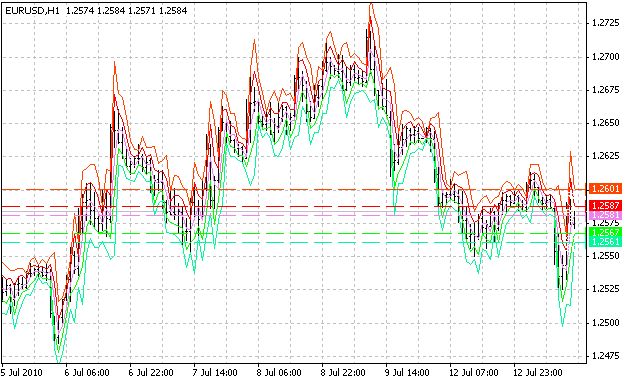
Descripción:
Indicator that shows two resistance levels, 2 levels of support and pivot, they calculated the traditional way.
The variable Last indicates the last bar to be analyzed, the time variable indicates the longer period to see
- 1 - min
- 2-5 min
- 3-15 min
- 4-30 minutes
- 5-1 h
- 6-4 h
- 7-1 d
- 8-1 w
Image:
 RSI Peak & Bottom
It showed the peak/bottom at rsi14
 Daily Opening EA (needs improvement ideas!)
A slightly different EA based off daily opening breaks.
Average Change V 0
This is the basic version of the Average Change indicator
Big Times
This indicator reflects the positive difference between the High and Low of the period.