無料でロボットをダウンロードする方法を見る
Telegram上で私たちを見つけてください。
私たちのファンページに参加してください
私たちのファンページに参加してください
記事を気に入りましたか?MetaTrader 5ターミナルの中でそれを試してみてください。
- ビュー:
- 1380
- 評価:
- パブリッシュ済み:
- 2023.09.07 18:09
-
このコードに基づいたロボットまたはインジケーターが必要なら、フリーランスでご注文ください フリーランスに移動
Introduction
This indicator utilizes two famous price action patterns: The pin and the Inside bar.
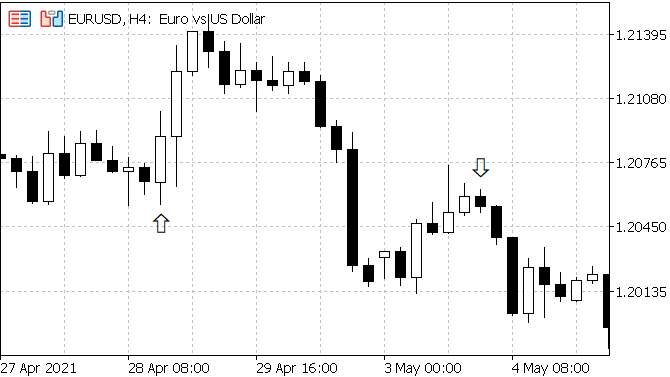
- Buy signals are plotted when the bullish pin bar and the following inside bar appear (first arrow in Figure 1.)
- Sell signals are placed when the bearish pin bar and the next inside bar appear (second arrow in Figure 1.)

Figure 1. The example of this indicator. (EURUSD H4, MinTail=0.667, MaxInside=0.667)
Parameters
This indicator has two inputs: MinTail and MaxInside.
//--- input parameters
input double   MinTail=0.667;    // Minimum size of the pinbar's tail (relative to whole pinbar)
input double   MaxInside=0.75;   // Maximum size of the child bar (relative to the parent bar)
- MinTail defines the lower limit of pin bar tail size.
- MaxInside defines the upper limit of child bar size.
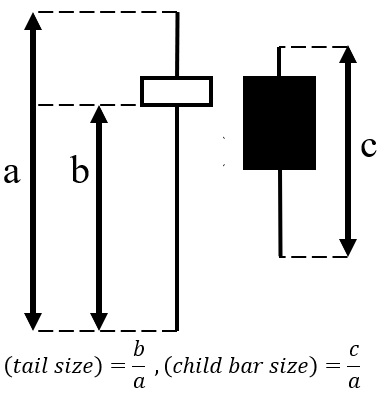
Definitions of pin bar tail size and child bar size are written in Figure 2.

Figure 2. Definitions of tail size and child bar size.
Implementation
Include, macro and properties
//--- properties
#property indicator_chart_window
#property indicator_buffers 2
#property indicator_plots   2
//--- plot Bullish
#property indicator_label1  "Bullish"
#property indicator_type1   DRAW_ARROW
#property indicator_color1  clrBlue
#property indicator_style1  STYLE_SOLID
#property indicator_width1  1
//--- plot Bearish
#property indicator_label2  "Bearish"
#property indicator_type2   DRAW_ARROW
#property indicator_color2  clrRed
#property indicator_style2  STYLE_SOLID
#property indicator_width2  1
Inputs and buffers
BullishBuffer is for buy signals, and BearishBuffer is for sell signals.
//--- input parameters
input double   MinTail=0.667;    // Minimum size of the pinbar's tail (relative to whole pinbar)
input double   MaxInside=0.75;   // Maximum size of the child bar (relative to the parent bar)
//--- indicator buffers
double         BullishBuffer[];
double         BearishBuffer[];
Initialization function
int OnInit()
  {
//--- indicator buffers mapping
   SetIndexBuffer(0,BullishBuffer,INDICATOR_DATA);
   SetIndexBuffer(1,BearishBuffer,INDICATOR_DATA);
//--- setting a code from the Wingdings charset as the property of PLOT_ARROW
   PlotIndexSetInteger(0,PLOT_ARROW,241);
   PlotIndexSetInteger(1,PLOT_ARROW,242);
//--- set buffers as time series
   ArraySetAsSeries(BullishBuffer, true);
   ArraySetAsSeries(BearishBuffer, true);
//---
   return(INIT_SUCCEEDED);
  }
Calculation function
This list shows the outline of how the main for-loop works.
- Obtain prices of the 'parent' bar and 'child' bar.
- The 'parent' bar is the bar two steps ago.
- The 'child' bar is the bar one step ago.
- Plot signals above (sell) or below (buy) of the current bar when conditions are fulfilled.
- Buy conditions: The parent bar is a bullish pin bar, and two bars form inside bar setup.
- Sell conditions: The parent bar is a bearish pin bar, and two bars form inside bar setup.
int OnCalculate(const int rates_total,
                const int prev_calculated,
                const datetime &time[],
                const double &open[],
                const double &high[],
                const double &low[],
                const double &close[],
                const long &tick_volume[],
                const long &volume[],
                const int &spread[])
  {
//--- set series as time series
   ArraySetAsSeries(time, true);
   ArraySetAsSeries(open, true);
   ArraySetAsSeries(high, true);
   ArraySetAsSeries(low, true);
   ArraySetAsSeries(close, true);
//--- calculate limit of iteration
   int limit;
   if(prev_calculated == 0)
     {
      limit = rates_total - 3;
     }
   else
     {
      limit = rates_total - prev_calculated;
     }
//--- search price patterns over time series
   for(int i=limit; i>=0; i--)
     {
      //--- get prices
      double open_parent   = open[i+2];
      double open_child    = open[i+1];
      double high_parent   = high[i+2];
      double high_child    = high[i+1];
      double low_parent    = low[i+2];
      double low_child     = low[i+1];
      double close_parent  = close[i+2];
      double close_child   = close[i+1];
      //--- calculate candles' size, child-to-parent ratio and length of wicks (a, b and c correspond to Figure 2)
      double size_parent         = high_parent - low_parent;                           // a
      double size_child          = high_child - low_child;                             // c
      double child_parent_ratio  = size_child / size_parent;                           // c/a
      double upper_wick_parent   = high_parent - MathMax(open_parent, close_parent);   // b in bearish pin bar
      double lower_wick_parent   = MathMin(open_parent, close_parent) - low_parent;    // b in bullish pin bar
      //--- check pinbar (whether b/a is bigger than MinTail)
      bool parent_bullish_pinbar = lower_wick_parent / size_parent >= MinTail;
      bool parent_bearish_pinbar = upper_wick_parent / size_parent >= MinTail;
      //--- check insidebar (whether parent bar engulfs child bar and c/a is smaller than MaxInside)
      bool insidebar             = high_parent > high_child && low_parent < low_child && child_parent_ratio <= MaxInside;
      //--- check conditions and plot signals
      if(parent_bullish_pinbar && insidebar)
        {
         BullishBuffer[i] = low[i] - 100 * _Point;
        }
      else
        {
         BullishBuffer[i] = EMPTY_VALUE;
        }
      if(parent_bearish_pinbar && insidebar)
        {
         BearishBuffer[i] = high[i] + 100 * _Point;
        }
      else
        {
         BearishBuffer[i] = EMPTY_VALUE;
        }
     }

//--- return value of prev_calculated for next call
   return(rates_total);
  }
 移動平均線を高値側又は安値側に標準偏差分シフトし、ティックによって色が変化するライン指標
移動平均線(MA)と標準偏差を利用し、且つ5ティックごとに反応して、線の色が変化する指標を作成しました。
 為替履歴と指標データの取得
為替履歴と指標データの取得ができるスクリプトです。
 ONNXモデルによる手書き数字の認識例
このエキスパートアドバイザーは取引を行いません。標準的なCanvasライブラリを使って実装されたシンプルなパネルで、マウスを使って数字を書くことができます。数字の認識には、訓練されたmnist.onnxモデルが使用されます。
 トレーダーのためのMQL5プログラミング - 書籍からのソースコード。第1部
本書の第1章では、MQL5言語と開発環境を紹介しています。MQL4(MetaTrader 4言語)と比較してMQL5言語で導入された新機能の1つは、オブジェクト指向プログラミング(OOP)のサポートです。これはC++に似ています。