私たちのファンページに参加してください
- ビュー:
- 36722
- 評価:
- パブリッシュ済み:
- 2023.01.26 15:54
- アップデート済み:
- 2023.10.19 18:04
-
このコードに基づいたロボットまたはインジケーターが必要なら、フリーランスでご注文ください フリーランスに移動
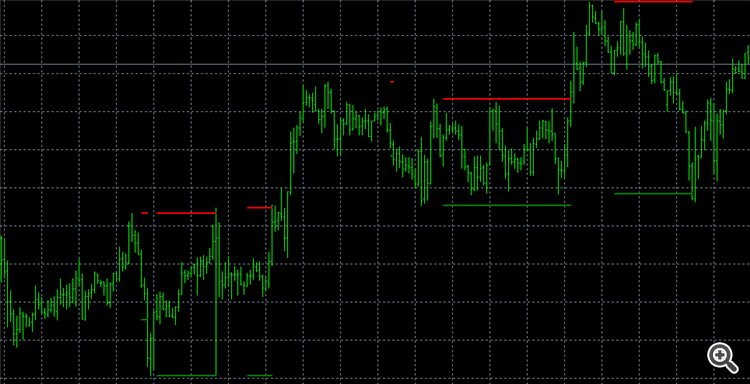
The main idea behind it is to search for support and resistance levels,becouse I could not fint any similar indicator. The support and resistance functions do exactly that. When calculating if both support and resistance levels exist, the indicator sdisplays them on the chrt and save their value, so that if the next price is between them, they will remain the same.
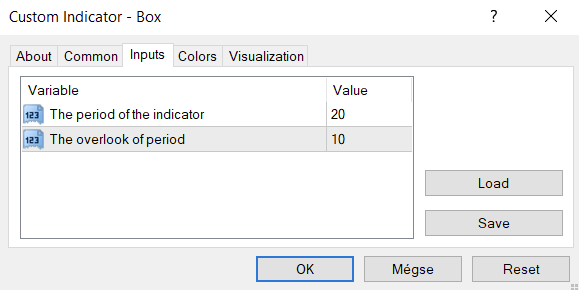
There are 2 input parameters : Period and overlook. The indicator searches for the highest and lowest price for which it is true that it is the highest/lowest in the last (period) bars and also the highest/lowest in the period+overlook bars. If it finds both a highest and a lowest value it displays it on the chart.
The i parameter running in the OnCalculate function should always run from period+overlook.
The indicator does not use any include files. I recommend the settings: period: 20, overlook : 10.

 Wilder's Relative Strength Index
An implementation of the Relative Strength Index indicator by John Welles Wilder Jr. as described in his book—New Concepts in Technical Trading Systems [1978].
 Wilder's Average True Range (ATR)
An implementation of the original Average True Range indicator by John Welles Wilder Jr. as described in his book—New Concepts in Technical Trading Systems [1978].
 GridTrading Algorithm at volatile market
This EA can do Grid trading and has useful functions for Gridtrading included
 period_converter_All_kai
Convert historical data from M1 to M1, M5, M15, M30, H1, H4, D1, W1 and MN, specifying the start date.
