私たちのファンページに参加してください
- ビュー:
- 4405
- 評価:
- パブリッシュ済み:
- 2021.12.08 04:13
-
 取引の機会を逃しています。
- 無料取引アプリ
- 8千を超えるシグナルをコピー
- 金融ニュースで金融マーケットを探索
-
 このコードに基づいたロボットまたはインジケーターが必要なら、フリーランスでご注文ください
フリーランスに移動
このコードに基づいたロボットまたはインジケーターが必要なら、フリーランスでご注文ください
フリーランスに移動
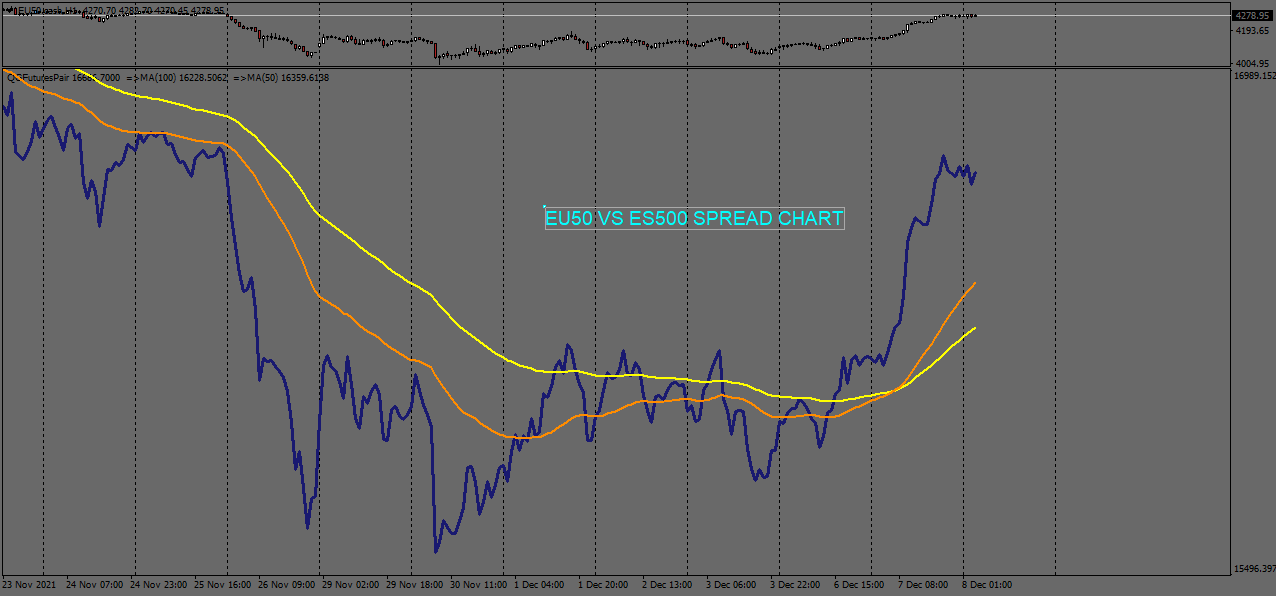
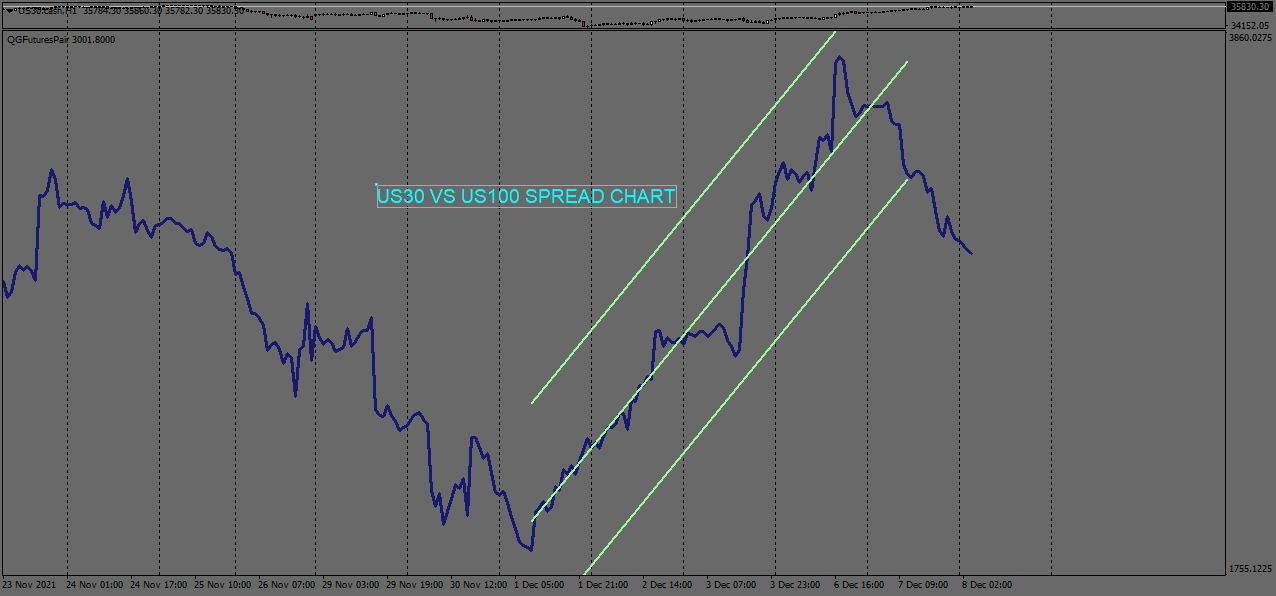
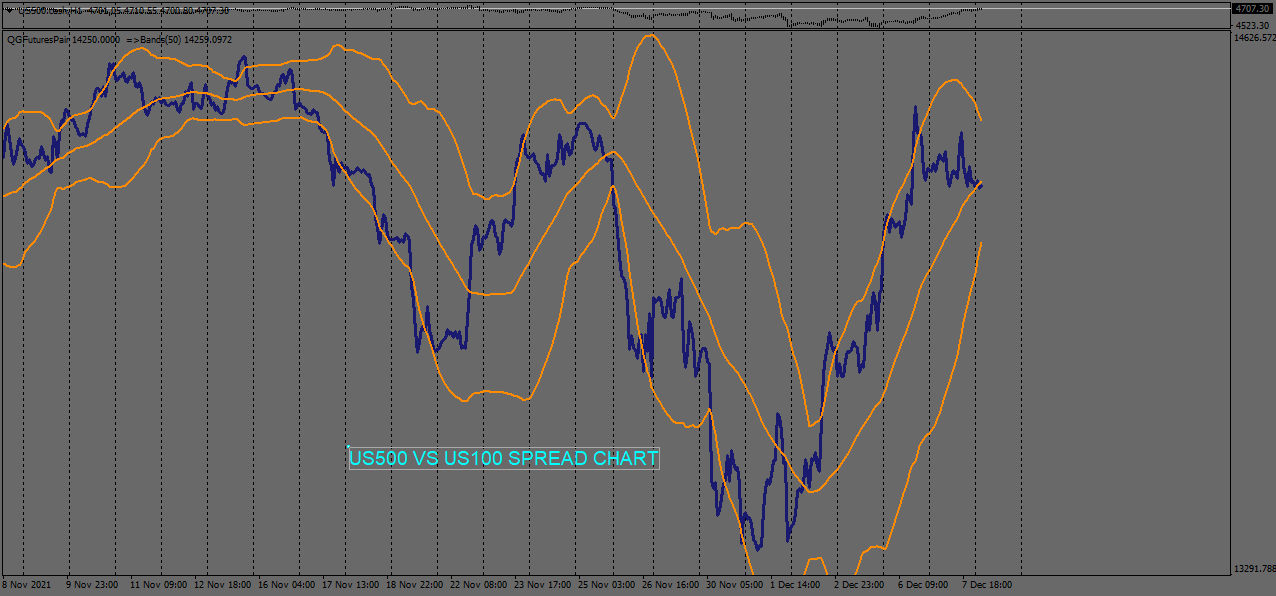
The indicator can chart the spread between 2 instruments as a difference or as a ratio.
Settings:
Instrument1 - Enter a string of first instrument exactly as mentioned by broker
Instrument2 - Enter a string of second instrument exactly as mentioned by broker
Multiplier1 - A multiplying factor for first instrument
Multiplier2 - A multiplying factor for second instrument
ChartDifernce - A boolean which will chart difference between 2 instruments, set to false it will chart spread as a ratio
The spread chart appears in a separate window and then basic indicators can be applied to it like shown in the pictures.
 RSI Extreme Zone
The indicator highlights the value in "over Sold" and "over Bought" zones.
MA Cloud indicator
Moving Average Cloud draws 4 MAs on chart simultaneously in histogram style.
Hotkeys_CycleMarketWatchSymbols_v1.0
cycles though market watch symbols, using hotkeys Comma and Period for prev/next symbol in market watch list
Momentum deviation
Momentum deviation