Capital usage chart with balance and euqity curve
- Indicatori
- Xiangdong Guo
- Versione: 1.0
- Attivazioni: 5
All traders face to a serious question:
How to estimate trading strategy performance and control risk in real-time?
Eventhough use backtest and optimizing in strategy tester, but unfortunately, trader need to deal with the curse of curve-fitting, because optimized result is just for the specific set of historical data that was tested.
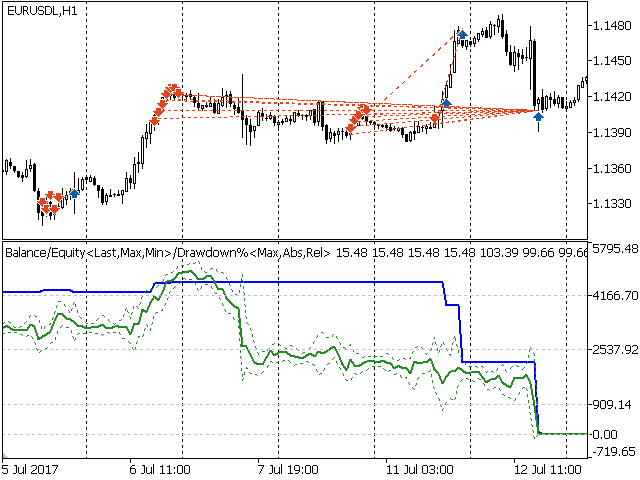
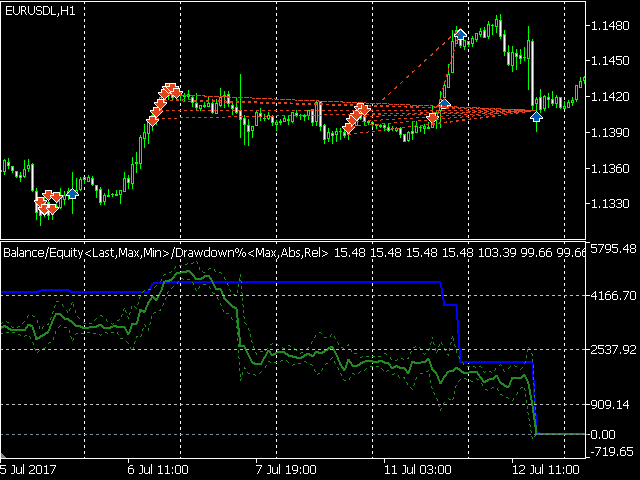
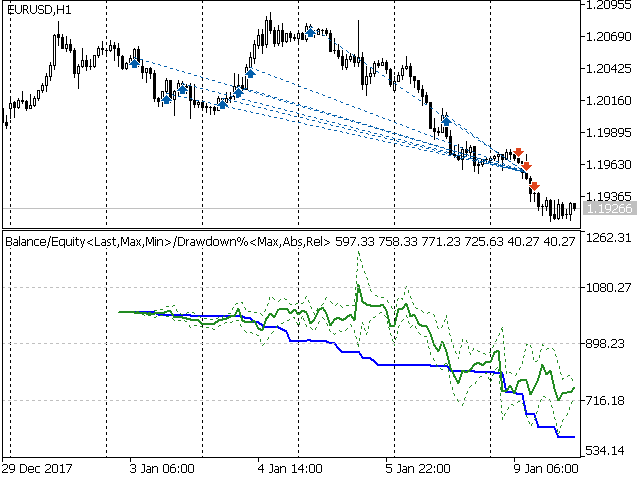
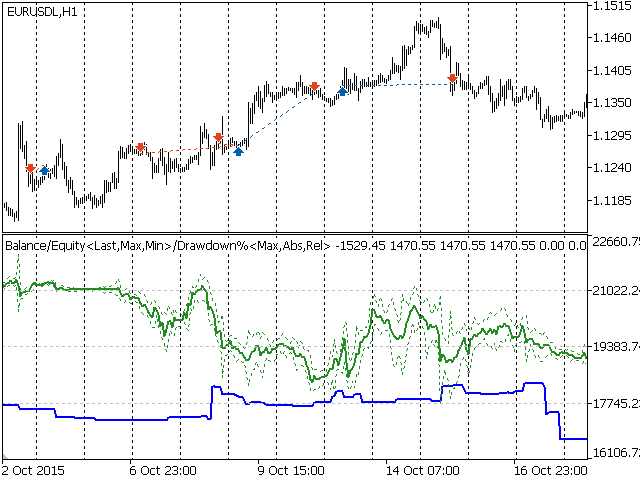
This indicator retrieves deal information from historical data then draws balance and equity curve of account and calculate drawdown in REAL-TIME.
It helps trader to visual analyze trading strategy, and depth mining its advantages/vulnerability.
Especially, monitor dynamic capital usage and control risk.
Support both margin calculation modes: Netting, Hedging.
Supports multiple symbols mixing and single symbol.
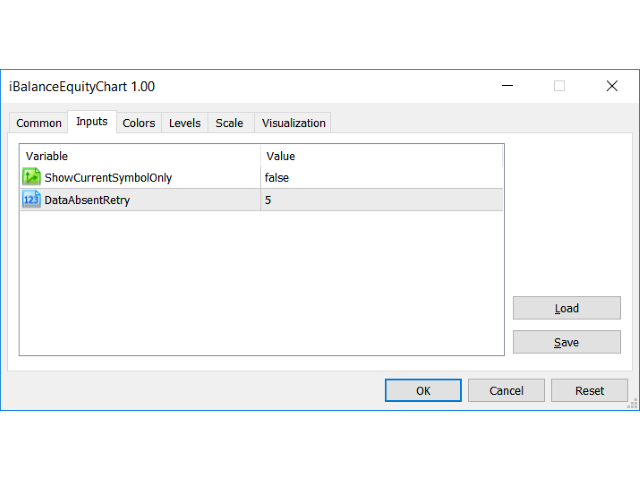
Input Parameter Guides
- ShowCurrentSymbolOnly - Only calculate and draw curve for chart symbol
- DataAbsentRetry - If historical data missing or damaged, retry to load
Operation Instructions
- Ensure that all history data of any symbols are completed, otherwise curve will be distorted.
- Open any symbol chart
- Apply indicator
- Due to spread and tick-value are floating, therefore equity value is little bit different with real equity value.
Chart Description
- Blue curve - Balance
- Greend curve - Thick line is current equity, upper dot line is max value, lower dot line is min value
- Max Drawdown% - Max value of absolute and related
- Abs Drawdown% - Absolute DD%: (Balance(max) - Balance(current)) / Balance(max)
- Rel Drawdown% - Related DD%: (Balance(max) - Equity(current)) / Balance(max)
Good luck!







Excellent idea and may be very useful. Unfortunately, It looks like there are some problems while reading and this is giving wrong readings. Maybe the author may solve this and then the rating will be higher.