Guarda i video tutorial del Market su YouTube
Come acquistare un Robot di Trading o un indicatore
Esegui il tuo EA
hosting virtuale
hosting virtuale
Prova un indicatore/robot di trading prima di acquistarlo
Vuoi guadagnare nel Market?
Come presentare un prodotto per venderlo con successo
Expert Advisors e indicatori a pagamento per MetaTrader 5 - 48
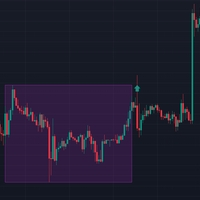
The Smart TimeRange Breaker is a cutting-edge, fully automated trend following strategy that exploits the trend on major pairs and indices like Nasdaq100 and S&P500. The strategy uses the high and low points of a predefined time range and captures the momentum to the end of the trading day. The EA trades on all timeframes, and can be looked upon as a scalping trading system. Low spread and slippage conditions are desirable. The algo exits all trades at the end of the day and a bit earlier on F
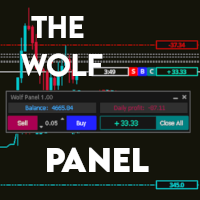
Benvenuti nel Wolf Panel, un pannello avanzato per MetaTrader 5 progettato per ottimizzare l'esperienza di trading. Con la sua interfaccia intuitiva e potenti funzionalità, il Wolf Panel offre un rapido inserimento degli ordini, consentendo ai trader di agire prontamente sulle opportunità di mercato. Tra i suoi punti di forza, spicca il controllo costante del profitto e delle perdite, consentendo agli utenti di monitorare in tempo reale le performance delle loro operazioni. Inoltre, l'indicatore

Exclusive Limited Time Offer! Grab this useful indicator for a lifetime at just $49. Enhance your trading experience with this amazing Metatrader indicator that tracks your live trade status. The indicator displays live take profit, stop loss & trailed stop loss, or trailed profit value with the best dashboard with account balance alert. Indicator Features:
Trade Details The indicator shows the last 5 active trades data in chronological order. Don't miss this opportunity to get your copy tod

This Ea based momentum with rsi , macd , atr , demmarker etc. This EA not designed running yearly, just test monthly with BEP target, need your analytical skills for best time to start this EA not in random condition. No Stoploss, Manual Cut or Floating, need to cut on full slot. Reach me after your purchase, Thank You. OborJadeAir is EA BOT Scalping daily and M15 time frame, with Top and Bottom price and using Resistance to be scalping. Minimal is 1000 for 0.01Lot, Use with your caution. You ca

Gold ETERNAL utilizes deep learning technology to analyze market behaviors and employs advanced algorithms to track market trends effectively. We have optimized this EA for several years persistently so that Gold Eternal has amazing and convincing profitability based on complicated input settings. Please reach out to our team to ask for the appropriate input-setting values. We look forward to your testing and use!
Recommendations: Currency pair: XAU/USD Minimum deposit: $10000 Account type: A
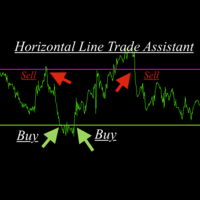
Horizontal Line Trade Assistant EA Semi-Automated Trading Assistant IMPORTANT : On the main/purchased program a user can click on the Horizontal line and change it to Buy or Sell, and drag by double clicking on it. Please keep in mind that this option is not available on demo version, due to some restrictions/limitations of Strategy Tester, some Object related operations are not available in the Strategy Tester. But, it will not prevent you from Testing, please drop an Object to chart
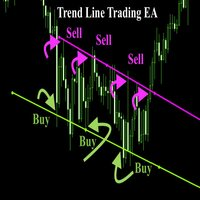
Trend Line Trade Assistant EA Semi-Automated Trading Assistant IMPORTANT : On the main/purchased program a user can click on the Trend line and change it to Buy or Sell, and drag by double clicking on it. Please keep in mind that this option is not available on demo version, due to some restrictions/limitations of Strategy Tester, some Object related operations are not available in the Strategy Tester. But, it will not prevent you from Testing, please drop an Object to chart and it wil

This EA not designed running yearly, just test monthly with BEP target, need your analytical skills for best time to start this EA not in random condition. Obor GemBlue This Ea Bot is the simple one. This bot no swing only low scalping with low or high risk take profit. "Scalping Time"
No Stoploss, Manual Cut Or Floating Info: https://t.me/+aCJtPJ_25bU5NTM1 Channels Mql5: https://www.mql5.com/en/channels/oborpawaiv75
Parameters - Money Deposit - Max accepted loss - RSI Period - Plan for wi

Yabai Bullet is an expert adviser (EA) built on the foundation of smart money concepts, specifically the Fair Value Gap (FVG) and the Silver Bullet strategy. Yabai is a Japanese term that can have a wide range of meanings from the good to the bad to the downright terrible. Although no developer would describe their EA as terrible, the point of this descriptive term is that this EA is customizable to such a high degree that the user has full control on just how amazingly (or terribly) it performs

Pips on Candles mostra il numero di pips coinvolte in ogni candela del grafico. E' possibile impostare 3 range differenti per il conteggio su ogni singola candela tramite il parametro RangeType : Con " HighLow " si contano le pips presenti tra il minimo e il massimo. Il numero viene mostrato sotto ogni candela del grafico. Con " OpenClose " si contano le pips presenti tra il prezzo d'apertura e quello di chiusura della candela. Il numero viene mostrato sotto ogni candela del grafico. Con " Hi

Are you looking for a way to make money in the forex market without risking too much? Do you want to trade with a bot that can adapt to changing market conditions and use a proven strategy to increase your profits? If you answered yes, then you need to check out Forex Martingale Bot, the ultimate trading bot that uses martingale strategy with hedging!
Forex Martingale Bot is a smart and powerful trading bot that can execute trades automatically based on your parameters. It uses the martingale

This EA uses a very simple strategy by using Envelopes indicator to detect potential reversal signals filtred with n time crossover with upper and lower envelopes bands . It uses Martingale for money management . Inputs : SMA_Period : The smoothed MA period on close prices for Envelopes indicator Envelopes_deviation : the % deviation of the upper and lower envelopes bands SL_Pips : the stop loss in pips RR : the used risk reward ratio lots : the initial lot to use in martingale sequence lot

Product Name: RSI Momentum Gauge
Product Description: The RSI Momentum Gauge is an advanced indicator that transforms the traditional concept of overbought and oversold signals from the RSI (Relative Strength Index) into a visually intuitive representation using red and green bars. Designed to empower traders and investors with actionable insights, this innovative indicator provides a clear assessment of market conditions and potential trend reversals. The RSI Momentum Gauge's distinctive fea

The implementation of the Trend Turn trend indicator is simple - in the form of lines of two colors. The indicator algorithm is based on standard indicators as well as its own mathematical calculations.
The indicator will help users determine the direction of the trend. It will also become an indispensable advisor for entering the market or closing a position. This indicator is recommended for everyone, both beginners and professionals.
How to interpret information from the indicator. We se

RSI Barometer Pro provides traders and investors with intuitive insights into market sentiment and potential trend reversals by representing RSI values using red and green bars. The meticulous design of red and green bars in RSI Barometer Pro visually showcases market dynamics. When the bars appear green, it indicates that the RSI is below 50, suggesting a relatively stable market phase. Conversely, when the bars turn red, it signifies that the RSI is above 50, indicating potential market volat

We have turned one application of the RSI indicator into a separate indicator, represented by red and green bars, which is incredibly simple and effective.
By simply inputting the parameters for the RSI, you can obtain the RSI indicator represented by red and green bars. The application of the RSI indicator has been expanded into a powerful new indicator, visually presented through red and green bars, undoubtedly an innovative move in the field of financial technical analysis. The design of t

Kaka Kaki Scalping M30: Introducing , the cutting-edge solution in low-risk automated trading. Unlike conventional systems that tailor strategies to historical data, Kaka Kaki Scalping is meticulously crafted to operate on low-risk settings. This distinguishes it from the commonplace "take and throw" systems reliant on simple grids for survival. This MT5 version is customized version of Original Kaka Kaki Ea mt4, so if you looking Extra futures in the EA you suggested to choose MT4 version. K

L'utilità " Open Time Manager " apre una posizione a un'ora specificata e quindi attiva il trailing classico. L'ora (" Ora ":" Minuti ") è sempre impostata nel fuso orario GMT con un offset GMT Offset. E' possibile selezionare tre opzioni per l'apertura di una posizione utilizzando il parametro ' Modalità Trade ': ' ACQUISTARE ' ' VENDERE ' ' ACQUISTA e VENDI (contemporaneamente) ' ' OFF (no scambi, solo lavori finali) ' Il quarto parametro viene utilizzato quand

Subscribe to the 'MA7 Trading' channel to receive notifications about new programs, updates and other information. Ask questions in the profile on the MQL5 .
Description of work
The 'MA7 Viola' indicator is based on the standard Moving Average (MA) indicator. Shows a sharp increase or decrease in the moving average. Detailed information about the 'MA7 Viola' indicator.
Indicator settings
General settings: Difference – difference between the last two MA values, percentage; Period ; Method
Limited Time Offer! Only $ 150 USD ! The price will increase by $100 USD after every 10th purchase ! Final price: $7100 USD DESCRIPTION : Attention! Contact me immediately after purchase to receive setup instructions!
The Expert Advisor (EA) is designed for capital distribution. We have made every effort to ensure that the minimum deposit is $100 USD.
This advisor is intended for trading with the broker Deriv. The EA has been optimized over the past year, starting fr
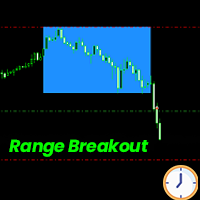
The Time Based Range Breakout Expert Advisor (EA) is a straightforward yet powerful tool designed to automate trading strategy based on intraday price range breakouts . It is suitable for traders who prioritize a disciplined and rule-based approach to trading and capitalizing on market movements within defined time windows . The EA marks the High and Low prices between the given time range and enter a trade when either the high/low of the range is breached. Suitable for trading different Fore

Exclusive EA for Mini Indice (WIN) FuzzyLogicTrendEAWIN is based on strategy using fuzzy logic in which it analyzes a set of 5 indicators. Fuzzy logic and specific weights defined for each indicator are applied to the indicator values (and filters). Once the buy or sell signal fuzzy logic, a trade is opened. The signal is checked with each closed candle, this means that the graphic time is important in the decision. Parameters such as Stop Loss, Break Even among others. Recomm. Symbol: WIN (Mi
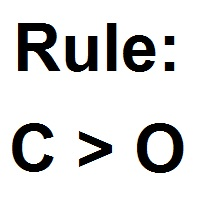
Patterns Wizard è uno strumento per la creazione di pattern di candele. Con esso, puoi creare vari pattern diversi e aggiungere quante istanze di questo indicatore desideri al tuo grafico, ognuna con un pattern diverso. Per capire meglio come funzionano le formule di creazione, puoi prendere esempi dall'indicatore My Candle su My Candle, che ha più di 70 esempi di pattern di candele . La differenza principale di questo indicatore è che ha 30 parametri di regole , il che significa che puoi impo

This EA not designed running yearly, just test monthly with BEP target, need your analytical skills for best time to start this EA not in random condition. OborPawaiV75Net Ea is for Netting Account, this is another version oborpawai75 use for netting. start with 0.01 lot with Recommended 1000 or more deposit, Recommended only with target profit, use on your best moment on best your analytic skill, this bot not work in random moment. This Ea not tested in real account, but if this bot useful for

Subscribe to the 'MA7 Trading' channel to receive notifications about new programs, updates and other information. Ask questions in the profile on the MQL5 .
Description of work
The 'MA7 Flax' indicator is based on the standard Average True Range (ATR) indicator and candle data. Shows candles that are larger in size relative to the ATR indicator value. Detailed information about the 'MA7 Flax' indicator.
Indicator settings
General settings: ATR period – Average True Range indicator period

Adama EA is true trend-following, optimized specifically for trading GBPJPY on timeframe M30.
This currency pair has a significant pip value, and with the right configurations, it is an ideal choice for traders seeking to capitalize on market moves. Adama utilizes one of the oldest and most reliable trading strategies used by institutional traders, and along with internal calculations Adama is designed to provide a sustainable, realistic form of investment.
To achieve maximum efficiency and en

Quante volte avete cercato un PIVOT che funzionasse ogni giorno su uno specifico timeframe?
Molti trader amano stimare la direzione del trend del giorno in base a uno specifico intervallo di tempo giornaliero, ad esempio da 2 ore prima dell'apertura del NYSE a 1 ora dopo, oppure dall'apertura del NYSE a 30 minuti dopo.
Questo indicatore consente di specificare un determinato intervallo di tempo (ora e minuto) e traccia un pivot da quell'intervallo al giorno successivo nello stesso intervall

Lo Smart Delta Volume utilizza livelli dinamici che si regolano automaticamente in base alla volatilità del mercato. Questa caratteristica garantisce un'analisi più precisa e adattabile ai cambiamenti delle condizioni di mercato in tempo reale. Con la capacità di regolarsi dinamicamente, l'indicatore offre una visione più completa e affidabile del flusso di volume e dell'azione dei prezzi. Inoltre, lo Smart Delta Volume presenta un validatore di pullback, che si attiva quando il prezzo supera d

Only 2 copies available for $299.00. Next price 999 USD
AI Breakdown is a scalping strategy based on artificial intelligence. Most trading parameters will be automatically retrained and adjusted to the current market thanks to the author's algorithm of market analysis. The strategy does not require any optimization. Set it on the chart according to the recommendation and enjoy trading!!!
Advantages of AI Breakdown: - self-learning parameters - optimal SL/TP ratio - low SL, which makes t
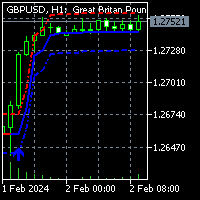
To get access to MT4 version please click here . This is the exact conversion from TradingView: "HalfTrend" by "Everget". This is a light-load processing indicator. This is a non-repaint indicator. Buffers are available for processing in EAs. All input fields are available. You can message in private chat for further changes you need. Thanks for downloading

TRADE BOT X A trading bot for XAUUSD,GBPUSD,US-30 index. Risk levels can be adjusted using the coefficients, but also adjust the maximum drawdown as you increase the coefficients Advisable to use account sizes of USD 500 and above. Account types: Hedging accounts, Standard accounts are preferred i.e. no commissions, Use well regulated brokers eg ICMarkets. all this provides room for the strategy to work smoothly for stabilized results and removing the possibility of the model crashing. ADJUST
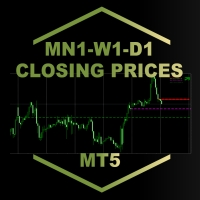
MN1-W1-D1 Close Price Indicator to Index Trading for MT5
The indicator draws lines to the close prices of the last closed bars of monthly, weekly and daily timeframes. Observably, these prices are significant support and resistance prices at major indices, like Nasdaq, DAX. The info panel always shows the prices relative to each other in the correct order. If the current price is the highest - i.e. higher than the last monthly, weekly and daily closing price - it is in the first row. The lowest

Recommended currency pairs: USDJPY, CADJPY, EURJPY. and other. Recommended optimization: It is recommended to do balance max optimization or complex criterion max optimization . Min 1/ 2 year in M15/M30/H1. Other recommendations: const_lot_or_not - true - lot is constant, false lot is variable, Trailing_stop - true recommended, stop_loss_on_off - true recommended, take_profit_on_off - false recommended, max of open positions - 1 - 5, max_Analyzed_Bars - from 1 to 50 every

Now, you have your own AUTO-CLOSE program ! Once your account target or drawdown hits, all open orders will be closed automatically. ========================================== INPUTS: Account target: Put the exact account target. Once the equity hits it or went above that, all orders closed. Please add buffer to consider slippage. Use fixed value or dynamic value: Choose whether you will need a fixed value or dynamic value for drawdown. DYNAMIC SETTINGS: Equity-based or Balance-based drawdo


Equity X è una utility che chiude tutte le posizioni ed eventuali ordini pendenti ad un importo prestabilito, è possibile fissare il bilancio del tuo conto quando il netto e uguale o superiore oppure uguale inferiore all'importo desiderato Ha integrato un sistema per la notifica mobile instantanea che genera il messaggio ad operazione avvenuta Uno strumento che permette di ottimizzare al massimo il rendimento del tuo investimento, è possibile utilizzarlo anche come gestore virtuale di take prof

Welcome to WarungFX https://t.me/warungfx ,
Please set autovalidation to false, input at the bottom under comment variable.
This bot can be use for managing your manual order from any device and in the same time open position based on price action when there is signal and no open order, Backtested 2013-2023 EURUSD M2, GBPUSD M2, default setting NZDUSD m15, default setting USDJPY H1, AUDCAD H1, USDCHF H1, EURCHF H1, GBPCAD H1, AUDJPY H1, using default setting. For Forex Pair I will be using 1

Our goal is to empower every trader with their own unique trading system.
Indicator - Red-Green Series
Ultimate simplicity: Red for uptrend, green for downtrend! It can be used independently or in combination with other indicators. This is a red-green indicator based on the crossover of two moving averages. We have more indicators in store and will be adding them gradually. Friends who make a purchase are kindly requested to contact us after their purchase.
In the world of financial tradi

F-35 Lightning II MT5 is a fully automated expert advisor which utilizes price action and trend trading for "high probability setups". It checks when price becomes exhausted, "pulls back" and continues in a given direction. It especially specializes with EURUSD and XAUUSD and it uses predictable patterns to find the best entries on the 1 minute timeframe. It works especially well on prop accounts. Set files provided in the comments section.
Imagine dominating the trading arena like the F-35 d

Introducing the Engulfing Goddess Metatrader 5 (MT5) Indicator , a revolutionary tool designed for traders who seek to harness the power of candlestick patterns in their trading strategy. This indicator is built on the principles of engulfing candlestick patterns , a popular method used by successful traders worldwide. Our Engulfing Goddess Indicator stands out with its ability to detect various kinds of engulfing patterns . It employs a range of filters, providing you with a comprehensive anal

MT5TradePanel_V1 The panel supports market and pending orders Closing of positions by order type -trade -statistics - risk management - Trailing Stop -select the variant of risk calculation FIXED_LOTS, // fixed lots RISK_MONEY, // lots based on money RISK_RATIO // risk percent of account - percent of loss warning -percent od loss close all -show symbol info

HAshi-E è un modo migliorato di analizzare i segnali Heiken-Ashi.
Briefing:
L'Heiken-Ashi è particolarmente apprezzato per la sua capacità di filtrare la volatilità a breve termine, che lo rende uno strumento privilegiato per identificare e seguire le tendenze, aiuta a prendere decisioni sui punti di entrata e di uscita e aiuta a distinguere tra falsi segnali e vere inversioni di tendenza. A differenza dei tradizionali grafici a candele, le candele Heiken-Ashi sono calcolate utilizzando i v

A very simple position sizing calculator to help traders calculate the right lot size per trade. It also places the order with one click. All inputs can be edited. So if you want to change the SL or TP or the lot size, you can do so before placing an order. The inputs are the following: SL - stop loss in pips (not points). set to 0 before placing an order to not add SL. TP - take profit in pips (not points). set to 0 before placing an order to not add TP. RISK - dollar amount to risk. i

Compared to simple or exponential moving averages, slow adaptive trend lines might offer a more nuanced view of the trend by adjusting their sensitivity based on market conditions. However, their slow nature might also mean they are late in signaling reversals when market conditions change rapidly - and that is the difference between them and our SlowAMA .
SlowAMA was designed to be a better long-term trend indicator than EMA and other Moving Averages. It uses our JurMA calculations, reducing

The Dragonfly Doji candlestick pattern is formed by one single candle. Here’s how to identify the Dragonfly Doji candlestick pattern: The candle has no body The wick at the bottom must be big At the top, it should have no wick, or be very small This 1-candle bullish candlestick pattern is a reversal pattern, meaning that it’s used to find bottoms. For this reason, we want to see this pattern after a move to the downside, showing that bulls are starting to take control. When a Dragonfly Doji cand

The Bullish Counterattack Line candlestick pattern is formed by two candles. Here’s how to identify the Bullish Counterattack candlestick pattern: The first candle is bearish and big The second candle is bullish and small There’s a gap between the close of the first candle and the open of the second candle They both close at the same level This 2-candle bullish candlestick pattern is a reversal pattern, meaning that it’s used to find bottoms. For this reason, we want to see this pattern after a

The Three Outside Up candlestick pattern is formed by three candles. Here’s how to identify the Three Outside Up candlestick pattern: The first candle is bearish and small The second candle is bullish and engulfs the first one completely The third candle is bullish and closes above the other ones This 3-candle bullish candlestick pattern is a reversal pattern, meaning that it’s used to find bottoms. For this reason, we want to see this pattern after a move to the downside, showing that bulls are

The Tweezer Bottom candlestick pattern is formed by two candles. Here’s how to identify the Tweezer Bottom candlestick pattern: The first candle is bearish The second candle is bullish The lows from both candles should be pretty much at the same level This 2-candle bullish candlestick pattern is a reversal pattern, meaning that it’s used to find bottoms. For this reason, we want to see this pattern after a move to the downside, showing that bulls are starting to take control. When a Tweezer Bott

The Bullish Harami candlestick pattern is formed by two candles. Here’s how to identify the Bullish Harami candlestick pattern: The first candle must be bearish and have a big body The second candle must be small and bullish The second candle is inside the body of the first candle This 2-candle bullish candlestick pattern is a reversal pattern, meaning that it’s used to find bottoms. For this reason, we want to see this pattern after a move to the downside, showing that bulls are starting to
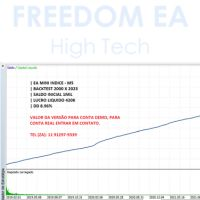
Looking to boost your financial market results?
The EA Mini Index is the answer. Tested and enhanced since 2000, this expert advisor offers operations on the M5 chart, with an initial balance of R$ 1,000 and an impressive net profit of R$ 420,000 until 2023, maintaining a drawdown of only 8.96%.
Seize this unique opportunity to increase your profitability and operate more effectively.

Currency Strength Dynamic La forza valutaria dinamica è un indicatore della forza valutaria. La forza valutaria si riferisce alla direzione del trend della maggior parte o di tutte le coppie valutarie di cui una valuta fa parte.
L'indicatore si basa sulla lettura della differenza tra le medie mobili, simile all'indicatore MACD, sulle 28 coppie di valute più popolari: maggiori e minori.
Vantaggi Metodo di calcolo oscillatorio unico Disponibilità di pulsanti per disabilitare o abilitare linee

This indicator helps you identify support and resistance levels. Also it adds break points when level is broken. Price sometimes goes back to break point. It has 4 technical parameters and 4 buffers for expert advisors. Buffer indexes: 0 - Resistance, 1 - Support, 2 - Resistance break point, 3 - Support break point". Number of Levels: Determines how many levels are on graph ( if 3 - 3 levels of support and 3 levels of resistance) Tolerance in percentage %: This parameter is used to filter out
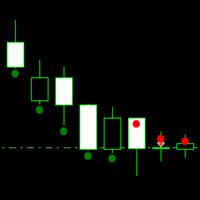
Simple EA with an self-made indicator and Grid. The Expertadvisor opens positions when the market behavior changed from bullish to bearish or vice versa. To determine the market behavior the indicator simply measures how many points it has moved up and down for the last X candles.
It then uses a simple grid strategy if the position turns into a loss. Grid levels can be defined specific to the market.
It depends on your personal preferences and the respective market which parameters should be
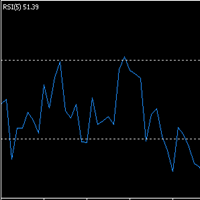
Simple EA with two indicators (SMA + RSI) and Grid. The Expertadvisor opens positions in the direction of the trend when the RSI line turns above 80 or below 20. It then uses a simple grid strategy if the position turns into a loss. Grid levels can be defined specific to the market.
It depends on your personal preferences and the respective market which parameters should be set and how. You have to test it yourself. The EA is programmed in such a way that optimization runs consume little time.
Prop Drawdown Manager is a sophisticated utility tool designed to assist traders in effectively managing and minimizing the impact of drawdowns within their forex trading accounts. Drawdowns, which represent the reduction in capital from peak to trough, are an inevitable aspect of trading, but they can be detrimental if not managed properly. This utility provides traders with a suite of features aimed at controlling drawdowns and preserving trading capital: 1. Drawdown Thresholds : Traders can
Subscribe to the 'MA7 Trading' channel to receive notifications about new programs, updates and other information. Ask questions in the profile on the MQL5 .
Description of work
The 'MA7 Agave' indicator is based on the standard Average Directional Movement Index (ADX) indicator. Shows the intersection of the +DI and -DI lines. Detailed information about the 'MA7 Agave' indicator.
Indicator settings
General settings: ADX period - Average Directional Movement Index indicator period.
'MA7

The underlying strategy of this indicator is based on identifying momentum in the market and attempting to capture the direction of the trend through transitions between bullish and bearish moments. Utilizing bands around the RWMA allows for identifying potential overbought and oversold situations in the market.
1. Calculation of the Range Momentum Index (RMI): The RMI is based on a combination of the Relative Strength Index (RSI) and the Money Flow Index (MFI), both of which are momentum ind

Exclusive FOREX account HEDGE FuzzyLogicTrendEA is based on fuzzy logic strategy based on analysis 5 indicators and filters.
When the EA analysis all this indicators, it decides, based on its fuzzy strategy, which trade will be better: sell or buy.
As additional functions, it´s possible defines spread maximum, stop loss and others.
Recomm. Symbol: EURUSD, AUDUSD, GBPUSD, NZDUSD, USDCAD, AUDCAD, EURCAD e USDJPY
Recomm. timeframe: H1.
Backtest were done on EURUSD, H1, 01/07/2023 - 26/0
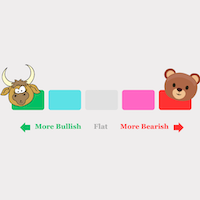
By using (MOMENTUM and VELOCITY and ACCELLERATION) and the power of machine learning we can accurately calculate the current strength of the currencies of each time frame. - It's really easy to use: Choosing to trade between currency pairs that have clear and dominant trends will give you a great advantage. -The currency pair strength meter is rated from -100 to + 100

Introducing the True Currency Strength Indicator - Your Ultimate Guide to Market Mastery! Are you tired of guesswork when it comes to trading? Ready to elevate your trading strategy to a whole new level? Look no further! We present to you the True Currency Strength Indicator - the game-changer in the world of Forex trading. Unleash the Power of Multi-Currency Analysis: Gain a competitive edge with our revolutionary indicator that goes beyond traditional single-currency analysis. The Tru
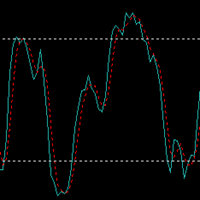
Simple EA with two indicators (SMA + STOCHASTIC) and Grid. The Expertadvisor opens positions in the direction of the trend when the lines of the Stochastic indicator intersect in the swing high or swing low area. It then uses a simple grid strategy if the position turns into a loss. Grid levels can be defined specific to the market.
It depends on your personal preferences and the respective market which parameters should be set and how. You have to test it yourself. The EA is programmed in suc
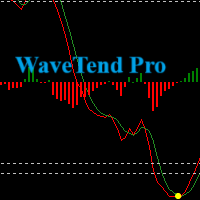
Introducing our Wave Trend Oscillator Indicator , exclusively designed for MetaTrader 5 . This advanced tool is a must-have for traders who seek precision and efficiency in their trading journey. Our oscillator is built on the principles of wave trend analysis , capturing the ebb and flow of market trends with unparalleled accuracy. It helps traders identify potential buying and selling points based on market wave patterns, enabling you to stay ahead of the market. One of the key features of ou

Uncover high-probability opportunities in trending markets with the Brilliant Entries Indicator. Its clear visual signals can be followed and incorporated with market structure to provide you with accurate entries. Give it a try and gain an edge in your trading strategy.
It can be used on it's own but i highly recommend to used it as part of a wider strategy to provide you with confluence.
It works on all timeframes but will work very good doing market structure 2 x timeframes higher and t

In the realm of technical analysis, ParbMA emerges as a highly intuitive tool for examining the Parabolic SAR trend . This innovative approach leverages a customizable line, distinguished by its versatility in color, shape, and width options. Such flexibility enhances visual analysis and significantly aids in strategizing and decision-making.
The ParbMA (Parabolic Moving Average) is a custom technical indicator that combines the concepts of J. Welles Wilder's Parabolic SAR (Stop and Reverse)

Limited Time Offer! Only $ 150 USD ! The price will increase by $100 USD after every 10th purchase ! Final price: $ 15 000 USD DESCRIPTION : Attention! Contact me immediately after purchase to receive setup instructions!
The Expert Advisor (EA) is designed for capital distribution. We have made every effort to ensure that the minimum deposit is $100 USD.
This advisor is intended for trading with the broker Deriv. The EA has been optimized over the past year, starting

L'On-Balance Volume (OBV) è un indicatore tecnico che mette in relazione volume e prezzo per identificare i movimenti di prezzo. L'idea di base dell'OBV è che le variazioni di volume generalmente precedono le variazioni di prezzo. L'indicatore accumula i volumi per i periodi in cui il prezzo chiude in rialzo e sottrae i volumi per i periodi in cui il prezzo chiude in ribasso. Il risultato è un valore utilizzato per identificare la direzione del trend dell'asset.
L'interpretazione dell'OBV è s

Designed by Welles Wilder for daily commodity charts, the ADXW is now used in various markets by technical traders to assess the strength of a trend or even a trend for short- or long-term trades.
The ADXW uses a positive (DI+) and negative (DI-) directional indicator in addition to its trend line (ADX).
According to Wilder, a trend has strength when the ADX signal is above 25; the trend is weak (or the price has no trend) when the ADX is below 20. The absence of a trend does not mean that

The Adaptive Market Navigator(AMN) EA is an automated trend-based trading advisor combining the advantages of ATR, Bears Power and Moving Average indicators. The used strategy is well suited for both beginners and experienced traders.
The minimum deposit is $100 for a 1:100 leverage.
I recommend to use a 1:100 ECN account with a low spread and a fast VPS.
Optimized for EURUSD pair on 1H timeframe.
Due to the simplicity and convenience of this EA every user can give it a try and choose t

Position Manager serves as an expert advisor (EA) designed to enhance your trading experience by providing a user-friendly panel for intuitive management of your positions. This tool empowers you with a seamless interface, allowing for efficient handling of trades and improved control over your trading positions. The primary objective of Position Manager is to simplify and streamline the management of your positions, enabling you to make informed decisions with ease. Through its intuitive design

Nuker shows a practical functionality by examining the length of the preceding candle and taking action when it exceeds a predetermined threshold. By considering the historical context of candle lengths, Nuker response to candle length variations. Backtest was perform using in sample data from 2012 until 2019 and out of sample from 2020 to the middle of 2023. As you can see in the picture below, the results are fantastic in the last 3 years. It is live since August 2023, also providing an excele
Il MetaTrader Market è l'unico negozio online dove è possibile scaricare la versione demo gratuita di un robot di trading che consente di effettuare test e ottimizzazioni utilizzando dati statistici.
Leggi la descrizione dell'applicazione e le recensioni di altri clienti, scaricala direttamente sul tuo terminale e prova un robot di trading prima di acquistarlo. Solo sul MetaTrader Market è possibile testare un'applicazione in modo assolutamente gratuito.
Ti stai perdendo delle opportunità di trading:
- App di trading gratuite
- Oltre 8.000 segnali per il copy trading
- Notizie economiche per esplorare i mercati finanziari
Registrazione
Accedi
Se non hai un account, registrati
Consenti l'uso dei cookie per accedere al sito MQL5.com.
Abilita le impostazioni necessarie nel browser, altrimenti non sarà possibile accedere.