Guarda i video tutorial del Market su YouTube
Come acquistare un Robot di Trading o un indicatore
Esegui il tuo EA
hosting virtuale
hosting virtuale
Prova un indicatore/robot di trading prima di acquistarlo
Vuoi guadagnare nel Market?
Come presentare un prodotto per venderlo con successo
Expert Advisors e indicatori a pagamento per MetaTrader 5 - 16

The main objective of this indicator is to determine entry and exit points, that is why ExactArrow draws nothing but arrows showing entry and exit points. In spite of apparent simplicity of the indicator, it has complicated analytic algorithms which determine entry and exit points. The indicator generates exact and timely entry and exit signals which appear on the current candle. The indicator generates an average of 1-2 candles before its analogues do. The indicator is very easy to use. Open Bu
Strategia: Quando il mercato statunitense si apre, c'è un enorme aumento di volume e quindi di volatilità. Il prezzo tende a "breakout" da un intervallo predefinito, ad esempio, un set durante le precedenti ore di negoziazione del Regno Unito. Time Breakout ci permette di scambiare facilmente queste opportunità di breakout. Caratteristiche: Analisi delle rotture basata sul tempo: la strategia si concentra su intervalli di tempo specifici che storicamente mostrano una maggiore volatilità del merc
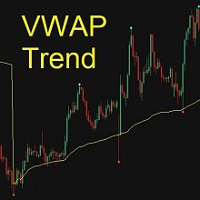
The Anchored VWAP (Volume-Weighted Average Price) indicator is a popular technical analysis tool used by traders and investors to analyze the price action over a period of time. This indicator will automatically identify the trend turning points to help traders more easily see when market is continuing the trend, pulling back, or reversing by crossing the VWAP line. Stack on multiple time frame periods to use like other moving average indicators. You can customize price calculatio

The indicator shows when there are overpricing and divergences over a normalized MACD Plus, it displays signals with configurable alerts, self-regulating dynamic overprice levels, and a simple setup and interface. The indicator that automatically calculates overprices ranges! MACDmaxmin is an indicator based on the MACD oscillator that effectively identifies trend changes in price, as it is a momentum indicator that captures the trend and shows the relationship between two moving averages of th

This indicator calculates support and resistance prices in multi-timeframe with different formulation and draw them on the chart that style do you choose. And If you want, Indicator can alert you when the current price arrive these pivot levels. Formulations: Classic, Camarilla, Woodie, Demark, Floor, Fibonacci
Alert Options: Send Mobil Message, Send E-mail, Show Message, Sound Alert
Levels: PP, S1, S2, S3, S4, S5, R1, R2, R3, R4, R5, TC, BC and Middle Points Why do you need this indicator:
The EA uses 4 strategies, each strategy uses joint work on several currencies at the same time. The EA uses 4 stages of control and order tracking for a step-by-step profit capture. Trading is carried out in a pair for several currencies at the same time, trading is also carried out in a group of several strategies, for example: the advisor opens orders simultaneously for two or more pairs and closes upon reaching a certain profit in% of the current or user balance. The EA does not use Marti

MACD Scanner provides the multi symbols and multi-timeframes of MACD signals. It is useful for trader to find the trading idea quickly and easily. User-friendly, visually clean, colorful, and readable. Dynamic dashboard display that can be adjusted thru the external input settings. Total Timeframes and Total symbols as well as the desired total rows/panel, so it can maximize the efficiency of using the chart space. The Highlight Stars on the certain matrix boxes line based on the selected Scan M
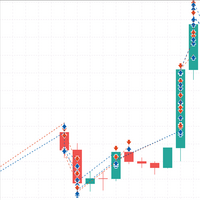
MT4 Version : https://www.mql5.com/en/market/product/87060 Matrix Hacker est réservé aux comptes couverts et utilise la marche aléatoire, le passé n'a pas d'importance. L'EA se fixe pour garder une assise stable sur le marché et couvrir à la fois les demandes et les offres. Achète et vend des offres et des demandes avec des quantités et des volumes variables selon le commerçant. Ce n'est pas recommandé pour un débutant car cela nécessite toujours de connaître l'optimisation et de ne pas sure

L'indicatore di tendenza " Avviso flessibile Super Trend " ha un minimo di impostazioni. Questo indicatore è progettato per essere il più facile possibile da usare. L'indicatore mostra il trend con una linea principale colorata (linea "SuperTrend", che puoi vedere nella finestra "Finestre dati"). Inoltre, nei punti in cui il trend cambia, l'indicatore mostra delle frecce colorate ( icone "STBuy" e " STSell", che puoi vedere nella finestra "Finestre dati" ). Nei punti in cui la tend

OTTIMIZZA PER UN ANNO PER TROVARE I MIGLIORI VALORI
Il flusso degli ordini è unico in quanto scambia il volume. È stato costruito su EUR/USD ed è ottimizzato dall'11/11/2021 al 24/10/2022 su grafici a 1 ora. Vengono utilizzati input di ottimizzazione per la gestione del denaro. Questo EA utilizza una rigorosa gestione del denaro, non è una martingala veloce per arricchirsi o EA senza sl. Il trading riguarda la gestione del rischio, non il gioco d'azzardo. Esegui su grafico EUR/USD 1 ora o se
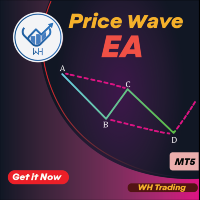
Presentazione di Price Wave EA MT5 Expert Advisor: uno strumento innovativo progettato per sfruttare la potenza del modello ABCD nel mercato forex, sviluppato per MetaTrader 5
Questo EA sfrutta il mio indicatore gratuito Price Wave Pattern MT5 per identificare opportunità di trading redditizie con precisione ed efficienza. Il modello ABCD è un modello grafico ben noto e affidabile utilizzato dai trader professionisti per identificare potenziali inversioni o continuazioni del trend.
A

BOOSTER FOR MT5 is a professional scalping advisor for daily work on the FOREX currency market. In trading, along with experience, traders usually come to understand that the levels of accumulation of stop orders, price and time play a significant role in the market. This FOREX Expert Advisor implements this strategy, and I hope that you will not only enjoy using this product, but also take part in its development - leaving your review with wishes here https://www.mql5.com/en/market/product/459

L'indicatore disegna automaticamente i livelli di Fibonacci in base all'indicatore ZigZag, alle sessioni di trading, ai frattali o alle candele (inclusi intervalli di tempo non standard: anno, 6 mesi, 4 mesi, 3 mesi, 2 mesi) (ritracciamento automatico di Fibonacci). Puoi scegliere qualsiasi intervallo di tempo più lungo per il calcolo di Fibonachi. I livelli vengono ridisegnati ogni volta che la barra corrente si chiude. È possibile abilitare gli avvisi quando si superano i livelli specificati.

Multicurrency and multitimeframe modification of the ZigZag indicator. Displays the current direction of the market, the height of the last movement, the number of bars in this movement and the breaking of the previous point of the ZigZag (horizontal line). This is MTF Scanner, you can actually see the supply and demand levels.
You can specify any desired currencies and timeframes in the parameters. Also, the panel can send notifications when the ZigZag changes direction or when there was a b
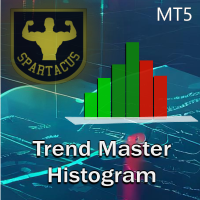
Trend Chart Histogram è un indicatore basato su un algoritmo che utilizza due medie mobili e diversi oscillatori. Grazie al suo codice colore, consente di identificare rapidamente la tendenza e sfruttare i maggiori impulsi del mercato. I colori chiari indicano la tendenza, i colori scuri definiscono gli impulsi e il grigio indica che non dovresti entrare nel mercato.
Versione MT4 qui.
Parametri di input:
- Periodo 1 (periodo veloce)
- Periodo 2 (periodo lento)
- Periodo dell'oscillato

Definition : TPO is a Time Price Opportunity. Instead of using bars or candles with an Open, High, Low, and Close price, each "bar" in a Market Profile is represented by horizontal bars against the price It is called Market Profile terminology.
In other words time-price-opportunity (TPO) profiles are histograms of how much time was spent at each price within the span of the profile.
By using a TPO chart, you are able to analyze the amount of trading activity, based on time, for each price leve

| Fully-automated Smart Money Concept (ICT) inspired trading solution with multi-strategy capabilities | Built by a grid trader >> for grid traders. This is MT5 version, click here for Blue CARA MT4 (settings and logics are same in both versions) Real monitoring signal --> Cara Gold Intro Blue CARA EA ('CARA') - short for C omprehensive A lgorithmic R esponsive A dvisor is a next-gen multi-currency multi-timeframe EA base on the widely known (and perhaps the most popul

This is Gekko's customizable version of the famous Heiken Ashi indicator. It extends the use of the famous Heiken Ashi and calculates strong entry and exit signals. Inputs Number of Bars to Plot Indicator: number of historical bars to plot the indicator, keep it low for better performance; Produce Arrow Signals: determine if the indicator will plot arrow signal for long/short; Produces Signal Only When a Bar Closes: wait for a bar to close to produce a signal (more accurate, by delayed entry
Crash Scalper Gold It is an indicator, where it marks points of purchase and points of sale As the name says, it is used to scalp in the pairs of (Crash) 1000/500/300 where it sends you signals of sale/Sell and purchase/Buy at level points (90) he sends you the sell signal, (Spike) at the level point (27) it sends you the buy signal, (Trend Candles) It is very simple and easy to use. to make the best tickets possible! For this period it will remain on sale! Without further ado, enjoy! Good profi
Alright. This indicator works on MT5 and is very easy to use. When you receive a signal from it, you wait for that candle with the signal to close and you enter your trade at the beginning of the next new candle. A red arrow means sell and a green arrow means buy. for easy identification of trade signal. Are you okay with that?
The indicator cost $500. We release new updates of the indicator every month and the updates are for free once you bought the indicator first time. This indicator was
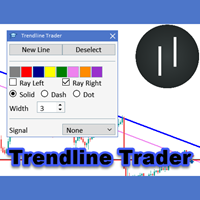
The Trendline Trader EA helps you to analyze and trade the markets with trendlines. You can place and modify lines easily with only few clicks. When you found a strong trend you can also activate the lines to open trades (or place orders) when reached by the price. The tool helps you to analyze multiple markets and still be able to trade trends without sitting in front of the charts all the time. You can change the appearance of the lines. It might be a good idea to choose different colors or si

This indicator is designed for M1 timeframe and shows: Sum of points when the price goes up (Green Histogram). Sum of points when the price goes down (Red Histogram). In other words, by the number and ratio of bullish points to bearish ones, you can do a technical analysis of the state of the market.
If the green histogram prevails over the red one, you can conclude that at the moment the buyers are stronger than the sellers, and vice versa, if the red histogram prevails over the green, the s

---------- A TrendTrading Robot ----------
Hello everyone! I am a professional MQL programmer , Making EAs, Indicators and Trading Tools for my clients all over the world. I build 3-7 programs every week but I seldomly sell any ready-made Robots. Because I am fastidious and good strategy is so few... this EA is the only one so far I think its good enough to be published here.
As we all know, the Ichimoku indicator has become world popular for decades, but still, only few people knows the
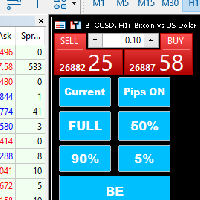
Introducing our MT5 Expert Advisor (EA) with advanced functionality to optimize your trading strategy: Current/All Button: Choose between closing trades on the current chart or all running trades across multiple charts. Enjoy flexibility in managing your positions with a single click. Pips Display Toggle: Easily view or hide your running pips and total pips. Stay informed about your trade progress with real-time updates. Full Close Button: Close all active trades swiftly and efficiently. Streaml

The Session Volume Profile indicator displays the distribution of trade volume across price levels for a specific trading session. It visualizes areas of high and low trading activity, helping traders identify support and resistance zones. The profile's peak, known as the Point of Control (POC), represents the price with the highest traded volume.
The inputs of the indicator:
volumeBars(Row Size) : Determines the number of price bins or rows for the volume profile. A larger number results in

*Non-Repainting Indicator Arrow Indicator with Push Notification based on the Synthethic Savages strategy for synthethic indices on binary broker.
Signals will only fire when the Synthethic Savages Strategy Criteria is met BUT MUST be filtered.
Best Signals on Fresh Alerts after our Savage EMA's Cross. Synthethic Savage Alerts is an indicator that shows entry signals with the trend. A great tool to add to any chart. Best Signals occur on Fresh Alerts after our Savage EMA's Cross + Signal
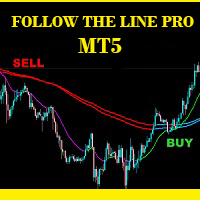
Follow The Line PRO FOLLOW THE LINE (PRO VERSION) This powerful indicator is the full and complete version of my free indicator called "Follow The Line". IT IS BASED ON the popular maxim that: "THE TREND IS YOUR FRIEND" It gives alarms and alerts of all kinds. IT DOES NOT REPAINT and can be used for all currency pairs and timeframes.
AVOID FALSE SIGNALS:
BUY ONLY when price closes above the green line and the green line is above the blue channel.
SELL ONLY when price closes below the pink

This trading panel has been developed for fast and comfortable operation of the financial markets. It is equipped with the necessary functions for manual and semi-automated trading. Due to the presence of the order trailing feature, trailing stop and automatic closure by equity, profit, time. You can use it to automate your trading system. All you have to do is open a position and set the parameters for maintenance, everything else will be handled by the EA. If you want to limit your losses, set
The Expert Advisor allows you to build a trading system based on a custom indicator. It performs automated opening/closing of trades based on the signals of arrow indicators (which buffer values other than 0 and EMPTY_VALUE) or color lines. The EA polls the values of the specified indicator buffers, opens/closes and accompanies trades according to the specified parameters.
The Expert Advisor implements the following trade support functions:
-installation of SL and TP; -calculation of th

Heiken Ashi CE Filtered – Premium Buy/Sell Indicator with Advanced Filtering Introducing the "Heiken Ashi CE Filtered" – a high-quality custom indicator designed for traders seeking precision and clarity in their trading signals. This premium indicator combines the smooth visual simplicity of Heiken Ashi candles with the power of an ATR-based chandelier exit strategy and a zero-lag LSMA filter for highly reliable buy and sell signals. Key Features: Reliable Buy/Sell Signals: The indicator genera

Swing Starter EA
PROMOZIONE LIMITATA : Vogliamo vendere i nostri prodotti ad un prezzo accessibile, in modo che più persone possano beneficiare del loro potenziale. Nessuna urgenza o fretta! Tuttavia, per celebrare il lancio del nostro primo EA, offriamo a tutti uno SCONTO DEL 75%! Cogli questa occasione: - 50$ per le prime 10 COPIE Poi, il PREZZO FINALE sara' 190 $ Sentitevi liberi di contattarmi per qualsiasi dubbio o richiesta di informazione: https://www.mql5.com/en/users/albaneselorenzo/

Definition : VPO is a Volume Price Opportunity. Instead of using bars or candles with an Open, High, Low, and Close price, each "bar" in a Market Profile is represented by horizontal bars against the price It is called Market Profile terminology.
In other words volume-price-opportunity (VPO) profiles are histograms of how many volumes were traded at each price within the span of the profile.
By using a VPO chart, you are able to analyze the amount of trading activity, based on volume, for eac

Copy Trade EA (Expert Advisor) is an automatic trading software that can help investors automatically replicate the trading strategies and operations of other traders, thus obtaining trading results similar to those of other traders. The software is based on the MetaTrader platform and has the characteristics of easy-to-use, efficient, flexible, and adaptive, providing investors with a one-stop solution for automated trading. The software supports multiple trading varieties, including Forex, com

It predicts the most likely short-term price movement based on advanced mathematical calculations.
Features Estimation of immediate price movement; Calculation of the real market trend; Calculation of the most important support and resistance levels; Algorithms optimized for making complex mathematical calculations with a minimal drain of system resources; Self-adjusting for better performance, so it’s able to work properly at any symbol (no matter how exotic it is) and any timeframe; Compatib

The Double Stochastic RSI Indicator is a momentum indicator which is based on the Stochastic Oscillator and the Relative Strength Index (RSI). It is used help traders identify overbought and oversold markets as well as its potential reversal signals. This indicator is an oscillator type of technical indicator which plots a line that oscillates within the range of zero to 100. It also has markers at levels 20 and 80 represented by a dashed line. The area below 20 represents the oversold area, wh

Description
Bitcoin Manager is the best indicator for trading Bitcoin cryptocurrency. It is calculated based on the price deviation from the moving average line channel. Ascending and descending arrows indicate potential points and levels for opening buy and sell positions.
How to use?
We strongly recommend using this indicator on the H1 timeframe. An up arrow indicates a buy level. Down Arrow - Sell Level.
Parameters
Maximum History Bars - maximum count of history bars to calculate

40% off. Original price: $50
ATR Scanner Pro is a multi symbol multi timeframe volatility scanner that monitors and analyzes Average True Range indicator value in up to 28 symbols and 9 timeframes in 3 modes : ATR value: As a volatility dashboard it shows the ATR indicator value in all pairs and timeframes and signals when the ATR value reaches a maximum or minimum in a given duration. Short term ATR/Long term ATR ratio: It shows ratio of 2 ATRs with different periods. It's useful in detec

For those who need a Volume Profile / Market Profile indicator, here is the solution!
It contains the essential information:
Control Point (POC); Higher Value Area (VAH); Lower Value Area (VAL); You can choose to SHOW or NOT SHOW the volume Histogram, according to your wish. If you choose to show the histogram, note that according to the type of asset, it is necessary to adjust the scale of the indicator (last parameter of the indicator).
You can also choose from the data source of your h

Sangkakala Merbabu is a very accurate expert advisor for AUDCAD. This EA is designed with many momentum indicator for entry points.
Please send me inbox after purchase, I will give you Breakout EA for free (promote until 12.12.2024).
Signal Features : MFI Force Index De Marker WPR CCI RSI Stochastic Bollinger Bands
Additional Signal : Moving average PSAR MACD ADX
Recommendations:
Currency pair: AUDCAD Timeframe: M5 Minimum deposit currencies : $500 Account type: Standart, Raw or

The purpose of the Combo OnOff indicator is combine differerent tecniques and approachs to the market in order to spot signals that occur simultaneosly. A signal is more accurate if it is validate from more indicators as the adaptive expectations can be used to predict prices.The On-Off feature and alarms help to look for the better prices to enter/exit in the markets
Moving Averages are statistics that captures the average change in a data series over time
Bollinger Bands is formed by upp

OTTIMIZZA EA PRIMA DEL TEST E DELL'UTILIZZO.
Bitcoin M5 serve per scambiare BTC/USD su grafici a 5 minuti. SL e TP dovrebbero iniziare con 50000. OTTIMIZZARE PRIMA DELL'USO
La strategia di trading utilizza gli indicatori delle bande e degli inviluppi di Bollinger da cui fare trading. Fare trading per cogliere alcuni punti di breakout in cui il prezzo supera le bande e poi uscire quando il prezzo supera i limiti. Ogni operazione utilizza un importo di lotto fisso e dispone di SL e TP. L'EA

A new generation progressive indicator from INFINITY. Predictor PRO uses its own entry and exit calculation strategy. Indicator without redrawing signals! This is very important for real trading.
The indicator can be used for any currency pairs, metals, cryptocurrencies or indices. The best time of the H1 chart.
Unlike other indicators, Predictor PRO shows shows the Buy/Sell entry point and the Close exit point. Calculating the profit of all signals in points on the panel helps to choose th

Grid EA Pro RSI is an professional Grid advisor works according to RSI ( Relative Strength Index ) indicators. And has the function of Reducing the Drawdown on the account by overlapping unprofitable orders. The chart displays information about the profit. Use default setting for GBPUSD, GBPJPY timeframe H1/M5 Recommend ECN broker with LOW SPREAD: IC Market , Exness, NordFX , FXPRIMUS , Alpari , FXTM It good to combo with Buy Sell Signals to follow Trend and Sellect Buy Only/Sell

StartPoint是一个很好的短线交易指示器,这个指标可以单独使用,但是最好是配合 HighQualityMap 一起使用,适用于任何时间框架,喜欢超短线的朋友可以使用M5时间框架。它能很好的体现出短期趋势的启动点,你可以很快的从这个指示器上寻找到最佳的buy和sell位置,同时也能很好根据指示器去坚守自己的持仓定订单。指标不含有未来函数,不会重新绘制,不仅能够应用到自己的手动交易过程中,还能完全可以写入到自己的EA中。(如果你感觉到这个指标能够帮助你进行更准确的交易,请帮忙给个好评,希望我的作品能够帮助更多有需要的人) ===================参数列表===================== 所有参数均采用默认参数即可,无需更改,若为激进型交易者,可以根据自己的需要来调整参数。 =================参考使用方法=================== 此指标可以适用于任何交易品种。

HighQualityMap是一个很好的中长线交易指示器,这个指标可以单独使用,尤其是用在M30或者大于M30的时间框架下,它能很好的体现出趋势的走向,以及转折点,你可以很快的从这个指示器上寻找到最佳的buy和sell位置,同时也能很好根据指示器去坚守自己的持仓定订单。指标不含有未来函数,不会重新绘制,不仅能够应用到自己的手动交易过程中,还能完全可以写入到自己的EA中。(如果你感觉到这个指标能够帮助你进行更准确的交易,请帮忙给个好评,希望我的作品能够帮助更多有需要的人) ===================参数列表===================== 所有参数均采用默认参数即可,无需更改,若为激进型交易者,可以根据自己的需要来调整参数。 =================参考使用方法=================== 此指标可以适用于任何交易品种,使用周期框架大于M30相对更准确。
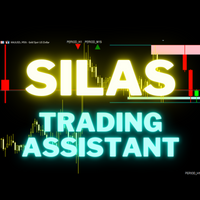
Silas is a trading assistant for multi-timeframes traders. It show on the screen, in a very clear way, all the informations needed to suits to your trading. It show : - Supply and demand zone from 2 timeframes of your choice - Setups based of market structure from 2 timeframes of your choice - Daily current high and low points - The last 2 closed candles and the current candle from an higher time frame on the right of the graph. - Actual daily candle on the left Everything is customisable !

Master Gold Scalper EA is an EA combo 4 strategy:
STRATEGY_1: STOCH+MA This is a simple Forex Scalping strategy using the EMA200 and Stochastic indicators to trade buying or selling together.
STRATEGY_2: 2MA+STOCH This is a scalping system dedicated to Gold, which combines two indicators: Stochastic indicators and 2MA with the aim of finding entry points according to current trends.
STRATEGY_3: MACD Scalping strategy using trendlines and MACD indicators
STRATEGY_4: WPR Indicator: Wi

The Market Structure Analyzer is a powerful tool designed for traders who follow market structure and smart money concepts. This comprehensive indicator provides a suite of features to assist in identifying key market levels, potential entry points, and areas of liquidity. Here's what it offers:
1. Swing High/Low Detection : Accurately identifies and marks swing highs and lows, providing a clear view of market structure.
2. Dynamic Supply and Demand Zones: Draws precise supply and demand zo

Line function : Displays the opening line, Stop Loss, Take Profit( 3:1 RR ) on the chart. Risk management : The risk calculation function calculates the volume of a new order taking into account the established risk and the size you want to risk. It allows you to set any Stop Loss size between 3 and 10 pips. Breakeven Button : Brings all open orders to Breakeven. Clear button : Clears the graph and the selected parameters. Trade Button : Execute the idea. Partials Button : Taking partials of al

[ MT4 Version ] [ Discord Signals ] MT5 to Telegram Signals
Connect your broker account with Telegram and stop missing important notifications. Would you like to receive Telegram notifications? Are you looking for a simple way to share trade signals with your followers? Do you need to start documenting your trades with an automated trading diary? Check out this step-by-step Tutorial . This utility is simple to use and supports a wide variety of settings: Pick your desired Telegram group

Mr. Averager MT5 is a Expert Advisor for the MetaTrader 5 trading terminal. The trading algorithm is based on the principle of position averaging. Due to averaging, the EA is not sensitive to the quality of entry points and can work almost at any time and in almost any market. The EA supports 2 trading modes: Automatic start and Manual start. In Automatic start mode, the EA independently starts a new series of orders. In Manual start mode, the first order of the series is opened manually using

The indicator displays a matrix of indicators across multiple timeframes with a sum total and optional alert. Custom indicators can also be added to the matrix, in a highly configurable way. The alert threshold can be set to say what percentage of indicators need to be in agreement for an alert to happen. The alerts can turned on/off via on chart tick boxes and can be set to notify to mobile or sent to email, in addition to pop-up. The product offers a great way to create an alert when multiple

PLEASE CONTACT ME BEFORE PURCHASE FOR DISCOUNT UP TO 50% Key Features:
Full Range Breakout Strategy: The EA continuously monitors price movements and identifies breakout points based on predefined high and low ranges. When the price moves beyond these levels, the EA automatically opens trades, positioning itself to take advantage of potential price trends. Trailing Stop Loss: To enhance risk management and protect profits, the EA includes a trailing stop loss feature. This functionality allow
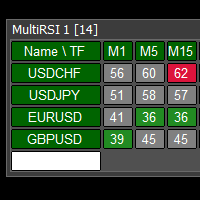
This tool monitors RSI indicators on all time frames in the selected markets. Displays a table with signals to open a BUY trade (green) or SELL trade (red). You can set the conditions for the signal. You can easily add or delete market names / symbols. If the conditions for opening a trade on multiple time frames are met, you can be notified by e-mail or phone message (according to the settings in MT5 menu Tools - Options…) You can also set the conditions for sending notifications. The list of s

This tool monitors MACD indicators on all time frames in the selected markets. Displays a table with signals to open a BUY trade (green) or SELL trade (red). You can set the conditions for the signal. You can easily add or delete market names / symbols. If the conditions for opening a trade on multiple time frames are met, you can be notified by e-mail or phone message (according to the settings in MT5 menu Tools - Options…) You can also set the conditions for sending notifications. The list of
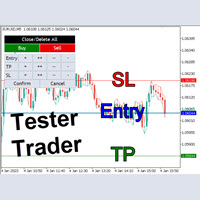
The Tester Trader EA is designed to simulate your manual trading strategy in the strategy tester. By default this is not possible and manual trading is completely disabled in the MT5 strategy tester. This tool helps you to open, manage and close orders and positions easily using action buttons in the chart. Forward testing your manual trading strategy can be a real pain. Time moves slow and it can take days or months to fully test a manual trading strategy. With this tool you can simulate forwar

Indicatore finanziario SolarTrade Suite: Indicatore del mercato del mercurio: la tua guida affidabile nel mondo dei mercati finanziari! Il nostro programma di trading Forex è dotato di un'intelligenza artificiale potente che analizza i dati di mercato in tempo reale. Prevede con precisione i movimenti dei prezzi, aiutando i trader a prendere decisioni informate. Con algoritmi avanzati, il nostro indicatore ottimizza le strategie e minimizza i rischi. È una media mobile che utilizza speciali alg

Indicatore di tendenza della volatilità dell'indice.
Caratteristiche principali:
Viene utilizzato solo per gli indici sintetici nel broker binario o derivato, che sono gli stessi. Ha un filtro di tendenza. Ha un avviso sonoro per avvisare di un possibile calo dei prezzi. Può inviarti avvisi mobili se lo metti su un VPS. È configurato con l'algoritmo L566b12 progettato per una migliore efficienza.
Come utilizzare l'indicatore
Funziona nella temporalità di M1. La tendenza

Lazy Scalper is fully automated, it is built based on the break-out strategy by calculate the signal from the ZigZag Indicator (strategy 01) or Fractal Indicator (strategy 02). This EA does not use any martingale or grid functions and follows a logical concept and it is suitable for both beginners and experienced people. The Backtests shown in the screenshots were done with default settings. It may not be the best or the worst. Please download the free demo to experience your own. su

This is an indicator of trading sessions that can display all levels (Open-High-Low-Close) for four sessions . The indicator can also predict session levels. Sessions can be drawn with lines or rectangles (empty or filled), lines can be extended to the next session. You can easily hide/show each session by pressing hotkeys (by default '1', '2', '3', '4'). You can see ASR (Average Session Range) lines (default hotkey 'A'). This is similar to the ADR calculation, only it is calculated based on

Certainly. Here's the explanation in English: This program is a custom indicator that calculates the MACD (Moving Average Convergence Divergence) and shows the crossovers between the MACD and Signal lines. Here are the main functions of the program: MACD Calculation: Calculates the difference between the Fast EMA (Exponential Moving Average) and Slow EMA. This difference forms the MACD line. Signal Line Calculation: Creates the Signal line by taking a simple moving average (SMA) of the MACD valu

Indicator Description: FVG Imbalance Zones The FVG Imbalance Zones indicator is a powerful tool designed to identify potential price imbalances on financial charts. Developed by Pierre-Alexis Blond, this innovative indicator marks regions where significant price shifts may occur, offering traders valuable insights into potential market turning points. Key Features: Imbalance Detection: FVG Imbalance Zones identifies potential price imbalances in the market, pinpointing areas where supply and d

This algorithm is based on the grid strategy and performs dynamic position management to make it work on netting accounts. Unlike other robots, this grid system bases its entries on profit over time of the asset instead of using pips. This parameter is the one that corresponds to "Average Distance".
You can trade all 28 major currencies simultaneously. Parameters: +------------------------------------------------------------------+ :-:-:-:-:-:-:-:EXPERT SETTINGS:-:-:-:-:-:-:-: +--------------

SuperMax MT5 is a fully automated, intelligent expert advisor with advanced mechanisms, using a dynamic system to measure market volatility to be consistent with the timing of market entry and exit. The mechanism of this system is based on the principle of mean reversion and momentum of market price. Rely on scalping and recovery strategies with optimal trading frequency and can still work well in all market conditions, be it trend or sideways, can be traded full time in any condition. This EA

This indicator can identify more than 60 candlestick patterns on the chart, including their bullish and bearish variants. Just choose the pattern you want in the settings.
Available Patterns 2 Crows Gravestone Doji On Neck 3 Black Crows Hammer Piercing 3 Inside Hanging Man Rick Shawman 3 Line Strike Harami Rising and Falling Three Method 3 Outside Harami Cross Separating Lines 3 Stars in South High Wave Shooting Star 3 White Soldiers Hikkake Short Line Abandoned Baby Hikkake Modified Spinning
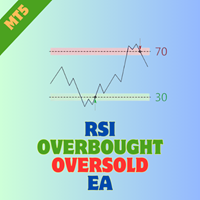
RSI Trader Expert Advisor for MetaTrader 5 Introduction: Welcome to the RSI Trader EA, an advanced tool designed exclusively for MetaTrader 5. This expert advisor streamlines trading activities by harnessing the power of the Relative Strength Index (RSI) indicator, automating trade entries and exits based on overbought and oversold conditions. The EA also facilitates reverse trading setups within these zones, offering a versatile approach to managing trades. You can find MT4 version here For det

Indicatore finanziario SolarTrade Suite: Indicatore di mercato di Plutone: la tua guida affidabile nel mondo dei mercati finanziari!
È un oscillatore di volatilità che utilizza speciali algoritmi innovativi e avanzati per calcolarne il valore e ha anche un design gradevole.
È molto semplice comprendere le letture di questo indicatore: colore verde - bassa volatilità e momento migliore per aprire un'operazione commerciale, colore arancione - alta volatilità e tempo per pensare a chiudere una

Questo indicatore traccia in modo efficiente qualsiasi altra candela temporale che desideri monitorare sullo stesso grafico
1. Seleziona un intervallo di tempo superiore per caricare le barre sullo stesso grafico
2. Personalizza i colori e lo stile dei candelieri
3. Scegli il numero di barre per disegnare candelieri
4. Tieni traccia delle candele complete con un intervallo di tempo più lungo insieme allo stoppino e al corpo
5. Facile e conveniente per coloro che non vogliono cambi

L'indicatore viene utilizzato per il trading di boom e crash, è un super detective delle tendenze. Quando il mercato è in tendenza al rialzo, utilizza il segnale forte per catturare il picco, quando è in tendenza al ribasso usa il segnale regolare per rilevare più picchi.
L'indicatore è basato sull'azione dei prezzi in natura con alcune logiche matematiche. È utilizzato solo per la cattura di punte.
L'indicatore possiede il seguente output
1. Segnale forte
2. Segnale regolare
3. Avvis

MULTI TIME FRAME MEDIA MOBILE OSW
(METATRADER 5)
Questo indicatore ti permetterà di aggiungere medie mobili di tutti i tipi di configurazione, con la differenza che se sei in un timeframe puoi aggiungere quella di livello superiore, per fare un esempio, se sei in un timeframe di 5 minuti e vuoi vedere l'esponenziale della media mobile di 20 della temporalità di 15 minuti, 1 ora e 4 ore, solo configurando i parametri corretti nel menu dell'indicatore potrai vederli come mostrato nelle immagi
Il MetaTrader Market è un sito semplice e pratico dove gli sviluppatori possono vendere le loro applicazioni di trading.
Ti aiuteremo a pubblicare il tuo prodotto e ti spiegheremo come prepararne la descrizione per il Market. Tutte le applicazioni sul Market sono protette da crittografia e possono essere eseguite solo sul computer dell'acquirente. La copia illegale è impossibile.
Ti stai perdendo delle opportunità di trading:
- App di trading gratuite
- Oltre 8.000 segnali per il copy trading
- Notizie economiche per esplorare i mercati finanziari
Registrazione
Accedi
Se non hai un account, registrati
Consenti l'uso dei cookie per accedere al sito MQL5.com.
Abilita le impostazioni necessarie nel browser, altrimenti non sarà possibile accedere.