Guarda i video tutorial del Market su YouTube
Come acquistare un Robot di Trading o un indicatore
Esegui il tuo EA
hosting virtuale
hosting virtuale
Prova un indicatore/robot di trading prima di acquistarlo
Vuoi guadagnare nel Market?
Come presentare un prodotto per venderlo con successo
Expert Advisors e Indicatori per MetaTrader 5 - 81

HAshi-E è un modo migliorato di analizzare i segnali Heiken-Ashi.
Briefing:
L'Heiken-Ashi è particolarmente apprezzato per la sua capacità di filtrare la volatilità a breve termine, che lo rende uno strumento privilegiato per identificare e seguire le tendenze, aiuta a prendere decisioni sui punti di entrata e di uscita e aiuta a distinguere tra falsi segnali e vere inversioni di tendenza. A differenza dei tradizionali grafici a candele, le candele Heiken-Ashi sono calcolate utilizzando i v
A very simple position sizing calculator to help traders calculate the right lot size per trade. It also places the order with one click. All inputs can be edited. So if you want to change the SL or TP or the lot size, you can do so before placing an order. The inputs are the following: SL - stop loss in pips (not points). set to 0 before placing an order to not add SL. TP - take profit in pips (not points). set to 0 before placing an order to not add TP. RISK - dollar amount to risk. i

Compared to simple or exponential moving averages, slow adaptive trend lines might offer a more nuanced view of the trend by adjusting their sensitivity based on market conditions. However, their slow nature might also mean they are late in signaling reversals when market conditions change rapidly - and that is the difference between them and our SlowAMA .
SlowAMA was designed to be a better long-term trend indicator than EMA and other Moving Averages. It uses our JurMA calculations, reducing

The Dragonfly Doji candlestick pattern is formed by one single candle. Here’s how to identify the Dragonfly Doji candlestick pattern: The candle has no body The wick at the bottom must be big At the top, it should have no wick, or be very small This 1-candle bullish candlestick pattern is a reversal pattern, meaning that it’s used to find bottoms. For this reason, we want to see this pattern after a move to the downside, showing that bulls are starting to take control. When a Dragonfly Doji cand

The Bullish Counterattack Line candlestick pattern is formed by two candles. Here’s how to identify the Bullish Counterattack candlestick pattern: The first candle is bearish and big The second candle is bullish and small There’s a gap between the close of the first candle and the open of the second candle They both close at the same level This 2-candle bullish candlestick pattern is a reversal pattern, meaning that it’s used to find bottoms. For this reason, we want to see this pattern after a

The Three Outside Up candlestick pattern is formed by three candles. Here’s how to identify the Three Outside Up candlestick pattern: The first candle is bearish and small The second candle is bullish and engulfs the first one completely The third candle is bullish and closes above the other ones This 3-candle bullish candlestick pattern is a reversal pattern, meaning that it’s used to find bottoms. For this reason, we want to see this pattern after a move to the downside, showing that bulls are

The Tweezer Bottom candlestick pattern is formed by two candles. Here’s how to identify the Tweezer Bottom candlestick pattern: The first candle is bearish The second candle is bullish The lows from both candles should be pretty much at the same level This 2-candle bullish candlestick pattern is a reversal pattern, meaning that it’s used to find bottoms. For this reason, we want to see this pattern after a move to the downside, showing that bulls are starting to take control. When a Tweezer Bott

The Bullish Harami candlestick pattern is formed by two candles. Here’s how to identify the Bullish Harami candlestick pattern: The first candle must be bearish and have a big body The second candle must be small and bullish The second candle is inside the body of the first candle This 2-candle bullish candlestick pattern is a reversal pattern, meaning that it’s used to find bottoms. For this reason, we want to see this pattern after a move to the downside, showing that bulls are starting to
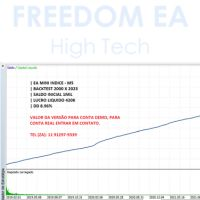
Looking to boost your financial market results?
The EA Mini Index is the answer. Tested and enhanced since 2000, this expert advisor offers operations on the M5 chart, with an initial balance of R$ 1,000 and an impressive net profit of R$ 420,000 until 2023, maintaining a drawdown of only 8.96%.
Seize this unique opportunity to increase your profitability and operate more effectively.

Currency Strength Dynamic La forza valutaria dinamica è un indicatore della forza valutaria. La forza valutaria si riferisce alla direzione del trend della maggior parte o di tutte le coppie valutarie di cui una valuta fa parte.
L'indicatore si basa sulla lettura della differenza tra le medie mobili, simile all'indicatore MACD, sulle 28 coppie di valute più popolari: maggiori e minori.
Vantaggi Metodo di calcolo oscillatorio unico Disponibilità di pulsanti per disabilitare o abilitare linee

Market Cycle and Trading Sessions Indicator
Introducing our Market Cycle and Trading Sessions Indicator, a tool designed to provide you with a comprehensive view of the financial market like never before. Observe the market's pulse with our exclusive indicator. Gain a deep understanding of market phases, from accumulation to distribution, to make informed, strategic decisions with a high probability.
What makes our indicator?
1. Date Range for Calculations: Customize the start and end da
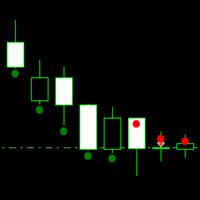
Simple EA with an self-made indicator and Grid. The Expertadvisor opens positions when the market behavior changed from bullish to bearish or vice versa. To determine the market behavior the indicator simply measures how many points it has moved up and down for the last X candles.
It then uses a simple grid strategy if the position turns into a loss. Grid levels can be defined specific to the market.
It depends on your personal preferences and the respective market which parameters should be
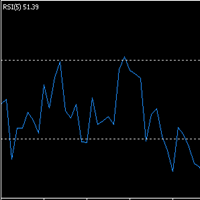
Simple EA with two indicators (SMA + RSI) and Grid. The Expertadvisor opens positions in the direction of the trend when the RSI line turns above 80 or below 20. It then uses a simple grid strategy if the position turns into a loss. Grid levels can be defined specific to the market.
It depends on your personal preferences and the respective market which parameters should be set and how. You have to test it yourself. The EA is programmed in such a way that optimization runs consume little time.
Prop Drawdown Manager is a sophisticated utility tool designed to assist traders in effectively managing and minimizing the impact of drawdowns within their forex trading accounts. Drawdowns, which represent the reduction in capital from peak to trough, are an inevitable aspect of trading, but they can be detrimental if not managed properly. This utility provides traders with a suite of features aimed at controlling drawdowns and preserving trading capital: 1. Drawdown Thresholds : Traders can

Description of work
The 'MA7 Agave' indicator is based on the standard Average Directional Movement Index (ADX) indicator. Shows the intersection of the +DI and -DI lines. Detailed information about the 'MA7 Agave' indicator.
Indicator settings
General settings: ADX period - Average Directional Movement Index indicator period.
'MA7 Flax' settings: ATR period – Average True Range indicator period, (0 – not used); ATR multiplier – Average True Range indicator value multiplier, coeff; Remove

The underlying strategy of this indicator is based on identifying momentum in the market and attempting to capture the direction of the trend through transitions between bullish and bearish moments. Utilizing bands around the RWMA allows for identifying potential overbought and oversold situations in the market.
1. Calculation of the Range Momentum Index (RMI): The RMI is based on a combination of the Relative Strength Index (RSI) and the Money Flow Index (MFI), both of which are momentum ind

Exclusive FOREX account HEDGE FuzzyLogicTrendEA is based on fuzzy logic strategy based on analysis 5 indicators and filters.
When the EA analysis all this indicators, it decides, based on its fuzzy strategy, which trade will be better: sell or buy.
As additional functions, it´s possible defines spread maximum, stop loss and others.
Recomm. Symbol: EURUSD, AUDUSD, GBPUSD, NZDUSD, USDCAD, AUDCAD, EURCAD e USDJPY
Recomm. timeframe: H1.
Backtest were done on EURUSD, H1, 01/07/2023 - 26/0

Questo prodotto è progettato per visualizzare le sessioni di trading di 15 paesi in base al fuso orario del server del tuo broker e varie modalità di visualizzazione in base alle impostazioni desiderate per evitare la congestione del grafico e la possibilità di impostare una sessione con l'orario desiderato dall'utente.
Il sole non tramonta mai sul mercato Forex, ma il suo ritmo balla al ritmo di sessioni di trading distinte. Comprendere queste sessioni, le loro sovrapposizioni e le loro atmo
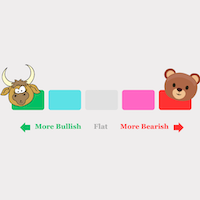
By using (MOMENTUM and VELOCITY and ACCELLERATION) and the power of machine learning we can accurately calculate the current strength of the currencies of each time frame. - It's really easy to use: Choosing to trade between currency pairs that have clear and dominant trends will give you a great advantage. -The currency pair strength meter is rated from -100 to + 100

Introducing the True Currency Strength Indicator - Your Ultimate Guide to Market Mastery! Are you tired of guesswork when it comes to trading? Ready to elevate your trading strategy to a whole new level? Look no further! We present to you the True Currency Strength Indicator - the game-changer in the world of Forex trading. Unleash the Power of Multi-Currency Analysis: Gain a competitive edge with our revolutionary indicator that goes beyond traditional single-currency analysis. The Tru
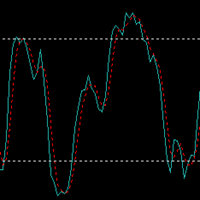
Simple EA with two indicators (SMA + STOCHASTIC) and Grid. The Expertadvisor opens positions in the direction of the trend when the lines of the Stochastic indicator intersect in the swing high or swing low area. It then uses a simple grid strategy if the position turns into a loss. Grid levels can be defined specific to the market.
It depends on your personal preferences and the respective market which parameters should be set and how. You have to test it yourself. The EA is programmed in suc
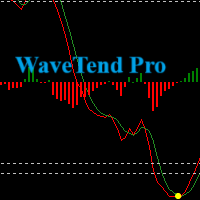
Introducing our Wave Trend Oscillator Indicator , exclusively designed for MetaTrader 5 . This advanced tool is a must-have for traders who seek precision and efficiency in their trading journey. Our oscillator is built on the principles of wave trend analysis , capturing the ebb and flow of market trends with unparalleled accuracy. It helps traders identify potential buying and selling points based on market wave patterns, enabling you to stay ahead of the market. One of the key features of ou

Uncover high-probability opportunities in trending markets with the Brilliant Entries Indicator. Its clear visual signals can be followed and incorporated with market structure to provide you with accurate entries. Give it a try and gain an edge in your trading strategy.
It can be used on it's own but i highly recommend to used it as part of a wider strategy to provide you with confluence.
It works on all timeframes but will work very good doing market structure 2 x timeframes higher and t

In the realm of technical analysis, ParbMA emerges as a highly intuitive tool for examining the Parabolic SAR trend . This innovative approach leverages a customizable line, distinguished by its versatility in color, shape, and width options. Such flexibility enhances visual analysis and significantly aids in strategizing and decision-making.
The ParbMA (Parabolic Moving Average) is a custom technical indicator that combines the concepts of J. Welles Wilder's Parabolic SAR (Stop and Reverse)

Limited Time Offer! Only $ 150 USD ! The price will increase by $100 USD after every 10th purchase ! Final price: $ 15 000 USD DESCRIPTION : Attention! Contact me immediately after purchase to receive setup instructions!
The Expert Advisor (EA) is designed for capital distribution. We have made every effort to ensure that the minimum deposit is $100 USD.
This advisor is intended for trading with the broker Deriv. The EA has been optimized over the past year, starting

L'On-Balance Volume (OBV) è un indicatore tecnico che mette in relazione volume e prezzo per identificare i movimenti di prezzo. L'idea di base dell'OBV è che le variazioni di volume generalmente precedono le variazioni di prezzo. L'indicatore accumula i volumi per i periodi in cui il prezzo chiude in rialzo e sottrae i volumi per i periodi in cui il prezzo chiude in ribasso. Il risultato è un valore utilizzato per identificare la direzione del trend dell'asset.
L'interpretazione dell'OBV è s

Designed by Welles Wilder for daily commodity charts, the ADXW is now used in various markets by technical traders to assess the strength of a trend or even a trend for short- or long-term trades.
The ADXW uses a positive (DI+) and negative (DI-) directional indicator in addition to its trend line (ADX).
According to Wilder, a trend has strength when the ADX signal is above 25; the trend is weak (or the price has no trend) when the ADX is below 20. The absence of a trend does not mean that

The Adaptive Market Navigator(AMN) EA is an automated trend-based trading advisor combining the advantages of ATR, Bears Power and Moving Average indicators. The used strategy is well suited for both beginners and experienced traders.
The minimum deposit is $100 for a 1:100 leverage.
I recommend to use a 1:100 ECN account with a low spread and a fast VPS.
Optimized for EURUSD pair on 1H timeframe.
Due to the simplicity and convenience of this EA every user can give it a try and choose t

Position Manager serves as an expert advisor (EA) designed to enhance your trading experience by providing a user-friendly panel for intuitive management of your positions. This tool empowers you with a seamless interface, allowing for efficient handling of trades and improved control over your trading positions. The primary objective of Position Manager is to simplify and streamline the management of your positions, enabling you to make informed decisions with ease. Through its intuitive design

Nuker shows a practical functionality by examining the length of the preceding candle and taking action when it exceeds a predetermined threshold. By considering the historical context of candle lengths, Nuker response to candle length variations. Backtest was perform using in sample data from 2012 until 2019 and out of sample from 2020 to the middle of 2023. As you can see in the picture below, the results are fantastic in the last 3 years. It is live since August 2023, also providing an excele

CoinHarbor uses a seasonal pattern for the purchase and sale of Bitcoin . The primary aim of this strategy is to minimizing drawdown (DD). It's important to note that this approach is uniquely applicable solely to Bitcoin transactions, demonstrating a clear advantage in this specific asset. In essence, the strategy is structured to ensure a thoughtful balance between risk mitigation and profit optimization in the context of Bitcoin's distinct characteristics. The only configuration required is

Unlock the Precision of Market Movements with OrderBlock Precision Trader
Welcome to the future of trading, where precision meets profitability. OrderBlock Precision Trader is not just an expert advisor; it's your personal trading ally designed to elevate your strategies and optimize your results. Packed with advanced features and a comprehensive trading approach, this EA opens the door to a new era of trading excellence.
Are you ready to elevate your trading game and gain an edge in the fin
****** PRESENTIAMO L'EA CBAlgoGrid MT5 ******* conto live CBAlgoGrid + CBAlgoNews operativo dal 23/01/2024
L'EA CBAlgoGrid rappresenta un sofisticato sistema automatico progettato per operare nel mercato del Forex,
capitalizzando sui movimenti giornalieri e in particolare durante le fasi di consolidamento.
Le operazioni vengono attivate in risposta a specifici pattern identificati attraverso l'analisi degli indicatori tecnici come ADX, Media Mobile e RSI.
Con una gestione avanzata de

Smart Manager Dashboard - with auto virtual TP and auto virtual SL for all trades. [Converted from MT4 version - All screenshots are from MT4]
-this EA is a powerful trade manager that can manage all symbols and all trades at once , all from one chart so it is a must have tool for every trader who keeps more trades at once. -it mainly does 2 things : INFO ABOUT TRADES and CLOSING TRADES (grouped by their symbol, so with this tool it is very easy and fast to manage even hundred

The White Marubozu candlestick pattern is formed by one single candle. Here’s how to identify the White Marubozu candlestick pattern: One single bullish candle The body must be big The wicks should be small or non-existent This 1-candle bullish candlestick pattern is a reversal pattern, meaning that it’s used to find bottoms. For this reason, we want to see this pattern after a move to the downside, showing that bulls are starting to take control. When a White Marubozu candlestick pattern ap

The Three White Soldiers candlestick pattern is formed by three candles. Here’s how to identify the Three White Soldiers candlestick pattern: Three consecutive bullish candles The bodies should be big The wicks should be small or non-existent This 3-candle bullish candlestick pattern is a reversal pattern, meaning that it’s used to find bottoms. For this reason, we want to see this pattern after a move to the downside, showing that bulls are starting to take control. When a Three White Soldi

The Three Inside Up candlestick pattern is formed by three candles. Here’s how to identify the Three Inside Up candlestick pattern: The first candle must be bearish The second candle must be bullish The close of the second candle should ideally be above the 50% level of the body of the first one The third candle should close above the first one This 3-candle bullish candlestick pattern is a reversal pattern, meaning that it’s used to find bottoms. For this reason, we want to see this pattern

The Morning Star candlestick pattern is formed by three candles. Here’s how to identify the Morning Star candlestick pattern: The first candle must be bearish The third candle must be bullish The second candle must be small compared to the others, like a Doji or a Spinning Top The color of the second candle doesn’t matter Ideally, the body of the second candle shouldn’t overlap with the bodies of the other two candles This 3-candle bullish candlestick pattern is a reversal pattern, meaning t

IL Modello di candelabro penetrante è formato da due candele. Ecco come identificare il modello di candela penetrante: La prima candela deve essere ribassista La seconda candela deve essere rialzista Il livello di apertura della seconda candela deve essere inferiore alla prima candela (c'è un gap lì) La chiusura della seconda candela deve essere superiore al livello del 50% del corpo della prima candela Questo modello di candela rialzista a 2 candele è un modello di inversione, il ch
" Base Market Signals " A powerful and innovative technical analysis indicator designed to revolutionize your trading experience. Engineered by Southern Star Trading, this indicator is your key to unlocking profitable market insights in the ever-changing world of financial markets.
Key Features:
1. Dynamic Signal Detection: Base Market Signals employs sophisticated algorithms to dynamically identify potential trend reversal points, providing you with timely and accurate signals.
2. Versat

A simple and reliable advisor for Gold XAUUSD . MT5 Can be set to any timeframe. The advisor uses several features of Gold trading: - when the strategy is simpler, the more reliable it is; - the best deals on Gold are made only in Buy; - the best deals on Gold are made only on Fridays.
Trading is carried out only with a fixed lot. The advisor will be an excellent addition to your trading portfolio strategies.
The advisor can withstand large slippages and large spread widening, whi

Flat è una utility pensata per chi ama operare con take profit e stop loss virtuali ed ordini di copertura come sistema di protezione del capitale, ma a volte ad esempio la notte non è possibile operare quindi si è costretti ad intervenire nel momento e nel modo sbagliato Facciamo un esempio, dopo aver ricevuto un segnale ti posizioni sul mercato con una posizione Long ma il mercato a bassi volumi e comprendi che il tuo posizionamento è valido ma bisogna attendere più di quanto pensavi fosse ne

Простой индикатор тренда в NRTR виде с отрисовкой линий стоплосса и тейпрофита, цвет и направление движения которых определяются действующим трендом. Индикатор имеет возможность подавать алерты, отправлять почтовые сообщения и push-сигналы при смене направления тренда. Следует учесть что значение входного параметра индикатора Deviation of the take profit line in points для каждого финансового актива на каждом таймфрейме необходимо подбирать индивидуально!
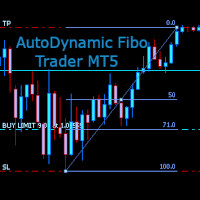
AutoDynamic Fibo Trader is a simple utility that allows the user to place a buy or sell limit or order based on the last fibonacci object drawn on the chart. This is to help the user to significantly reduce the amount of time the user takes to place a trade. All you need to do is draw a fib object with the low and high levels of where you want your stop loss and take profit to be, and decide where an entry level should be by specifying a fibo percentage level. The utility will automatically r

DeepX Black Edition Expert Advisor is a cutting-edge trading tool meticulously designed for traders seeking a robust and low-risk strategy. Leveraging the power of candlestick patterns, this specialist excels in trend detection, ensuring timely market entry and exit points. With a predefined profit limit and loss limit, the expert advisor prioritizes risk management, providing users with a secure trading environment. Optimized for the H4 time frame, this expert aligns with traders who prefer a b

Holeshot MT5 is a highly effective reversion trading system that leverages the power of momentum, and custom trend indicators to detect high-probability trading opportunities U-Turn areas to exploit. When demoing the system use this link below to get sample set files for your account size:
Holeshot MT5 Demo Set Files
Launch Sales The Launch Sale is $250, the first 10 believers in this product would receive this outstanding EA at our launch price. ***Buy Holeshot MT5 and you could get the P

I'm proudly introducing "Spread Eliminator" - Your Ultimate Solution against High Spreads in Forex Trading! Are you tired of hitting Stop Losses or having pending orders triggered at a bad price due to high spreads while trading? All this is now over with our revolutionary EA , Spread Eliminator! Can be used on Prop Firms that enforce high overnight spreads and/or high spreads during high volatile market conditions. Key Features: Smart Spread Monitoring: Spread Eliminator constantly monitors mar

A simple script to remove all indicators from the current chart/ all charts.
How to use: Simply double-click the script, choose either delete all indicators from this chart or all charts, and all is set.
Terminate once perform the deletion, so don't worry about constantly deleting your setup indicator.
Thanks for purchasing, wish you happy trading, thanks!

Introducing AI Precision Trader: Unleash the Power of AI for Optimal Trading Performance!
Embark on a revolutionary trading journey with AI Precision Trader, an Expert Advisor (EA) that stands at the forefront of innovation. Meticulously designed with cutting-edge Artificial Intelligence (AI) technologies, this EA redefines precision and profitability in algorithmic trading.
Optimized Risk Management:
Experience a new level of confidence with AI Precision Trader's advanced risk manage

HAshi-E è un modo migliorato di analizzare i segnali Heiken-Ashi.
Briefing:
L'Heiken-Ashi è particolarmente apprezzato per la sua capacità di filtrare la volatilità a breve termine, che lo rende uno strumento privilegiato per identificare e seguire le tendenze, aiuta a prendere decisioni sui punti di entrata e di uscita e aiuta a distinguere tra falsi segnali e vere inversioni di tendenza. A differenza dei tradizionali grafici a candele, le candele Heiken-Ashi sono calcolate utilizzando i v

The Bearish Engulfing candlestick, a potent signal in technical analysis, marks a potential shift in market sentiment. This compelling pattern unfolds when a smaller bullish candle is completely overshadowed by a larger bearish candle. The Bearish Engulfing signifies a transition from bullish to bearish momentum, capturing the attention of traders anticipating a downtrend. Savvy investors leverage this pattern to identify potential selling opportunities, signaling a shift towards bearish market

Profit X invia notifiche sul tuo dispositivo mobile mantenendoti aggiornato sul profitto dei tuoi investimenti anche nei momenti in cui non puoi fisicamente controllare i mercati, ad esempio quando sei alla guida, sul posto di lavoro, in una riunione o con amici, con parenti e non puoi distrarti Può essere disattivata e attivata ed è possibile scegliere la frequenza del aggiornamenti in minuti, ore, giorni, settimanale o mensile La configurazione e personalizzazione è molto semplice, di default

**MT5** Elevate your risk management game with Equity Savior, the go-to Expert Advisor designed to safeguard your equity during prop firm challenges. This powerful yet user-friendly tool lets you choose your preferred trading session, set a maximum lot size, and establish a daily trade limit effortlessly. Key Features: Session Selection: Tailor your trading approach by selecting specific sessions, aligning with your strategy and prop firm challenge requirements. Max Lot Size Control: Take co

Elevate your trading experience with Dynamic Trader EA MT5 , a cutting-edge trading robot designed to optimize your investment strategy. This advanced algorithm harnesses the power of four key indicators: RSI ( Relative Strength Index ), Stochastic Oscillator , MACD ( Moving Average Convergence Divergence ) and ATR ( Average True Range ) to make informed and precise trading decisions. ATR is used to dynamically set stop-loss and take-profit levels based on market volatility. IMPORTANT!
Read

IL Modello di candelabro rialzista Engulfing è formato da due candele. Ecco come identificare il modello di candele Bullish Engulfing: La prima candela deve essere ribassista La seconda candela deve essere rialzista Il corpo della seconda candela deve coprire il corpo della prima candela Questo modello di candela rialzista a 2 candele è un modello di inversione, il che significa che viene utilizzato per trovare i fondi. Per questo motivo, vogliamo vedere questo modello dopo un movime

Il modello a candela Hammer è formato da una singola candela. Ecco come identificare il modello della candela Hammer: La candela ha un corpo piccolo Lo stoppino nella parte inferiore deve essere grande rispetto al corpo Nella parte superiore non dovrebbe avere stoppino o essere molto piccolo Il colore del corpo non ha importanza Questo modello di candela rialzista a 1 candela è un modello di inversione, il che significa che viene utilizzato per trovare i fondi. Per questo motivo, vogliamo veder

The Hanging Man candlestick, a significant player in technical analysis, provides a crucial signal for potential trend reversals in financial markets. Characterized by its small real body, long lower shadow, and minimal upper shadow, the Hanging Man hints at a shift from bullish to bearish momentum. Savvy traders use this pattern to identify potential selling opportunities, suggesting a possible weakening of an uptrend. Dive into the intricacies of the Hanging Man candlestick to refine your mark

Master Nasdaq FTMO MT5 is a very accurate expert advisor for Nasdaq/ US100/ USTEC/ NAS100/ NDX index. This EA is designed with MACD divergence, RSI divergence, RSI, Moving Average, and other secret indicator/ method for entry position. This EA is a single entry method use stop loss and take profit with ATR.
Please send me inbox after purchase, I will give you Breakout EA for free (promote until 12.12.2024).
This EA has been rigorously tested at several backtest levels, but past results d

TrendOnClose è un sofisticato indicatore progettato per gli investitori del mercato binario, incentrato sull'analisi statistica delle tendenze e delle controtendenze all'interno di specifici cicli di candele.
Ogni ciclo è definito dal prezzo di chiusura della candela, che stabilisce la direzione della tendenza (SU/GIU' - TORO/BORSO) per le successive analisi statistiche fino all'inizio del ciclo successivo. L'analisi statistica opera con due configurazioni:
⦁ Obiettivo statistico come CANDE

Il Jurik Advanced MA (JurMA) è un indicatore tecnico non grafico sviluppato sulla base del JMA originale ideato da Mark Jurik. È stato progettato per ridurre il ritardo presente nelle medie mobili tradizionali, migliorare la scorrevolezza e ridurre il rumore. JurMA si adatta alla volatilità del mercato e può essere regolato dall'utente per quanto riguarda la sensibilità, rendendolo utile per identificare tendenze e inversioni nei mercati finanziari. Questa adattabilità ed efficienza lo rendono

The Shooting Star candlestick, a key player in technical analysis, serves as a harbinger of potential trend reversals in financial markets. Distinguished by its small real body, long upper shadow, and minimal lower shadow, the Shooting Star suggests a shift from bullish to bearish momentum. Traders keen on market insights often use this pattern to identify potential selling opportunities, highlighting potential weakness after an uptrend. Harness the power of the Shooting Star to refine your cand

Vision è un indicatore professionale che legge i dati storici del periodo impostato e in base a tali elabora una previsione scrivendo l'andamento sul grafico, l'impatto visivo eccellente rende chiaro l'andamento del prossimo trend e mette a fuoco il prezzo d'ingresso il posizionamento di ordini e la distanza per SL e TP, di default è impostato con un rapporto bilanciato 24 a 24 ciò significa che in base alle ultime 24 candele prevederà scrivendo sul grafico l'andamento delle 24 candele successi

Il modello a candela Hammer è formato da una singola candela. Ecco come identificare il modello della candela Hammer: La candela ha un corpo piccolo Lo stoppino nella parte inferiore deve essere grande rispetto al corpo Nella parte superiore non dovrebbe avere stoppino o essere molto piccolo Il colore del corpo non ha importanza Questo modello di candela rialzista a 1 candela è un modello di inversione, il che significa che viene utilizzato per trovare i fondi. Per questo motivo, vogliamo veder

Strategy Introduction The EA will find the best entry and exit points based on the data trained by the neural network and the current market trend. It includes multiple loss exit strategies to ensure capital safety. Because the market is full of uncertainties, it is impossible to enter at the most ideal point every time. Our EA uses a unique batch entry method, adding up to 5 entry points. Each order has a fixed stop loss (SL) and take profit (TP), leaving enough room to deal with sudden market

This smart EA is based on Fake outs caused by Market movers when they're trying to liquidate positions It is based on the following Concepts: Liquidity Grab: A liquidity grab typically refers to a trading strategy that aims to take advantage of price movements triggered by sudden spikes in trading volume or liquidity. Traders often believe that these liquidity grabs can lead to significant price movements. The EA might be programmed to identify and react to such liquidity events. Bullish Daily C

The Liquidation Estimates (Real-Time) experimental indicator attempts to highlight real-time long and short liquidations on all timeframes. Here with liquidations, we refer to the process of forcibly closing a trader's position in the market.
By analyzing liquidation data, traders can gauge market sentiment, identify potential support and resistance levels, identify potential trend reversals, and make informed decisions about entry and exit points.
USAGE (Img 1) Liquidation refer
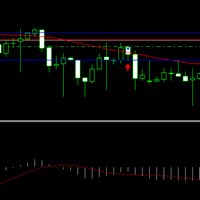
Simple EA with two indicators (SMA + MACD) and Grid. The Expertadvisor opens positions in the direction of the trend when MACD value crosses MACD signal line in a special constellation. It then uses a simple grid strategy if the position turns into a loss. Grid levels can be defined specific to the market.
It depends on your personal preferences and the respective market which parameters should be set and how. You have to test it yourself. The EA is programmed in such a way that optimization r

Il Golden Pattern è una configurazione a 3 candele basata sulla sezione aurea della sequenza di Fibonacci.
La sezione aurea è 1.618. Le sue variazioni includono 0,618, 2,618 e 3,618. In questo indicatore, i risultati migliori sono 2.618.
Il modello Golden è composto da una candela normale, seguita da una candela più grande, con un prezzo di chiusura pari ad almeno 2,618 volte la dimensione della prima candela.
Il modello Golden rialzista è composto da candele rialziste, mentre il mode
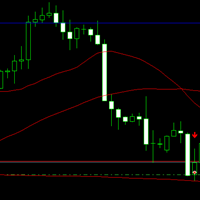
Simple EA with 3 SMAs and Grid. The Expertadvisor can be run in either “TREND” or “RETRACE” mode. In trend mode, it opens positions in the direction of the movement of the base moving average. In retrace mode, it opens positions in anticipation of the price moving back to the base moving average. It then uses a simple grid strategy if the position turns into a loss. Grid levels can be defined specific to the market. User can set "positive Swap Only"-Mode to reduce trading costs for positions tha
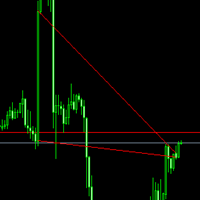
The Expert Advisor uses an Triangle Pattern as a signal and opens positions when the triangle and the price action reach a certain constellation. It then uses a simple grid strategy if the position turns into a loss. Grid levels can be defined specific to the market. User can set "positive Swap Only"-Mode to reduce trading costs for positions that may need to be held for a longer period of time. A news filter, filter by day of the week and fibonacci pricelevel filter are built in. It depends on
Il MetaTrader Market è un negozio online unico di robot di trading e indicatori tecnici.
Leggi il promemoria utente di MQL5.community per saperne di più sui servizi unici che offriamo ai trader: copia dei segnali di trading, applicazioni personalizzate sviluppate da freelance, pagamenti automatici tramite il Sistema di Pagamento e il MQL5 Cloud Network.
Ti stai perdendo delle opportunità di trading:
- App di trading gratuite
- Oltre 8.000 segnali per il copy trading
- Notizie economiche per esplorare i mercati finanziari
Registrazione
Accedi
Se non hai un account, registrati
Consenti l'uso dei cookie per accedere al sito MQL5.com.
Abilita le impostazioni necessarie nel browser, altrimenti non sarà possibile accedere.