Guarda i video tutorial del Market su YouTube
Come acquistare un Robot di Trading o un indicatore
Esegui il tuo EA
hosting virtuale
hosting virtuale
Prova un indicatore/robot di trading prima di acquistarlo
Vuoi guadagnare nel Market?
Come presentare un prodotto per venderlo con successo
Expert Advisors e Indicatori per MetaTrader 5 - 136

"Quick Copier" is designed to copy trading without any complicated settings. It copies master orders faster than "Just Copier" (https://www.mql5.com/en/market/product/20920). Please also check this product at fxina.hostingerapp.com. The copy can be done in one PC. One EA can be set as master (provider) or slave (receiver). The receiver lot can be set to multiple providers lots. Any type of copy is available. MT4 -> MT5 MT4 -> MT4 MT5 -> MT5 MT5 -> MT4 If you want to copy MT4 -> MT5 or MT5 -> MT

This tool is used to generate a K - line reflection chart of a currency pair for foreign exchange transactions.
For example, if the currency pair is EURUSD, a custom currency pair named EURUSD_ref is generated and a chart for that currency pair is opened. The price of a custom pair of currency is the inverse of the price of the original pair, which is the equivalent of a new pair of currency, the USDEUR.
The usage is simple, put it on any chart, the new chart will open, and then draw the co
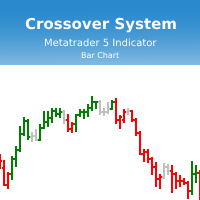
Индикатор Crossover System основан на трех скользящих средних, который изменяет цвет баров в зависимости от определенных условий скользящих средних. Этот индикатор позволит реализовывать системы из одной скользящей средней, из двух скользящих средних и из трех скользящих средних. Параметры индикатора: fastperiod - период быстрой скользящей средней fastMethod - метод построения быстрой скользящей средней fastPrice - метод вычисления быстрой скользящей средней fastshift - сдвиг быстрой скользя

Engulfing Candlestick Bulkowski The engulfing candlestick is a well-known candle pattern composed of two candles. This indicator for showing engulfing candlestick that describe by Thomas Bulkowski.
If you need for MetaTrader 4 version, please visit here: https://www.mql5.com/en/market/product/34193
Feature Highlights Show bullish engulfing and bearish engulfing. Customizable "Up Symbol". Customizable "Down Symbol". Customizable symbol distance from candlestick. Customizable "Down Color". Cus

KT COG is an advanced implementation of the center of gravity indicator presented by John F. Ehlers in the May 2002 edition of Technical Analysis of Stocks & Commodities magazine. It's a leading indicator which can be used to identify the potential reversal points with the minimum lag. The COG oscillator catches the price swings quite effectively.
MT4 version of the same indicator is available here KT COG Advanced MT4
Calculation of COG The COG indicator is consist of the two lines. The mai
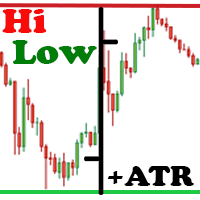
The Hi Low Last Day ( Hi Lo Last Day ) indicator shows the high and low of the last trading day and the second trading day. There are many trading strategies on the daily levels. This indicator is indispensable when using such trading strategies. In fact, everything is simple in trading, you just need to understand and accept it for yourself. There is only price!!! What is price? This is the level on the chart. The level is the price that the buyer and the seller are holding back. What price is

The purpose of this utility is to manage one or more subwindow in the same chart by opening and closing them through a button or the keyboard keys
How it works: If you want to handle more than one subwindow you need to reinstall the indicator . In this case some setups has to be customized onlu in the last subwindow installed and others setups in the installed subwindow during the first time installation. They are denoted in the input rispectively as ' LW ' and ' IW '.
First of all insta
This indicator helps you control several pairs in a small workspace, therefore, it is not necessary to open several charts on the platform to do so. The indicator shows sequentially up to 6 different pairs, besides that each of these pairs has a button with which you can stop the indicator to observe the selected pair. Place the indicator on a chart to monitor several pairs and the rest of your space use it on the chart of the pair you wish to observe in detail. MT4 version Parameters Ob

TeaCii Auto Fibonacci MTF is an implementation of Fibonacci Levels The indicator is simple and yet more powerful than those in the market
IMPORTANT: UNIQUE SELLING POINTS - The Levels are set automatically - You can see ANY TIMEFRAME Levels in ANY Chart. E.g. Watch H1 on M1. Watch M1 on H1 - The Levels are available in Buffers for EA Use - Helps you to get an edge early in by using multi timeframe
Parameters TimeFrame : The timeframe of the indicator. It can be same, higher or lower than t

Market Sentiment is an indicator for MT5. Market sentiment is the feeling or tone of a market . Also called investor sentiment, it is generally described as being bullish or bearish : When bulls are in control, prices are going up . When bears are in control, prices are going down . Markets being driven by emotions, the market sentiment is about feelings whereas fundamental value is about business performance .
Settings : Range in bars : numbers of bars used for the calculation, at your own

HV Models is an Indicator that containes 4 methods for calculating historical volatility of the selected asset. Volatility is one of the fundamental values describing changes in the underlying asset. In statistics, it usualy describes as a standard deviation. The price chart has 4 values (Open High Low Close) when we calculate volatility using a standard indicator, only one of these values is used as a result we get one-sided volatility picture. The presented indicator uses 4 volatility ca

Santa Scalping is a fully automated Expert Advisor with no use of martingale. Night scalping strategy. The SMA indicator filter are used for entries. This EA can be run from very small accounts. As small as 50 EUR.
General Recommendations The minimum deposit is 50 USD, default settings reccomend for eurusd m5 gmt +2 . Please use max spread 10 if you will not have orders change it to -1. Use a broker with good execution and with a spread of 2-5 points. A very fast VPS is required, preferably w

Индикатор RSI magic kjuta5 .
Пользовательский Индикатор ( RSI magic kjuta ) на основе стандартного Индикатора Силы ( Relative Strength Index, RSI ) с дополнительными настройками и функциями. К стандартной линии RSI добавлены линии максимального и минимального значения RSI на графике. Теперь можно визуально наблюдать прошедшие максимумы и минимумы RSI , а не только значения по закрытию баров, что позволяет избежать путаницы при анализе торгов. Например, советник открыл или закрыл ордер, но

This positions risk visualization indicators, indicators allow you to clearly know price go back will be generated how much account Loss Percent. This is very useful indicator for Controlling Risk when account is open positions, attach this indicator to the chart of the open positions, this indicator will draw three Lines, the three Line of Loss Percent default value is 10% 30% 50% user can define their own Loss Percent value. Loss Percent corresponding Back Point will show in the upper
Description: - Chart Time + Indicator is very simple and easy, but it can be very important to control the time before opening any manual trade. This indicator shows the time in a panel between 3 different options. Can be possible to move the panel with mouse or with fixed coordinates on the chart. Input Parameters: - Local Time : Enable Local Time if you want to show it (Personal Computer Time). - Server Time : Enable Server Time if you want to show it (Broker Time). - GMT Time

Description: - We all want to have the lowest spread and never high, with this utility we can have more information and a clearer idea of when the spread is acceptable or not. The Panel InfoSpread is a utility expert advisor and shows information on different spread options in one or more symbols, can be actual spread, average, minimum, maximum and tick counter. Read and show the symbols that are in the Market Watch window. Also you can put a maximum limit of average spread in every symbol f

BeST_Darvas Boxes is a Metatrader Indicator based on the trading method developed in the 50’s by the Hungarian Nicolas Darvas . BeST_Darvas Boxes indicator draws the Top and the Bottom of every Darvas Box that can be confirmed on the current Chart draws Buy and Sell Arrows for every confirmed Upwards or Downwards Breakout of the above levels draws always only after the bar closing and so is non-repainting or backpainting it can be used as a standalone trading system/method
Inputs
Basic Sett
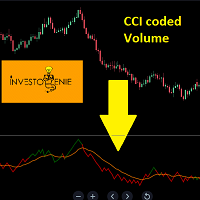
The Indicator is based on Commodity Channel Index (CCI) coded on Volume. The concept is to try and analyze the movement of Volume and Price in a certain direction
Concept:
If the Price of the indicator moves below the threshold price, it turns RED indicating the direction downwards is getting strong.
If the Price of the indicator moves above the threshold price, it turns GREEN indicating the direction upwards is getting strong.
The moving average acts as a great filter to decide entry/exi

Day Channel The indicator draws a channel built on the extremum levels of bars from the older period set in the settings, and also displays the level of closing prices. For the indicator to work correctly, the current period for which the indicator will be set must be less than the specified period in the indicator settings. Description of indicator settings: TimeFrame - selection of a period for plotting indicator levels. By default, the daily chart period is set. LevelClose - enable or disab

Pivots Points are significant levels traders can use to determine directional movement, support and resistance. Pivot Points use the prior period's high, low and close to formulate future support and resistance. In this regard, Pivot Points are predictive and leading indicators. Pivot Points were originally used by floor traders to set key levels. Floor traders are the original day traders. They deal in a very fast moving environment with a short-term focus. At the beginning of the trading day,

This indicator uses VWAP and projects this VWAP into up to 3 levels, shifted by a percentage of the chart's symbol.
How to configure: Choose the symbol and desired graphic time Set the start time of the symbol (in bovespa, WIN and WDO start at 9 o'clock). This time is used as the cutoff reference for VWAP. Check which VWAP period fits the chart better: Ideally, a period when VWAP is not too distant from the chart Set percentage levels: Ideally, you should set levels based on history, so that l

The FourierExtrapolationMA indicator transforms and extrapolates the Moving Average function by the Fast Fourier Transformation method.
1. The transformation period is set by two vertical lines, by default the first blue line and the second pink.
2. By default, the Moving Average (MA) line is drawn in red.
3. By Fourier Transform, the indicator builds a model of N harmonics, which is as close as possible to the MA values. The model is drawn by default in blue over the MA for the period bet

The principle of construction - on top of any number of bars set by the user, a channel is constructed with maximum and minimum lines so that the bars touch the maximum and minimum of the channel at exactly three points. The name of the indicator follows from this principle. Both vertical lines can be moved along the graph by the user, thus specifying the period on which the channel is built. After a specified period, channel rays are drawn that define a channel in which the price can move.

Deposit Supercharger: Optimized Trend Indicator This indicator is based on three technical analysis indicators and two filters, providing more accurate signals. Description: Technical Indicators: The indicator operates based on three technical analysis indicators that help determine the trend direction and potential reversal points. Filters: To filter signals, it uses the price highs and lows from the last two days (support and resistance levels) and a volume indicator, which enhances the signa

Trailing Stop Universal MT4 / MT5 utility is a multifunctional tool for protecting floating profit on open positions and reducing possible risks in trading. To realize these goals, the tool offers the user the following features. Breakeven function - transfers a position to breakeven when the profit of the position allows it. If this function is enabled and the conditions of its operation are met, it moves the StopLoss order to the opening price of the position or even to the profitable

This positions risk visualization indicators, indicators allow you to clearly know how much price go back will be generated account Stop Out. This is a very useful indicator for Controlling Risk when account is open positions, attach this indicator to the chart of the open positions, the indicator will draw a Line Of Stop Out Price on the chart, and output Stop Out Point Value in the upper left corner. Stop Out Price can give you clearly know what price is Account Stop Out, can giv

While you are trading, Auto StopLoss Premium doing all the routine work. "Must have" for scalping. Best way to save account balance in case of force majeure.(Internet connection loss, power outage, sharp change in price direction) The Utilite automatically adds a stop loss to open and pending orders that have no stoploss set. Also adds a take profit. The anti-requote system is built into the Utilite. That means the stop loss will be registered anyway! In the settings you can set any stop los

While you are trading, Auto StopLoss Defender doing all the routine work. "Must have" for scalping. Best way to save account balance in case of force majeure.(Internet connection loss, power outage, sharp change in price direction) The Utilite automatically adds a stop loss to open and pending orders that have no stoploss set. The anti-requote system is built into the Utilite. That means the stop loss will be registered anyway! In the settings you can set any stop loss begin from 0.0001 (If yo
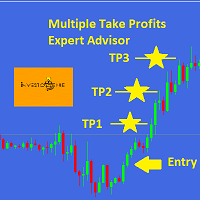
This EA is designed for MULTIPLE TAKE PROFITS options based on User's order management.
ABOUT EXPERT ADVISOR:
The expert advisor is designed to help user take multiple profits on single order. The multiple take profits can be allocated a fixed percentage based on user's preferences. The user is required to set an entry level in price and set target percentages and target prices. The stop loss and price to close options helps user in risk management.
ADVANTAGES:
Option of Taking Profits

TeaCii trend is a LEADING NON-LAG indicator to trade Ranged Markets or Breakouts. The indicator marks support and resistance at the moment they are formed . It has only one setting for the ATR. We recommend leaving default.
This is not an indicator that draws lines from the highs or lows and regards them as SR. It creates actual SR levels way before the market even shows the level as SR. Often 5 to 10 candles before the naked eye can see it. Look at the first dot and know that SR was declared

Панель предназначена для быстрого визуального нахождения и отображения внешних баров по всем периодам и на любых выбранных валютных парах одновременно. Цвет сигнальных кнопок, указывает на направление паттерна. По клику на сигнальную кнопку, осуществляется открытие графика с данным паттерном. Отключить не используемые периоды, можно кликом по его заголовку. Имеется поиск в истории (по предыдущим барам). Прокрутка (scrolling) панели, осуществляется клавишами "UP" "DOWN" на клавиатуре. Имеется Pus
The utility is entended for preparing information for the Sprint EA . Preparing information for different financial instruments needs the EA to be attached to a chart of the corresponding financial instrument. The EA prepares information in online mode only. Input Parameters Symbol Name - name of financial instrument of the chart the EA is attached to. Connection Control - control of disconnections with the trade server: true - enable. false - disable. Send Mail - send an e-mail notification abo
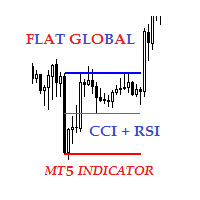
Description The indicator of local flat for CCI and RSI indicators. Users can select financial instruments. The indicator allows to find local flats in the following options: Width of channels that is not more than certain range Width of channels that is not less than certain range Width of channels that is not more and not less than certain range The indicator displays the middle and boundaries of the channel.
Purpose
The indicator can be used for manual or automated trading within an Exper

Introduction This indicator detects volume spread patterns for buy and sell opportunity. The patterns include demand and supply patterns. You might use each pattern for trading. However, these patterns are best used to detect the demand zone (=accumulation area) and supply zone (=distribution area). Demand pattern indicates generally potential buying opportunity. Supply pattern indicates generally potential selling opportunity. These are the underlying patterns rather than direct price action. T

Simple WhiteRegr expert, minimum parameters. Advanced development of the White bot. The principle of operation is to monitor the market using two channels of the regression indicator. Open orders as often as possible with a given step in increments. Thus, the position is constantly changing in the wake of the market. Extremely reliable strategy, the leader of all created by the author of strategies for reliability. Compared with the previous version, forecasting is much better. It gives very goo

Very simple White expert, minimum parameters. The principle of operation is to follow the market. Open an order as often as possible with a given step in increments. Thus, the position is constantly changing in the wake of the market. Extremely reliable strategy, the leader of all created by the author of strategies. It gives very good results when used in a multi-currency mode. Profit for one pair is not big but good forecasting is very clearly seen. Accordingly, in such conditions, when using
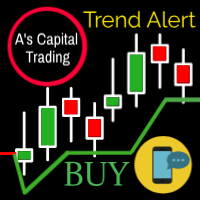
A's Capital Line is a complex algorithm that detects 100% of the trends .
This line marks the following information: The entrance to the trend. Stop of loss. Supports and resistances. When to take Profit.
Send alerts to your cell phone through metatrader It works perfect on any instrument (stocks, forex, crypto, commodities, indices, etc). Also in any time frame to adjust to any trading style. Please see Screenshots for examples and Follow us on instagram. Image 1 Line settings are difere
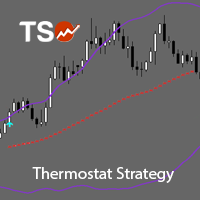
TSO Thermostat Strategy is an indicator that can adapt to the current market conditions by switching from a trend-following mode to a short-term swing mode, thus providing the best possible entry/exit signals in any situation. It is based on the Thermostat Trading Strategy as presented in the book Building Winning Trading Systems with TradeStation by G. Pruitt and J. R. Hill. Strategy The Thermostat Strategy uses different entry and exit conditions based on the current situation of the market

This EA take advantage from great markets movement by setting up pending orders on support and resistance lines, after that it wait the market movement to fill these orders, if it don't the EA deletes them and creates another pending orders. This system don't use grid neither martingale. It is simple and pure TakeProfit and StopLoss, and it has virtual trailing stop to mask trailing stop from server. It don't need to worry about news of high impact. It is advisor to use ECN account type with low

Основа работы советника, это увеличение лота и их усреднение, но основное отличие, это пропорциональная торговля. Благодаря этому параметры советника не будут переоптимизированны. Советник торгует одновременно в обе стороны, без индикатора. Самая важная информация о работе выводится на график. Главное правило- это правильно оптимизировать советник. Покупки и продажи оптимизируются отдельно, для этого следует выключить LONG TRADES OPEN или SHORT TRADES OPEN. Начинать оптимизировать советник на

This utility ensures a real-time synchronization of multiple charts. Any event of a graphical object creation/modification/deletion, chart scrolling and zooming is copied from the current source chart to one or more receiving charts. Note: demo-version of this product doesn't work in the backtester! ______________________________________________________________ Settings: Synchronize with - select the receivers: Same symbol - all charts with the same symbol; Same symbol - all charts with the same
Данный софт позволяет вам управлять своими параметрами риска и мани менеджмента. Вы можете задавать параметр риска как на текущий капитал, так и на предполагаемый уровень депозита, что позволит контролировать риски в каждой сделке и в каждом активе. Open order script также позволяет задать фиксированный объём открытия операций и вести торговлю «в один клик» благодаря реализации дополнительных кнопок Sell / Buy непосредственно на график. Особенность скрипта
Ключевой особенностью и характеристи

Технический индикатор Universal Oscillator является комбинацией торговых сигналов самых популярных и широко используемых осцилляторов. Индикатор представлен гистограммами, а также линиями fast и slow MA, что позволяет расширить список получаемых торговых рекомендаций и работать как по тренду, так и в боковом движении рынка. Таким образом, гистограммы позволяют определить момент пробоя ценовых значений и движение в новой фазе рынка, а линии указывают на зоны перекупленности и перепроданности. Ос

Технический индикатор Price Channel & Bollinger Bands является комбинацией двух наиболее популярных канальных индикаторов. Данный индикатор отображает моменты пробоя как каждого канала по отдельности, так и генерирует сигналу в момент одновременного закрытия цен за линиями поддержки/сопротивления. Каждый пробой подсвечивает свечу определенным цветом, что позволяет убрать линии для более комфортной работы с графиком. В случае одновременного пробоя PC и BB, индикатор также отобразит необходимый ма

Технический индикатор Bollinger Bands классически отображается двумя линиями, которые демонстрируют отклонение котировок от МА 20. Для этого используется стандартное отклонение, параметр которого собственно и задаёт динамику двум полосам. Так как индикатор отображает момент повышенной волатильности на рынке, закрытие котировок за полосами свидетельствует об импульсном направлении рынка или же выхода с длительной зоны проторговки. Таким образом, работа на пробой позволяет войти в момент отклонени

Технический индикатор Angry Alligator является расширенной авторский интерпретацией индикатора от B. Williams’а. Данный индикатор имеет такие же принципы работы, что и классический индикатор Alligator и основан на тех же параметрах. Ключевым отличием и преимуществом данного индикатора заключается в том, что в нем реализован дополнительный торговой сигнал в виде ещё одной линии. Продолжая тему B. Williams’а сигнал отображает «укус» котировок индикатором - Alligator’s Bite. Дополнительный параметр

LinLit mq5 EURAUD is fully automated EA. The input parameters are optimized for EURAUD - M15 time frame We use, Envelopes, Volumes and Money Flow Index indicators EA NOT use Martingale, GRID, Averaging and other dangerous strategies! Full compliance with the FIFO method! Recommendations EA Settings : Use default settings. Symbol : EURAUD. Time Frame : M15. Brokers : ECN brokers, low spread/commission, 1:400 leverage Minimum Deposit : $200 USD.
Parameters Entry lot size : Initial lot siz

LinLit mq5 AUDCAD is fully automated EA. The input parameters are optimized for AUDCAD - M15 time frame, But can also work on other pairs, and CFD's and time frames We use, Directional Indicators and Bollinger Bands indicators EA NOT use Martingale, GRID, Averaging and other dangerous strategies! Full compliance with the FIFO method! Recommendations EA Settings : Use default settings. Symbol : AUDCAD. Time Frame : M15. Brokers : ECN brokers, low spread/commission, 1:400 leverage Minimum

LinLit mq5 GBPUSD is fully automated EA. The input parameters are optimized for GBPUSD - M15 time frame, But can also work on other pairs, and CFD's and time frames We use, Bollinger Bands and Stochastic indicators EA NOT use Martingale, GRID, Averaging and other dangerous strategies! Full compliance with the FIFO method! Recommendations EA Settings : Use default settings. Symbol : GBPUSD. Time Frame : M15. Brokers : ECN brokers, low spread/commission, 1:400 leverage Minimum Deposit : $2

LinLit mq5 EURUSD is fully automated EA. The input parameters are optimized for EURUSD - M15 time frame, But can also work on other pairs, and CFD's and time frames We use, Commodity Channel Index, Force Index and Standard Deviation indicators EA NOT use Martingale, GRID, Averaging and other dangerous strategies! Full compliance with the FIFO method! Recommendations EA Settings : Use default settings. Symbol : EURUSD. Time Frame : M15. Brokers : ECN brokers, low spread/commission, 1:400 leverag
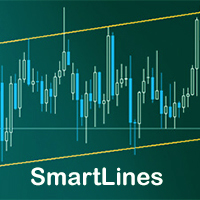
SmartLines allows you to open orders using trend lines. SmartLines for MT4 https://www.mql5.com/ru/market/product/25875
Now you have the opportunity to control breakthroughs of the trend corridor automatically and without delay. As soon as the price crosses your trend line with your settings, the order is automatically opened. You will not miss the moment of the trend change. The principle of working with SmartLines is similar to placement of pending orders. However, pending orders only have t

This indicator uses volume and volatility information to indicate the trend or to indicate the market reversion/correction. There are 2 indicators in one. The indicator works in two styles: values per candle and accumulated values. Using the volume and volatility information, when well adjusted, this indicator has a good probability to indicate the right direction, both in lower (M1, M2, M5) and higher (M15, M30) timeframes.
Strategy 1: Trend indicator Indicates the operation direction. To u

Swing Points are those places on the chart where price changes direction. This is an MT5 version of my MT4 Swing Points Indicator. Found on the code base at https://www.mql5.com/en/code/15616 and in the market at https://www.mql5.com/en/market/product/22918
The beginning input parameters allow you to configure your alerts. Turn on screen alerts allows you to turn on and off screen alerts. True is on, false is off. Turn on push to phone alerts allows you to turn on and off push to phone ale

Average True Range. Fully automatic. Calculates last candle high and low for finding trends. Strong results with british pound in daily charts. Uses Atr modificable periods, trailing stop and take profit. Tested in real accounts. Is a great expert advisor with great results. You can choose the risk you want to take. Can calculate automaticaly the total amount of risk for new trades. Tested with 10 years data. Best inputs 1 atr for open, 2 for close. Atr settings to 200.

Description
The base of this indicator is an ZigZag algorithm based on ATR and Fibo retracement. The ZigZag can be drawn like a classic ZigZag or like Arrows or needn't be drawn at all. This indicator is not redrawing in sense that the ZigZag's last shoulder is formed right after the appropriate conditions occur on the market. The shoulder doesn't change its direction afterwards (can only continue). There are some other possibilities to show advanced information in this indicator: Auto Fibo on
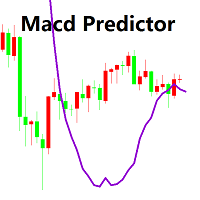
Macd's main chart indicator
1. You can determine the price at which the MACD will change from buy to sell, and vice versa. It is the cousin of the oscillator predictor. If you know a position at the time, then the exact price, current and next (future) columns will need to reach the MACD crossover. You can also see how far the market has to go before your current position is helped or blocked by the next MACD crossover force. You can do this in all time frames because the predictor is updated

MA strategies EA is a moving average cross EA that can support multiple MA cross strategies that involve two or three moving averages. Purchasing this EA can save you the time taken to automate your existing MA strategy through coding a custom EA and it also helps you discover profitable moving average strategies as its fully compatible with the strategy tester and all settings are editable. The EA supports both scalping, short term and long term strategies. The various supported settings are ex
The expert allows you to build a trading system based on an arbitrary set of technical indicators MT5. The EA uses the following signals: - OpenBuy / OpenSell - opening positions;
- StopBuy / StopSell - closing positions;
- TakeProfitBuy / TakeProfitSell - get TP levels;
- StopLossBuy / StopLossSell - getting SL levels;
- NoLossBuy / NoLossSell - transfer to the breakeven state;
- MinProfitBuy / MinProfitSell - closing part of a position;
- CancelBuy / CancelSell - allow a repeated signal
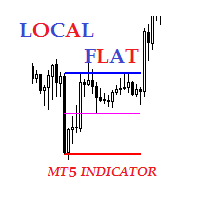
Description The indicator of local flat. The indicator allows to find local flats in the following options: Width of channels that is not more than certain number of points Width of channels that is not less than certain number of points Width of channels that is not more and not less than certain number of points The indicator displays the middle and boundaries of the channel. Attaching multiple instances of the indicator to the chart with different ranges leads to displaying a system of chann
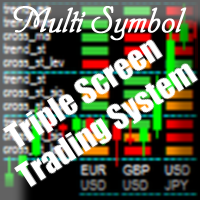
Purpose The indicator is intended for manual multi-currency trading based on the Triple Screen Strategy. It works with any symbols located in the Market Watch window of the MT5: currencies, metals, indexes, etc. The number of instruments can be limited by capacity of the МТ5's parameters. But if desired, you can create several windows with various set of instruments and parameters.
Operation Principle The indicator uses the modified Triple Screen Strategy for determining trend direction in the

The Expert Advisor is a great tool that allows you to control your trade with ease and precision. The tool can be moved in the graphs and offers the following characteristics:
Instant order entry with a single click. Entry of pending orders using price tags and trend lines. Instant order closure with a single click. Instant order closure using trend lines as output levels that the broker can not see. We can modify the way to enter and exit the market, allowing us to choose the way to do it. Fo

Average True Range. Calculates last candle high and low for finding trends. Strong results with british pound in daily charts. Uses Atr modificable periods, trailing stop and take profit. Tested in real accounts. Is a great expert advisor with great results. You can choose the risk you want to take. Can calculate automaticaly the total amount of risk for new trades.

The EA uses economic news trading using low, medium and high news. The EA is set for each piece of news separately. Trading is conducted on 26 currency pairs and 3 timeframes from M5-M30. The EA uses trading on such indicators as CCI, Standard Deviation, Moving Average, Relative Strength Index, Momentum and MACD . The EA looks for small price deviations by indicators and uses 3 types of economic news to confirm the position opening. Adaptive breakeven, trailing stop , and partial position clo

The utility refers to probabilistic analysis tools, in particular the Monte Carlo method. The Monte Carlo method is defined as the simulation of processes in purpose to evaluate their probabilistic characteristics and apply them to the solvable task.
Operation features The simulation uses a tick model with the subsequent transformation to the candles form, as a model as close as possible to the real market process. The utility generates a stream of a random tick sequence until a result with t

This indicator shows the remaining time for the candle to close, even if the price does not change in value, the clock keeps counting backward. You can also program price alert levels using trend lines.
It can be used together with Expert Advisors and other panels, such as Controller without limit MT5
MT4 version
Instructions To set a price alert level, you must draw a trend line. Once the object has been drawn, it must be named so that the indicator recognizes the object. In the

This is a complete and customizable Trading HUD (Head-Up Display) combining all important tools and information for professional trading in one window. Features:
1. Display key indicators that most professionals consider for their trading decisions Current daily, weekly and/or monthly Pivot Points with 7 Levels (PP, S1, S2, S3, R1, R2, R3) Complete history of daily, weekly and/or monthly Pivot Points Current level of exponential moving averages (EMAs) from different timeframes. The User can de

MultiTimeframe (MTF) Support and Resistance Indicator is use to measure last 320 bar (user input) of support and resistance of the dedicated timeframe.
User can attached this indicator to any desire timeframe. Features: User input desire timeframe (default Period H4) User input numbers of last bars (default 320 bars) User input measurement of last HH and LL (default 10 bars) Line styling and colors. MT4 Version : https://www.mql5.com/en/market/product/31984

Market profile was developed by Peter Steidlmayer in the second half of last century. This is a very effective tool if you understand the nature and usage. It's not like common tools like EMA, RSI, MACD or Bollinger Bands. It operates independently of price, not based on price but its core is volume. The volume is normal, as the instrument is sung everywhere. But the special thing here is that the Market Profile represents the volume at each price level.
1. Price Histogram
The Price Histogram

Price action is among the most popular trading concepts. A trader who knows how to use price action the right way can often improve his performance and his way of looking at charts significantly. However, there are still a lot of misunderstandings and half-truths circulating that confuse traders and set them up for failure. Using PA Trend Reversal will be possible to identify high probability exhaustion moves of a trend. Features The indicator gives alerts in real-time when the conditions are me

Renko graph The Renko indicator in the main chart window at the location with the current price. The indicator displays price changes in the form of rectangles ("bricks") against the background of a regular quote chart. The upward movement of the price, by the number of points specified in the settings, is marked by adding above the previous next rectangle, and downward movement - below the previous rectangle. The indicator is designed to visually identify the main trend. Used to identify key su
Il MetaTrader Market è un sito semplice e pratico dove gli sviluppatori possono vendere le loro applicazioni di trading.
Ti aiuteremo a pubblicare il tuo prodotto e ti spiegheremo come prepararne la descrizione per il Market. Tutte le applicazioni sul Market sono protette da crittografia e possono essere eseguite solo sul computer dell'acquirente. La copia illegale è impossibile.
Ti stai perdendo delle opportunità di trading:
- App di trading gratuite
- Oltre 8.000 segnali per il copy trading
- Notizie economiche per esplorare i mercati finanziari
Registrazione
Accedi
Se non hai un account, registrati
Consenti l'uso dei cookie per accedere al sito MQL5.com.
Abilita le impostazioni necessarie nel browser, altrimenti non sarà possibile accedere.