Guarda i video tutorial del Market su YouTube
Come acquistare un Robot di Trading o un indicatore
Esegui il tuo EA
hosting virtuale
hosting virtuale
Prova un indicatore/robot di trading prima di acquistarlo
Vuoi guadagnare nel Market?
Come presentare un prodotto per venderlo con successo
Expert Advisors e Indicatori per MetaTrader 5 - 127
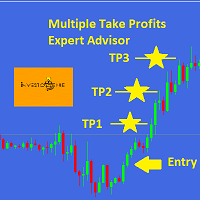
This EA is designed for MULTIPLE TAKE PROFITS options based on User's order management.
ABOUT EXPERT ADVISOR:
The expert advisor is designed to help user take multiple profits on single order. The multiple take profits can be allocated a fixed percentage based on user's preferences. The user is required to set an entry level in price and set target percentages and target prices. The stop loss and price to close options helps user in risk management.
ADVANTAGES:
Option of Taking Profits

TeaCii trend is a LEADING NON-LAG indicator to trade Ranged Markets or Breakouts. The indicator marks support and resistance at the moment they are formed . It has only one setting for the ATR. We recommend leaving default.
This is not an indicator that draws lines from the highs or lows and regards them as SR. It creates actual SR levels way before the market even shows the level as SR. Often 5 to 10 candles before the naked eye can see it. Look at the first dot and know that SR was declared

Панель предназначена для быстрого визуального нахождения и отображения внешних баров по всем периодам и на любых выбранных валютных парах одновременно. Цвет сигнальных кнопок, указывает на направление паттерна. По клику на сигнальную кнопку, осуществляется открытие графика с данным паттерном. Отключить не используемые периоды, можно кликом по его заголовку. Имеется поиск в истории (по предыдущим барам). Прокрутка (scrolling) панели, осуществляется клавишами "UP" "DOWN" на клавиатуре. Имеется Pus
The utility is entended for preparing information for the Sprint EA . Preparing information for different financial instruments needs the EA to be attached to a chart of the corresponding financial instrument. The EA prepares information in online mode only. Input Parameters Symbol Name - name of financial instrument of the chart the EA is attached to. Connection Control - control of disconnections with the trade server: true - enable. false - disable. Send Mail - send an e-mail notification abo
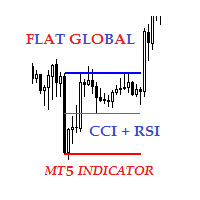
Description The indicator of local flat for CCI and RSI indicators. Users can select financial instruments. The indicator allows to find local flats in the following options: Width of channels that is not more than certain range Width of channels that is not less than certain range Width of channels that is not more and not less than certain range The indicator displays the middle and boundaries of the channel.
Purpose
The indicator can be used for manual or automated trading within an Exper

Introduction This indicator detects volume spread patterns for buy and sell opportunity. The patterns include demand and supply patterns. You might use each pattern for trading. However, these patterns are best used to detect the demand zone (=accumulation area) and supply zone (=distribution area). Demand pattern indicates generally potential buying opportunity. Supply pattern indicates generally potential selling opportunity. These are the underlying patterns rather than direct price action. T

Simple WhiteRegr expert, minimum parameters. Advanced development of the White bot. The principle of operation is to monitor the market using two channels of the regression indicator. Open orders as often as possible with a given step in increments. Thus, the position is constantly changing in the wake of the market. Extremely reliable strategy, the leader of all created by the author of strategies for reliability. Compared with the previous version, forecasting is much better. It gives very goo

Very simple White expert, minimum parameters. The principle of operation is to follow the market. Open an order as often as possible with a given step in increments. Thus, the position is constantly changing in the wake of the market. Extremely reliable strategy, the leader of all created by the author of strategies. It gives very good results when used in a multi-currency mode. Profit for one pair is not big but good forecasting is very clearly seen. Accordingly, in such conditions, when using
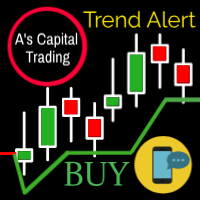
A's Capital Line is a complex algorithm that detects 100% of the trends .
This line marks the following information: The entrance to the trend. Stop of loss. Supports and resistances. When to take Profit.
Send alerts to your cell phone through metatrader It works perfect on any instrument (stocks, forex, crypto, commodities, indices, etc). Also in any time frame to adjust to any trading style. Please see Screenshots for examples and Follow us on instagram. Image 1 Line settings are difere
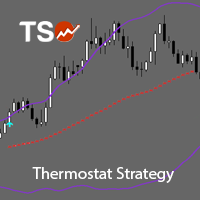
TSO Thermostat Strategy is an indicator that can adapt to the current market conditions by switching from a trend-following mode to a short-term swing mode, thus providing the best possible entry/exit signals in any situation. It is based on the Thermostat Trading Strategy as presented in the book Building Winning Trading Systems with TradeStation by G. Pruitt and J. R. Hill. Strategy The Thermostat Strategy uses different entry and exit conditions based on the current situation of the market
Useful tool that will notify you when it detects a possible movement by volume input.
Fundamentally in Futures.
Detects areas of NO OFFER / NO DEMAND.
Compare the volume of the candle in progress with the previous ones.
If the volume has been decreasing, when the current contracts, surpass the previous one, ALERT!
- It can be loaded in the main graphic or windows.
- For any temporality.
- It warns you with a pop-up window, on which graph the alarm went off.
- When the

Основа работы советника, это увеличение лота и их усреднение, но основное отличие, это пропорциональная торговля. Благодаря этому параметры советника не будут переоптимизированны. Советник торгует одновременно в обе стороны, без индикатора. Самая важная информация о работе выводится на график. Главное правило- это правильно оптимизировать советник. Покупки и продажи оптимизируются отдельно, для этого следует выключить LONG TRADES OPEN или SHORT TRADES OPEN. Начинать оптимизировать советник на

This utility ensures a real-time synchronization of multiple charts. Any event of a graphical object creation/modification/deletion, chart scrolling and zooming is copied from the current source chart to one or more receiving charts. Note: demo-version of this product doesn't work in the backtester! ______________________________________________________________ Settings: Synchronize with - select the receivers: Same symbol - all charts with the same symbol; Same symbol - all charts with the same
Данный софт позволяет вам управлять своими параметрами риска и мани менеджмента. Вы можете задавать параметр риска как на текущий капитал, так и на предполагаемый уровень депозита, что позволит контролировать риски в каждой сделке и в каждом активе. Open order script также позволяет задать фиксированный объём открытия операций и вести торговлю «в один клик» благодаря реализации дополнительных кнопок Sell / Buy непосредственно на график. Особенность скрипта
Ключевой особенностью и характеристи

Технический индикатор Universal Oscillator является комбинацией торговых сигналов самых популярных и широко используемых осцилляторов. Индикатор представлен гистограммами, а также линиями fast и slow MA, что позволяет расширить список получаемых торговых рекомендаций и работать как по тренду, так и в боковом движении рынка. Таким образом, гистограммы позволяют определить момент пробоя ценовых значений и движение в новой фазе рынка, а линии указывают на зоны перекупленности и перепроданности. Ос

Технический индикатор Price Channel & Bollinger Bands является комбинацией двух наиболее популярных канальных индикаторов. Данный индикатор отображает моменты пробоя как каждого канала по отдельности, так и генерирует сигналу в момент одновременного закрытия цен за линиями поддержки/сопротивления. Каждый пробой подсвечивает свечу определенным цветом, что позволяет убрать линии для более комфортной работы с графиком. В случае одновременного пробоя PC и BB, индикатор также отобразит необходимый ма

Технический индикатор широко известен читателям и поклонникам стратегии «черепах». Отображается линией по нижней/верхней точке цены за определенный интервал времени. Значение ценового канала также используют для определения зон поддержки и сопротивления. Если котировки актива прорывают и закрываются ниже/выше канала, то это является сигналом работы в сторону пробоя. Способы применения: Индикатор является самодостаточным и не требует дополнительных фильтров для начала работы. Однако для надёжност

Технический индикатор Bollinger Bands классически отображается двумя линиями, которые демонстрируют отклонение котировок от МА 20. Для этого используется стандартное отклонение, параметр которого собственно и задаёт динамику двум полосам. Так как индикатор отображает момент повышенной волатильности на рынке, закрытие котировок за полосами свидетельствует об импульсном направлении рынка или же выхода с длительной зоны проторговки. Таким образом, работа на пробой позволяет войти в момент отклонени
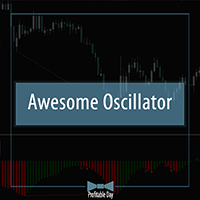
Технический индикатор Awesome Oscillator является классической реализацией торгового подхода Билла Вильямса. Индикатор имеет те же параметры что и интерпретация в МТ5 (отображает дельту между МА с периодом 5 и 34 рассчитанную по средним ценам). Ключевым отличием является графическое отображение каждого торгового сигнала, что позволяет более качественно провести анализ актива и получить звуковое оповещение о появлении сигнала. Торговые сигналы индикатора: 1. Crossed zero line : данный торговый с

Технический индикатор Angry Alligator является расширенной авторский интерпретацией индикатора от B. Williams’а. Данный индикатор имеет такие же принципы работы, что и классический индикатор Alligator и основан на тех же параметрах. Ключевым отличием и преимуществом данного индикатора заключается в том, что в нем реализован дополнительный торговой сигнал в виде ещё одной линии. Продолжая тему B. Williams’а сигнал отображает «укус» котировок индикатором - Alligator’s Bite. Дополнительный параметр

LinLit mq5 EURAUD is fully automated EA. The input parameters are optimized for EURAUD - M15 time frame We use, Envelopes, Volumes and Money Flow Index indicators EA NOT use Martingale, GRID, Averaging and other dangerous strategies! Full compliance with the FIFO method! Recommendations EA Settings : Use default settings. Symbol : EURAUD. Time Frame : M15. Brokers : ECN brokers, low spread/commission, 1:400 leverage Minimum Deposit : $200 USD.
Parameters Entry lot size : Initial lot siz

LinLit mq5 AUDCAD is fully automated EA. The input parameters are optimized for AUDCAD - M15 time frame, But can also work on other pairs, and CFD's and time frames We use, Directional Indicators and Bollinger Bands indicators EA NOT use Martingale, GRID, Averaging and other dangerous strategies! Full compliance with the FIFO method! Recommendations EA Settings : Use default settings. Symbol : AUDCAD. Time Frame : M15. Brokers : ECN brokers, low spread/commission, 1:400 leverage Minimum

LinLit mq5 GBPUSD is fully automated EA. The input parameters are optimized for GBPUSD - M15 time frame, But can also work on other pairs, and CFD's and time frames We use, Bollinger Bands and Stochastic indicators EA NOT use Martingale, GRID, Averaging and other dangerous strategies! Full compliance with the FIFO method! Recommendations EA Settings : Use default settings. Symbol : GBPUSD. Time Frame : M15. Brokers : ECN brokers, low spread/commission, 1:400 leverage Minimum Deposit : $2

LinLit mq5 EURUSD is fully automated EA. The input parameters are optimized for EURUSD - M15 time frame, But can also work on other pairs, and CFD's and time frames We use, Commodity Channel Index, Force Index and Standard Deviation indicators EA NOT use Martingale, GRID, Averaging and other dangerous strategies! Full compliance with the FIFO method! Recommendations EA Settings : Use default settings. Symbol : EURUSD. Time Frame : M15. Brokers : ECN brokers, low spread/commission, 1:400 leverag
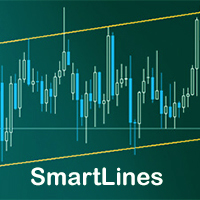
SmartLines allows you to open orders using trend lines. SmartLines for MT4 https://www.mql5.com/ru/market/product/25875
Now you have the opportunity to control breakthroughs of the trend corridor automatically and without delay. As soon as the price crosses your trend line with your settings, the order is automatically opened. You will not miss the moment of the trend change. The principle of working with SmartLines is similar to placement of pending orders. However, pending orders only have t

This Expert Adviser is based on the crossover of moving averages. The user can select to employ up to 10 moving averages which crossover each other to execute market orders (open and close trades). The selected number of moving averages to crossover each other for opening trades and their individual configurations are independent of the selected number of moving averages to crossover each other for closing trades and their individual configurations. The user can also choose to configure up to 5

This indicator uses volume and volatility information to indicate the trend or to indicate the market reversion/correction. There are 2 indicators in one. The indicator works in two styles: values per candle and accumulated values. Using the volume and volatility information, when well adjusted, this indicator has a good probability to indicate the right direction, both in lower (M1, M2, M5) and higher (M15, M30) timeframes.
Strategy 1: Trend indicator Indicates the operation direction. To u

Average True Range. Fully automatic. Calculates last candle high and low for finding trends. Strong results with british pound in daily charts. Uses Atr modificable periods, trailing stop and take profit. Tested in real accounts. Is a great expert advisor with great results. You can choose the risk you want to take. Can calculate automaticaly the total amount of risk for new trades. Tested with 10 years data. Best inputs 1 atr for open, 2 for close. Atr settings to 200.

Description
The base of this indicator is an ZigZag algorithm based on ATR and Fibo retracement. The ZigZag can be drawn like a classic ZigZag or like Arrows or needn't be drawn at all. This indicator is not redrawing in sense that the ZigZag's last shoulder is formed right after the appropriate conditions occur on the market. The shoulder doesn't change its direction afterwards (can only continue). There are some other possibilities to show advanced information in this indicator: Auto Fibo on
Automatic stops monitors your account and automatically sets the values you enter in the EA for stop loss, take profit and also trailing stop. As long as the EA is attached on a chart it will set stops and offer automatic trailing to any new trades for that currency pair so you wont have to manually enter them every time you open a trade. Features include: Ability to select which trades should be monitored via magic number. You can leave the value to 0 to only monitor manual trades or to any one
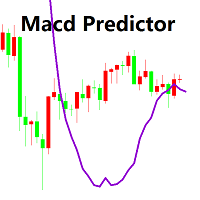
Macd's main chart indicator
1. You can determine the price at which the MACD will change from buy to sell, and vice versa. It is the cousin of the oscillator predictor. If you know a position at the time, then the exact price, current and next (future) columns will need to reach the MACD crossover. You can also see how far the market has to go before your current position is helped or blocked by the next MACD crossover force. You can do this in all time frames because the predictor is updated
The expert allows you to build a trading system based on an arbitrary set of technical indicators MT5. The EA uses the following signals: - OpenBuy / OpenSell - opening positions;
- StopBuy / StopSell - closing positions;
- TakeProfitBuy / TakeProfitSell - get TP levels;
- StopLossBuy / StopLossSell - getting SL levels;
- NoLossBuy / NoLossSell - transfer to the breakeven state;
- MinProfitBuy / MinProfitSell - closing part of a position;
- CancelBuy / CancelSell - allow a repeated signal
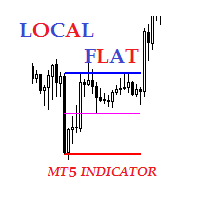
Description The indicator of local flat. The indicator allows to find local flats in the following options: Width of channels that is not more than certain number of points Width of channels that is not less than certain number of points Width of channels that is not more and not less than certain number of points The indicator displays the middle and boundaries of the channel. Attaching multiple instances of the indicator to the chart with different ranges leads to displaying a system of chann
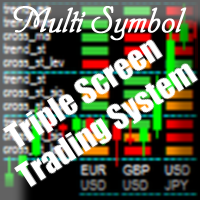
Purpose The indicator is intended for manual multi-currency trading based on the Triple Screen Strategy. It works with any symbols located in the Market Watch window of the MT5: currencies, metals, indexes, etc. The number of instruments can be limited by capacity of the МТ5's parameters. But if desired, you can create several windows with various set of instruments and parameters.
Operation Principle The indicator uses the modified Triple Screen Strategy for determining trend direction in the

The Expert Advisor is a great tool that allows you to control your trade with ease and precision. The tool can be moved in the graphs and offers the following characteristics:
Instant order entry with a single click. Entry of pending orders using price tags and trend lines. Instant order closure with a single click. Instant order closure using trend lines as output levels that the broker can not see. We can modify the way to enter and exit the market, allowing us to choose the way to do it. Fo

Average True Range. Calculates last candle high and low for finding trends. Strong results with british pound in daily charts. Uses Atr modificable periods, trailing stop and take profit. Tested in real accounts. Is a great expert advisor with great results. You can choose the risk you want to take. Can calculate automaticaly the total amount of risk for new trades.

The EA uses economic news trading using low, medium and high news. The EA is set for each piece of news separately. Trading is conducted on 26 currency pairs and 3 timeframes from M5-M30. The EA uses trading on such indicators as CCI, Standard Deviation, Moving Average, Relative Strength Index, Momentum and MACD . The EA looks for small price deviations by indicators and uses 3 types of economic news to confirm the position opening. Adaptive breakeven, trailing stop , and partial position clo
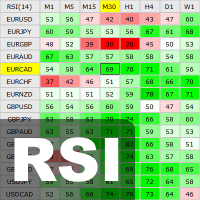
This indicator shows the current RSI values for multiple symbols and multiple timeframes and allows you to switch between timeframes and symbols with one click directly from the matrix. With this indicator, you can analyze large number of symbols across multiple timeframes and detect the strongest trends in just a few seconds.
Features Shows RSI values for multiple symbols and timeframes simultaneously. Colored cells with progressive color intensity depending on the RSI values. Ability to chan

The utility refers to probabilistic analysis tools, in particular the Monte Carlo method. The Monte Carlo method is defined as the simulation of processes in purpose to evaluate their probabilistic characteristics and apply them to the solvable task.
Operation features The simulation uses a tick model with the subsequent transformation to the candles form, as a model as close as possible to the real market process. The utility generates a stream of a random tick sequence until a result with t

This indicator shows the remaining time for the candle to close, even if the price does not change in value, the clock keeps counting backward. You can also program price alert levels using trend lines.
It can be used together with Expert Advisors and other panels, such as Controller without limit MT5
MT4 version
Instructions To set a price alert level, you must draw a trend line. Once the object has been drawn, it must be named so that the indicator recognizes the object. In the

This is a complete and customizable Trading HUD (Head-Up Display) combining all important tools and information for professional trading in one window. Features:
1. Display key indicators that most professionals consider for their trading decisions Current daily, weekly and/or monthly Pivot Points with 7 Levels (PP, S1, S2, S3, R1, R2, R3) Complete history of daily, weekly and/or monthly Pivot Points Current level of exponential moving averages (EMAs) from different timeframes. The User can de
The Expert Advisor allows you to build a trading system based on a custom indicator. It performs automated opening/closing of trades based on the signals of arrow indicators (which buffer values other than 0 and EMPTY_VALUE) or color lines. The EA polls the values of the specified indicator buffers, opens/closes and accompanies trades according to the specified parameters.
The Expert Advisor implements the following trade support functions:
-installation of SL and TP; -calculation of th

Market profile was developed by Peter Steidlmayer in the second half of last century. This is a very effective tool if you understand the nature and usage. It's not like common tools like EMA, RSI, MACD or Bollinger Bands. It operates independently of price, not based on price but its core is volume. The volume is normal, as the instrument is sung everywhere. But the special thing here is that the Market Profile represents the volume at each price level.
1. Price Histogram
The Price Histogram

Price action is among the most popular trading concepts. A trader who knows how to use price action the right way can often improve his performance and his way of looking at charts significantly. However, there are still a lot of misunderstandings and half-truths circulating that confuse traders and set them up for failure. Using PA Trend Reversal will be possible to identify high probability exhaustion moves of a trend. Features The indicator gives alerts in real-time when the conditions are me

Renko graph The Renko indicator in the main chart window at the location with the current price. The indicator displays price changes in the form of rectangles ("bricks") against the background of a regular quote chart. The upward movement of the price, by the number of points specified in the settings, is marked by adding above the previous next rectangle, and downward movement - below the previous rectangle. The indicator is designed to visually identify the main trend. Used to identify key su
Master KIT GET YOUR STRATEGY READY-MADE EA
Scalping / trend / countertrend / flat = all in one, only the mood!
FORTS and FOREX
The possibilities of the EA are huge. Combinations of settings allow you to implement any strategy.
Uses a complex, reliable main system of increasing the volume with a simple setup
POSSIBLE SETTINGS:
Direction-BUY Only, SELL only or auto-select direction by RSI indicator The first volume Maximum trade lot Volume multiplicity-how many times to increas

The script opens a separate window and displays information about the current open positions in it.
The informer will be useful to those who operate with a large number of positions open on different instruments in different directions.
It allows you to quickly decompose the loading of the deposit by instruments, visually identify the most tense places in the aggregate position. For the exposed stop orders, it calculates the total risks and goals.

Slick The indicator is a double-ironed Relative Strength Index (RSI) with alert signals for making trading decisions. The indicator follows the price, its values range from 0 to 100. The scope of the indicator is the same as that of the regular RSI indicator. Description of indicator settings: Period_1 - period for calculating the index Period_2 - primary period of indicator smoothing Period_3 - secondary period of indicator smoothing MAMethod - anti-aliasing method AppliedPrice - price consta

WavesTrends This oscillator is one of the market indicators used when the price fluctuates within a certain range. The oscillator has its own boundaries (upper and lower), when approached, the market participant receives information about the oversold or overbought market. The indicator registers price fluctuations within the limits of a certain volatility. If the oscillator signal is confirmed by the price chart, then the probability of a trade will increase. This direction is reflected in th

This is Gekko's customizable version of the famous Heiken Ashi indicator. It extends the use of the famous Heiken Ashi and calculates strong entry and exit signals. Inputs Number of Bars to Plot Indicator: number of historical bars to plot the indicator, keep it low for better performance; Produce Arrow Signals: determine if the indicator will plot arrow signal for long/short; Produces Signal Only When a Bar Closes: wait for a bar to close to produce a signal (more accurate, by delayed entry

BinaryPinMt5 is an indicator developed and adapted specifically for trading short-term binary options. The indicator's algorithm, before issuing the signal, analyzes many factors, such as market volatility, searches for the PinBar pattern, calculates the probability of success when making a deal. The indicator is set in the usual way. The indicator itself consists of an information window where the name of the trading instrument is displayed, the probability of making a successful transaction,

The EA uses two strategies, the first trend strategy the second reverse strategy can be enabled or disabled through the settings. The EA has been optimized for the last 10 years. The adviser uses a variety of indicators such as Bollinger Bands , Moving Average , Momentum with different settings for the most accurate signals. To close positions, stop loss and take profit are used, as well as additional methods of order modifications. Very easy to set up, does not require special knowledge. You c

Delta EMA is a momentum indicator based on the changes of closing price from one bar to the next. It displays a histogram of the exponential moving average of those changes, showing magnitude and direction of trend. Positive delta values are displayed as green bars, and negative delta values are displayed as red bars. The transition from negative to positive delta, or from positive to negative delta, indicates trend reversal. Transition bars that exceed a user specified value are displayed in br

Tarzan The indicator is based on the reading of the relative strength index.
The fast line is the index readings from the senior period, it is redrawn for the number of bars that fit into one bar of the senior period, for example: if the indicator readings from the H4 period are set and the indicator is set to M15, the redrawing will be 16 bars on the M15 period.
The slow line is a smoothed moving average index.
The indicator uses different types of signals to make trading decisions, depend

Панель предназначена для быстрого визуального нахождения и отображения внутренних баров по всем периодам и на любых выбранных валютных парах одновременно. Цвет сигнальных кнопок, указывает на направление паттерна. По клику на сигнальную кнопку, осуществляется открытие графика с данным паттерном. Отключить не используемые периоды, можно кликом по его заголовку. Имеется поиск в истории (по предыдущим барам). Прокрутка (scrolling) панели, осуществляется клавишами "UP" "DOWN" на клавиатуре. Имеется

Rush Point System
It is a detector indicator of breakage of support and resistance with continuity force.
Operation:
The Rush Point System detects in real time when a buying or buying force exceeds the spread limits in order to consume large quantities of lots placed in the book, which made price barriers - also called support / resistance.
At the very moment of the break, the indicator will show in the current candle which force is acting, plotting in the green color to signal purchasin

Rush Point Histogram Continuity force indicator. Operation: After a breach of support or resistance of an asset, the trader can understand by reading the histogram if such a move tends to continue, thus filtering false breaks or short breaks without trend formation. Through a simple, level-based reading, the trader can make a decision based on the histogram, where: Below 21: No trend formation 21 to 34: Weak trend 34 to 55: Strong Trend 55 to 89: Strong tendency Suggested Reading: Observed disru

Мультитаймфреймовый индикатор показывает спрос и предложение, вырожденный через тиковый объем. Индикатор разделен на 3 зоны. Зона снизу показывает спрос и предложение текущего временного периода. Выше нее располагается значения показывающий таймфрейм старшего периода. В верхней зоне располагается отображение таймфрейма на 2 больше текущего. Пример: основной временной период 1 минута - будет отображаться в нижней зоне индикатора. Выше нее расположится 5 минутный период. В 3 зоне расположится 1

MMM Commodity Channel Index Mapped Timeframe Strategy: The Expert Advisors uses its two built-in CCI indicators in 12 different timeframes to determine the prices trends and calculates the signal to decide to open buy or sell positions; You can define the time period of each day of the week the EA should not trade (the bad time to trade). Usually the period of day when the impact news are published. This way the EA will trade only on good hours. General Inputs Closes orders with any profit of va
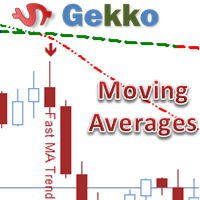
his is Gekko's Moving Averages indicator. It extends the use of the famous moving averages and calculates strong entry and exit signals using Price versus a Fast Moving Average versus a Slow Moving Average. You can set it up in many different ways, eg: price crossing, moving averages crossing, moving averages trend, among others.
Inputs Number of Bars to Plot Indicator: number of historical bars to plot the indicator, keep it low for better performance; FAST Moving Average Details: settings f

The indicator Universal Separate Window MT5 works according to your rules. It is sufficient to introduce a formula, along which the line of the indicator will be drawn.
This indicator is intended for use in the separate chart window.
All indicators of the series Universal :
Main window Separate window Free MT4 Universal Main Window Free MT5 Universal Main Window Free MT5 MT4 Universal Separate Window Free MT5 Universal Separate Window Free MT5 Full MT4 Universal Main Window MT5 Universal Ma

The indicator Universal Main Window MT5 works according to your rules. It is sufficient to introduce a formula, along which the line of the indicator will be drawn.
This indicator is intended for use in the main chart window.
All indicators of the series Universal :
Main window Separate window Free MT4 Universal Main Window Free MT5 Universal Main Window Free MT5 MT4 Universal Separate Window Free MT5 Universal Separate Window Free MT5 Full MT4 Universal Main Window MT5 Universal Main Windo

Советник FX Ilan Plus -это аналог советника, с добавлением множества дополнительных логик и возможностей для торговли, с оставленными настройками советника . Советник торгует по системе Мартингейл с увеличением последующих лотов в серии ордеров, с целью их усреднения. Первый ордер робот выставляет по сигналам встроенного индикатора. Так же советник имеет возможность прекращать торговлю в зависимости от новостей. FX Ilan Plus можно использовать либо на одном графике, либо на двух графиках в проти

The indicator identifies divergences between chart and RSI, with the possibility of confirmation by stochastics or MACD. A divergence line with an arrow appears on the chart when divergence is detected after the current candle has expired. There are various filter parameters that increase the accuracy of the signals. To identify a divergence, point A must be set in the RSI, then point B Value must be edited, which sets the difference between point A and point B. The indicator can be used for tim

This is a multi-currency paired trading system.I won't go into the details of how it works, but what the user needs to care about is how it actually works. It is highly recommended that you download the product and test it thoroughly, including back testing with the historical data and foward testing in the simulated account. As this EA trades multiple currency pairs, relevant historical data will be automatically downloaded at the first time of its historical review, with data volume around 6GB

"Just copier" is designed to copy trading without any complicated settings. The copy can be done in one PC. One EA can be set as master (provider) or slave (receiver). The receiver lot can be set to multiple providers lots. Please also check this product at fxina.hostingerapp.com. Any type of copy is available. MT4 -> MT5 MT4 -> MT4 MT5 -> MT5 MT5 -> MT4 If you want to copy MT4 -> MT5 or MT5 -> MT4, please purchase "Just copier" for MT4 and "Just copier" for MT5 separately. Just Copier can copy

This QuickClose help you to close all orders having profit immediately with only ONE CLICK, its work is very fast. You can choose which symbol you want or close all symbols so it will helpful for you in your trading to manage trading faster. This EA can quick close all Buy and Sell Orders by a selected symbol or total, And delete all pending orders. This SymbolButton is designed for closing orders. There is available Manual and Automatic closing functions. Automatic closing function will close t

Exit based Indicator - What is it? Exit your open positions based on up to 10 indicators. Even those you buy in Market !!! Use any indicator that provides buffer values (most of them output buffers). You can use any available buffers and even compare various indicator values. Selectors for exiting Buy Positions and Sell Positions are separate. The EA works in AND or OR mode. You can combine multiple instances to create elaborate rules. NO BROKER SIDE STOP LOSS IS USED.
Usage Ideas / Examples -

This version of the AshiMomentum multicurrency Expert Advisor works based on short-term changes in the trend, creating the price "corridor" set in the parameters. Trading is carried out at the external borders of this corridor by opening positions in different directions with different lot sizes. This achieves a very high probability of closing positions in profit.
AshiMomentum is intended for trading any currency pair on the M1 timeframe or higher.
No martingale, no arbitrage.

The indicator shows supply and demand degenerated through tick volume.
The red line is the supply line.
The blue line is the demand line.
The green line is the total volume line.
Typical situations of indicator readings:
red is higher than blue - supply is higher than demand - the price is falling. blue is higher than red - demand is higher than supply - the price is growing. the red and blue lines tend to go down, but the blue is above the red - demand prevails, the price rises, but
Il MetaTrader Market offre un luogo pratico e sicuro dove acquistare applicazioni per la piattaforma MetaTrader. Scarica versioni demo gratuite di Expert Advisors e indicatori direttamente dal tuo terminale e testali nello Strategy Tester.
Prova le applicazioni in diverse modalità per monitorare le prestazioni ed effettuare pagamenti per i prodotti desiderati, utilizzando il sistema di pagamento MQL5.community.
Ti stai perdendo delle opportunità di trading:
- App di trading gratuite
- Oltre 8.000 segnali per il copy trading
- Notizie economiche per esplorare i mercati finanziari
Registrazione
Accedi
Se non hai un account, registrati
Consenti l'uso dei cookie per accedere al sito MQL5.com.
Abilita le impostazioni necessarie nel browser, altrimenti non sarà possibile accedere.