Guarda i video tutorial del Market su YouTube
Come acquistare un Robot di Trading o un indicatore
Esegui il tuo EA
hosting virtuale
hosting virtuale
Prova un indicatore/robot di trading prima di acquistarlo
Vuoi guadagnare nel Market?
Come presentare un prodotto per venderlo con successo
Nuovi Expert Advisors e Indicatori per MetaTrader 5 - 98

Trade with an edge by using the Trader Starter Kit. This powerful assistant was built to help all types of traders. It uses the T.A.E framework to analyze the chart in order to provide a filtered view of the market. T: Trend - Identified by checking for a series of higher highs and higher lows or lower highs and lower lows A: Area of value - Identified through a trading range calculation that obeys the rules of buy low and sell high E: Entry-trigger - Identified by analyzing candlesticks for var
FREE
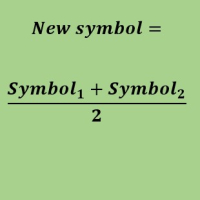
Create a new custom symbol based on average of Multiple arbitrary symbols (for MT5)
An Expert Advisor (EA) used to create custom symbol by averaging multiple input symbols (e.g. EURUSD and GBPUSD) and provide real-time updates. This is an MT4 "offline" chart equivalent which is very simple to use.
You can attach any MT5 compatible indicator or template to this new symbol and perform your technical analysis. You can back-test any EA on this new custom symbol in strategy tester. for example
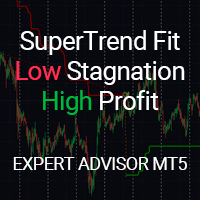
Questo strumento di trading esperto utilizza l'indicatore SuperTrend con una potente metrica di ottimizzazione personalizzata per aiutare i trader a trovare i migliori sistemi con bassa stagnazione e alto profitto netto.
I trader entrano in una posizione (lunga o corta) quando la barra si apre sopra o sotto la linea dell'indicatore. È possibile uscire dalla posizione quando il prezzo "inverte" il suo segnale o non uscire e lasciarlo chiudere in base ai rischi (Take profit, stop loss) o all'us

Trend Panel è uno strumento semplice e conveniente che visualizzerà una direzione di tendenza confermata degli intervalli di tempo M1 - D1 utilizzando dieci coppie scelte dall'utente.
L'indicatore è progettato per aggiungere la conferma della direzione a qualsiasi strategia/modello e quindi funzionare anche come un'interfaccia interattiva pulita per cambiare rapidamente il grafico con una coppia o un periodo di tempo diverso. Chat di gruppo: https://www.mql5.com/en/users/conorstephenson Vi p
FREE

Questo indicatore utilizza i cosiddetti numeri "malvagi" come coefficienti di peso. Il loro opposto sono i numeri "odiosi", presentati anche in questo indicatore. La divisione dei numeri in queste due classi è associata al peso di Hamming, che è determinato dal numero di unità nella notazione binaria di un determinato numero. Utilizzando questi numeri come fattori di ponderazione si ottiene un indicatore di tendenza. Inoltre, i numeri odiosi forniscono un indicatore più sensibile e i numeri mal

Golden God usa l'apprendimento automatico. Fai trading su XAUUSD 1 HR time frame o altri time frame scambiando l'OHLC come logica. Imposta il rischio di equilibrio negli input, 5% di default. Controlla i lotti massimi da prendere. Tutte le operazioni hanno stop e take profit. Questo EA opera attivamente. Fai trading su una demo e vivi in quanto non si basa su indicatori. Provalo in tempo reale, non è come molti EA che utilizzano indicatori. Questo EA non utilizza indicatori

EA Goldlytic use a trend built-in indicator. It's specifically designed for trading the XAUUSD (GOLD) but can be used with other assets (forex, crypto...).
The Expert Advisor opens an order based on a signal from the indicators and fixes the profit at a certain level with the ability to open order basket For best results, it is recommended to cancel the direction of trade on the EA panel on the chart Since this is a trend-following Expert Advisor, we recommend disabling the Expert Advisor in

The indicator plots a trend channel using the technique by Gilbert Raff. The channel axis is a first-order regression. The upper and lower lines show the maximum distance the Close line had moved away from the axis line. Therefore, the upper and lower lines can be considered as resistance and support lines, respectively. A similar version of the indicator for the MT4 terminal
As a rule, most movements of the price occur within a channel, going beyond the support or resistance line only for a s
FREE
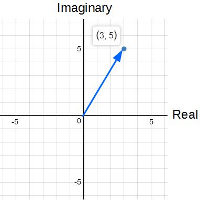
ComplexVector is an indicator based on market analysis using the mathematical apparatus of complex numbers. The essence of the indicator is that it, with clear impulses, indicates the points in time when it is necessary to make decisions. The impulses are like a cardiogram showing the heartbeat of the market.
For example: it may be the moment of planning a new entry. this may be the moment to exit the position. if you work with a series that is in a drawdown, you are recommended to close it i

You can see Binance Futures data instantly in Metatrader 5 and it allows you to use all the features that Metatrader has provided to you.
You can access the data of all symbols listed on Binance Futures. Don't forget to set the timezone. Binance it's 00:00 UTC. You need to fix it according to your own country You need to pre-install the free Binance Future Symbol List plugin. https://www.mql5.com/tr/market/product/82891 After loading, it automatically downloads the data of the cryptos in the

Adds the symbols listed in Binance Future to Metatrader5
With this free file, you can list the entire list right away. You can easily install it on your demo account It is the first file to be uploaded for Binance Future Tick and is offered for free.
Tools menu / Options / Expert Advisors / You need to select Use WebRequest for listed
You can watch videos to add metatrader
FREE

The tool is intended to help traders who cannot look at the chart all the time, or who use several charts, the trader can mark regions of interest as supports and resistances and as soon as the price approaches these regions an audible warning and on the screen will be presented for the trader to take some action, in addition the tool can automatically mark the highs and lows of the day and time.
FREE

1. Торговая стратегия Что делает советник: Советник следит за некотоными индикаторами и при определенном условии (или условиях) помещать торговый запрос (на продажу или покупку) в зависимости от условий. Стратегия:
Используем индикатор Moving Average (скользящие средние) с периодом 8 (вы можете выбрать любой период, но в данной стратегии мы будем использовать период 8). Советник покупает, если 8-периодная скользящая средняя (далее для удобства будем называть ее MA-8) возрастает и текущая цена з
FREE

Think of the Super Fractal Indicator as the Bill WIlliams Indicator on Steroids. Indicator Abilities: 1. Adjust Candle around Fractal High or Low. 2. Adjust Lookback period and only plot for a specific number of history candles avoiding cluttering your trading desk. 3. The Indicator uses buffers so you call and use it from any EA.
Note : The higher the candles around Fractal, the stronger the Turning point anfd viceversa is true.
FREE
BOOM Killer Pro
Here is an excellent robot that will allow you to trade the Boom with some ease. The strategy used allows through a combination of Buy and Sell to ensure that you are always in blue. The robot is set to stop losses at -150 and this is obviously configurable. This will rarely happen if the following recommendations are followed. Some practical recommendations: Use the robot in clear upward or downward trends. Avoid using the robot in the ranges Boom 1000 recommended for robot Ti

The ADX indicator (average directional index) is a technical tool designed to measure the strength of a market trend. The ADX indicator is used for various purposes such as measuring the strength of a trend, finding a trend and a trading range, and as a filter for various Forex trading strategies.
Some of the best trading strategies are based on following the market trend. There are also strategies through which traders make profit by trading against the trend. In any case, if you can identif
Crash Killer Pro
This robot automatically assists you in trading the Crash index. However, knowledge of reading the trend is necessary to avoid losses. Launch the robot only in clear periods of trends either uphill or downhill. Some recommendations: Check trend with 1h timeframe Crash 1000 recommended for robot Timeframe 1 minute Minimum capital 300 You can use default settings or adjust.

The Outside The Box (OTB) is a complete trading system that provides the user with immense trading ability by highlighting on the chart areas where the trader should prepare to Re-enter the trend after pullbacks (Pullback trading strategy) Take partial/complete profit(Profit taking strategy), and Trade breakouts (Stock breakout strategy) - We have updated the indicator to show/hide Micro breakout areas around the major breakouts (Micro Breakouts). The above is supported by an alert system to no

What is this indicator? This indicator is a plugin of MT5's FX verification software " Knots Composito r". You can take a screenshot of the entire chart by pressing the hotkey and save it to a specified folder.
Features
- Screenshot the entire chart by pressing the hotkey. - Saves the screenshot image in the sandbox folder specified by the relative path. - Show the time of Common Thread on the screenshot image. - Play the screenshot sound.
How to open the sandbox folder 1. Hold down th
FREE

What is this indicator? This EA is a plugin of MT5's FX verification software " Knots Composito r". You can open, change and close positions just like in a real trade.
The profit and loss of all positions is recorded in account.
How to set up
1. Download all historical data for the target currency pair to calculate the profit of the position in dollars. 2. Open the chart of the target currency pair and scroll to the end in the past direction. 3. If the target currency pair is a cross cur
FREE

What is this indicator? This indicator plots a customized text object as a note at any point on the chart. To plot the text object, press the hotkey and then click at any point on the chart. You can also add your favorite words and sentences to the template and plot them.
How to stick a note 1. Press the hotkey to enter sticky mode. 2. Click any point to stick. 3. Edit the text of the text object plotted as a note.
About sticky mode
This mode is for plotting a text object as a note. If
What is this indicator?
This indicator controls the visibility of graphic objects on the chart when the hotkey is pressed. If you switch on, the graphic objects will be hidden. If you switch off, the graphic objects will be shown. You can specify the object to control with object type.
List of supported object types - Vertical Line - Horizontal Line - Trendline - Trendl By Angle - Cycle Lines - Arrowed Line - Equidistant Channel - Standard Deviation Channel - Linear Regression Channel - An

What is this indicator? This indicator stamps any customized number at any point on the chart. To stamp any number, press the hotkey (0–9) and then click at any point on the chart. You can also stamp a series of numbers to indicate a chart pattern. (Each number synchronizes modification)
How to stamp any number
1. Press the hotkey (0–9) to enter stamping mode. 2. Click any point to stamp.
How to stamp a double top/bottom pattern 1. Press the hotkey to enter stamping mode. 2. Click any p

What is this indicator? This indicator draws a customized vertical, horizontal, or trend line at any position on the chart. To draw each line, press the hotkey and then click at any point on the chart. Each drawn line is synchronized with other charts by timeframe. (Each chart requires this indicator to be installed)
How to draw a vertical or horizontal line 1. Press the hotkey to enter drawing mode. 2. Move the mouse to any point. 3. Click to draw the line.
How to draw a trendline 1. Pr

What is this indicator? This indicator draws a customized Fibonacci retracement or expansion at any position on the chart. To draw the object, press the hotkey and then click at any point on the chart. Each anchor point magnets to the high or low price of the nearest bar on the chart.
How to draw
1. Press the hotkey to enter drawing mode. 2. Click any point to draw. 3. Drag and drop each anchor point to adjust if needed.
About drawing mode
This mode is for drawing a Fibonacci retracem

The purpose of the inidcator is to identify the reversal point.
The blue arrow is buy signal and the yellow star is its stop loss. The red arrow is sell signal and the yellow star is its stop loss. Please note that the singal is against trend,it could be continual fail. Alert feature: if there is a signal, the indicator will send alerts of popup window,email or mobile push. Inputs: Popup Window Alert: it is false in default Email Alert : it is false in default Mobile Push Alert: it is false in

In the scalping strategy "Reliable Scalper" we will use movings. The peculiarity of the strategy is that the use of moving averages underlies many other indicators - RSI, MACD, etc., which means that you can use it. We will not clutter up the currency pair chart with all sorts of clever and complex indicators, whose signals can be directly opposite - instead, we will simply use moving averages.
It is common knowledge that moving averages themselves are a lagging indicator. From this we conclu

Abab professional expert system developed for market analysis based on Parabolic SAR indicators and two Moving Averages. Like other trading robots, this robot is based on technical analysis methods. The indication is based on two Moving Averages and Parabolic SAR. This is one of the most obvious assistants, absolutely indispensable for trading. Similar models are used by many professional traders. A trader using this robot can automatically follow a position, avoiding a stop loss, but approachi

Very powerful indicator! converted from TradingView with upgraded alerts and added notifications. Ideal use in EAs.
Use as a supplementary Indicator to confirm your entries, but it is as good on it's own.
The indicator consists of 3 different Trend Meters and a 2 Trend Bars which are used to confirm trend
How to Use:
The more Trend meters are lit up the better =>>
-more GREEN COLOR at one bar means more confirmation to open buy trade,
- more RED COLOR signals for one bar = more

The Spots Indicator can be used for Entering and Exiting your trades based on the common candlestick patterns such as: engulfing, hanging man, doji etc. It is designed to publish desktop and mobile notification every time a signal is triggered. However, it is worth noting that this indicator is recommended to be used with other indicator for confirming the entries. It is best to use it with the Investment Castle Trend Lines indicator and the Supply and Demand indicator .
FREE
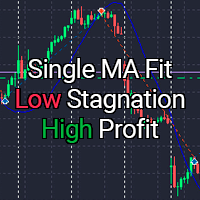
!!! Current price of $30 will be soon increased to $50, so if you want to get a discounted price this is your last chance !!! Look at the screenshots to see how profitable this Expert Advisor is!!! This expert advisor has nine types of moving average to choose and a powerful custom optimization metric so you can find the best systems with low stagnation and high net profit for any asset. You enter the position long when bar opens above Moving Average Line and reverse it (close the buy and open

Indicator alerts for Dual Relative strength index rsi. Large rsi preset at 14 is below 30 small rsi preset at 4 is below 10 for buy bullish signals .
Large rsi preset are 14 is above 70 small rsi preset at 4 is above 90 for sell bearish signals . Includes mobile and terminal alerts. draws lines when alerts.
This indicator can help identify extremes and then the tops or bottoms of those extremes .
FREE

Starting sale price is 159$ The next price will be 299$. So grab yours now! Stallion expert advisor is the product of years of research, development, and testing. This EA uses two price action strategies for entering a position and recovering the lost trades. Every position has its specific stop-loss and take-profit but by increasing lot-size EA will recover losses. with all that said the drawdown is often fairly low. minimum balance 500$, recommended balance 1000$. minimum leverage: 1:500, rec
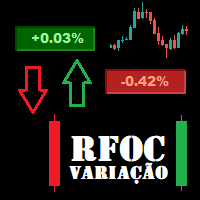
O Produto RFOC Variação Diária apresenta a função de indicar no gráfico a variação, em porcentagem, do preço em relação ao preço de fechamento do dia anterior.
O indicador permite configurar 100% da coloração para variações de alta, baixa e neutra (0.00%).
O painel com a apresentação da variação diária do preço fica fixada na parte superior do gráfico, e se ajusta automaticamente no centro da janela.
FREE

Funciona como bandas de bollinger normais. Criado por Joe Ross, é um setup de maior risco por ser contra-tendência. Pode ser usado para Day Trade, Swing Trade e Position. Para identificar, é necessário inserir no gráfico as Bandas de Bollinger, com uma Média Móvel Simples de 20 períodos e largura (desvio) 2. Verifica-se um fechamento de determinado candle abaixo da banda inferior de Bollinger. Se o próximo candle fechar dentro das Bandas, marca-se a máxima dele. O rompimento dessa máxima será o
FREE
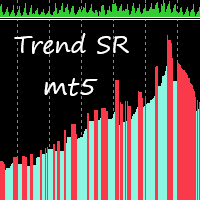
This indicator takes input from Support and Resistance levels, combined with a special trend filter. Easily spot tops and bottoms, and trade with more confidence. Great for scalping. This indicator can be used on all time frames and pairs. Features alert function.
No need to set up the indicator.
How to use: Simply attach to any chart. Zoom chart out completely. Red histogram line color = Selling opportunities. Blue histogram line color = Buying opportunities. See pictures below. To spot high
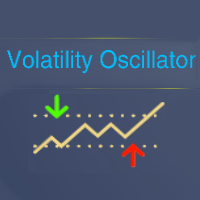
Tool converted from tradingview indicator. Modified version with pivot points calculated in a more intuitive way.
This tool displays relative volatility and directional trend. Excellent way to pickup diversions and reversals. Length can be lowered to 11 or 13 in settings to show price range.
Can be used to identify patterns such as parallel channels and likely direction of price action.
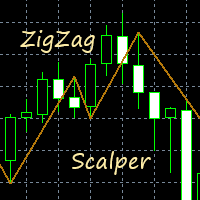
This indicator gives you a modified ZigZag, combined with a trend filter. Great for scalping. Perfect for channel trading. Features alert functions. No need to set up the indicator. How to use: Simply attach to any chart. Buy when the golden line stops below the price. Sell when the golden line stops above the price. It also helps to keep the audible alert set to true. Best results when checking two or more timeframes before entering trades on the lower time frames. Use as you see fit for your

This Expert trades macd crosses , using ADX and AC. Designed for 4hr EURUSD trading but able to trade major pairs. Code is designed for speedy metatrader optimisation using open price testing as ea uses open prices on indicators used. EA identifies trends with specific momentum and exits using the ADX or stop loss. Please optimise using out of sample data. preset at 0.1 lots best to start with 0.01 lots.
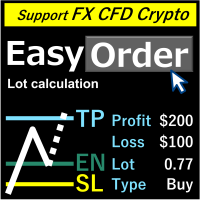
Panoramica Basta spostare le linee, il lotto viene calcolato automaticamente compilando l'importo del taglio delle perdite. È possibile calcolare le seguenti otto valute. (USD, EUR, GBP, JPY, AUD, NZD, CHF, NZD) È possibile selezionare l'importo fisso o il rapporto di saldo. Calcola i premi di rischio. L'ordine di mercato, l'ordine limite e l'ordine di arresto vengono applicati automaticamente. Supporta FX, CFD e Crypto Currency. Attenzione
La "Versione di prova gratuita" non funziona. Puoi s

Questo Expert Advisor utilizza l'indicatore Trend Wave e può identificare l'inizio e la fine di un nuovo movimento di tendenza dell'onda. In quanto oscillatore, l'indicatore identifica le zone di ipercomprato e ipervenduto. Funziona benissimo per catturare le inversioni di prezzo a breve termine e utilizza una strategia martingala per chiudere tutte le operazioni in profitto. Usa le impostazioni predefinite su un intervallo di tempo m15 o superiore su qualsiasi coppia per scambi più accurati! H
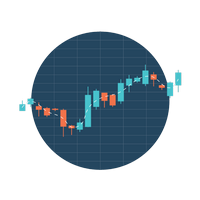
Lo scopo principale di questo esperto di trading è svolgere le funzioni di un trailing stop. Non apre o chiude posizioni, ma imposta e sposta solo i livelli di take profit e stop loss. Per calcolare il take profit e lo stop loss si utilizzano le statistiche sul movimento dei prezzi e l'aspettativa morale di D. Bernoulli. Per questo motivo, i nuovi livelli impostati dall'esperto forniscono la migliore (tra le possibili) opzione in termini di rapporto rischio/rendimento. Diamo un'occhiata ai para

I livelli dell'intervallo di pivot centrale sono formati attorno a un punto di perno centrale.
Questi livelli in relazione al perno centrale possono essere utilizzati per determinare numerosi comportamenti di mercato e possibili risultati.
La distanza dal perno centrale e il prezzo che i nuovi livelli formano rispetto ai livelli del giorno precedente possono essere utilizzati per determinare la direzione e la forza del trend dei giorni successivi.
I Central Pivot Ranges possono fungere da
FREE

Livelli istituzionali / Livelli bancari ... Livelli psicologici / Teoria dei quarti.
Questo indicatore disegnerà automaticamente ai livelli "000, 200, 500 e 800", quelli che conosco come "Livelli istituzionali", OPPURE, può anche disegnare i livelli "000, 250, 500 e 750" sul grafico.
A seconda di dove hai appreso la teoria del trading a livello istituzionale / dei trimestri, potresti conoscerli come nomi diversi, essenzialmente l'idea centrale è che questi livelli agiscano come forti punti
FREE

“Praticamente tutti possono perdonarci l'onestà: e, diciamo, un gioco non sufficientemente professionale, e persino una poesia non sufficientemente professionale. Ci sono molti esempi di questo. Ma quando l'onestà scompare, nulla è perdonato".
Golden Rings - Il robot finanziario Forex offre opzioni per trovare operazioni redditizie anche in mercati instabili quando l'attuale direzione del trend non è chiara. Seguirà la migliore tendenza per massimizzare i profitti e ridurre le possibilità di
L'utilità controlla qualsiasi parametro di qualsiasi indicatore scorrendo la rotellina del mouse. È possibile installare questa utility e modificare l'interfaccia di qualsiasi indicatore dalla fornitura standard del terminale . Per gli indicatori personalizzati, così come quelli acquistati su "Market", c'è L'utilità Universal Scroller .
Principio di funzionamento L'utilità controlla una delle opzioni selezionate modificandola scorrendo la rotellina del mouse. L'attivazione della modalità di s
FREE
L'utilità controlla qualsiasi parametro di qualsiasi indicatore, scorrendo la rotellina del mouse. Se hai acquistato o noleggiato un indicatore, puoi modificarne l'interfaccia utilizzando questa utility. Qualsiasi indicatore che abbia almeno un parametro intero è adatto a questo.
Se vuoi prima provare come funziona, scarica l'indicatore Standart Scroller gratuito per controllare gli indicatori dalla fornitura standard del terminale.
Principio di funzionamento L'utilità controlla una delle

L'indicatore TickCounter conta i tick avanti e indietro su ogni nuova barra.
Il calcolo inizia dal momento in cui l'indicatore viene posizionato sul grafico.
Le barre dell'istogramma rappresentano: Barre gialle - numero totale di tick; Barre blu - tick UP; Barre rosse - segni di spunta GIÙ. Se la barra blu non è visibile, ci sono più segni di spunta verso il basso e la barra rossa viene visualizzata sopra quella blu (il livello rosso è sopra quello blu). MT4 version: https://www.mql5.com/e

OTTIENI ALTRI EA GRATIS!!! OTTIENI ALTRI EA GRATIS!!! OTTIENI ALTRI EA GRATIS!!! OTTIENI ALTRI EA GRATIS!!! OTTIENI ALTRI EA GRATIS!!!
USD Scalper MT5 è un EA neurale per coppie USD. Questo prodotto è realizzato per GBPUSD, EURUSD, AUDUSD, NZDUSD. Potrebbero esserci nuove COPPIE aggiunte in futuro.
COPPIE ATTUALI:
GBPUSD
EURUSD
AUDUSD
NZDUSD - VERRÀ AGGIUNTO NELLA PROSSIMA VERSIONE
INGRESSI:
RISCHIO PERCENTUALE DI RISCHIO BASATO SU STOP LOSS (se si seleziona 1, il rischi

RISULTATO WA_PV_BOX_EFFORT X per MT5 Il WAPV Box Effort x Result Indicator fa parte del gruppo Package Indicators (Wyckoff Academy Wave Market). L'indicatore WAPV Box Effort x Result Indicator per MT5 ti aiuta a leggere il prezzo e il volume. La sua lettura consiste nell'assistere nell'identificazione dello sforzo x risultato in onde create dal grafico. L'indicatore WAPV Box Effort x Result Indicator per MT5 quando la casella è verde significa che il volume è a favore della domanda e quando la c

L'indicatore di prezzo e volume WAPV per MT5 fa parte del set di strumenti (Wyckoff Academy Wave Market) e (Wyckoff Academy Price and Volume). L'indicatore di prezzo e volume WAPV per MT5 è stato creato per semplificare la visualizzazione del movimento del volume sul grafico in modo intuitivo. Con esso puoi osservare i momenti di picco del volume e i momenti in cui il mercato non ha interesse professionale Identifica i momenti in cui il mercato si muove per inerzia e non per movimento di "denaro

L'indicatore WAPV ADH Supply and Demand fa parte di una serie di indicatori chiamati (Wyckoff Academy Wave Market) L' indicatore WAPV ADH Supply and Demand per MT5 ha lo scopo di identificare il lato vincente tra acquirenti e venditori. La sua lettura è molto semplice, quando la linea verde è al di sopra della linea rossa la domanda è al comando, quando la linea rossa è al di sopra della linea verde l'offerta è al comando. Più positive sono le linee verde e rossa, più alto è il volume in ingress

L'indicatore Forex WAPV ADH Supply and Demand fa parte di una serie di indicatori chiamati (Wyckoff Academy Wave Market) L'indicatore WAPV ADH Forex Supply and Demand per MT5 ha lo scopo di identificare il lato vincente tra acquirenti e venditori. La sua lettura è molto semplice, quando la linea verde è al di sopra della linea rossa la domanda è al comando, quando la linea rossa è al di sopra della linea verde l'offerta è al comando. Più positive sono le linee verde e rossa, più alto è il volume

L'indicatore laterale Weis Wave Bouble per MT5 fa parte del toolkit (Wyckoff Academy Wave Market) L'indicatore laterale Weis Wave Bouble per MT5 è stato creato sulla base della già consolidata Weis Wave creata da David Weis. L'indicatore Weis Wave Double Side legge il mercato a ondate come è stato fatto da R. Wyckoff nel 1900. Aiuta a identificare sforzo x risultato, causa ed effetto e domanda e offerta Il suo differenziale è che può essere utilizzato sotto l'asse zero, migliorando ulteriormente

L'indicatore laterale Weis Wave Bouble per MT5 fa parte del toolkit (Wyckoff Academy Wave Market) L'indicatore laterale Weis Wave Bouble per MT5 è stato creato sulla base della già consolidata Weis Wave creata da David Weis. L'indicatore Weis Wave Double Side legge il mercato a ondate come fece R. Wyckoff nel 1900. Aiuta a identificare sforzo x risultato, causa ed effetto e domanda e offerta Il suo differenziale è che può essere utilizzato sotto l'asse zero e mostra un avviso di breakout Chi è f

VSA Candle Signal per MT5 fa parte del set di strumenti (prezzo e volume della Wyckoff Academy). La sua funzione è quella di identificare la correlazione di Prezzo e Volume nella formazione della candela. La sua creazione si basa sulle premesse di R.Wyckoff, un precursore nell'analisi del prezzo e del volume. VSA Candle Signal per MT5 aiuta nel processo decisionale, lasciando la tua lettura più chiara e fluida. Vedi le immagini qui sotto.

L'indicatore di forza e debolezza per il volume reale MT5 fa parte del set di strumenti (Wyckoff Academy Price and Volume) L'indicatore di forza e debolezza per il volume reale MT5 è stato sviluppato per identificare la forza e la debolezza del volume in modo accumulato. Consentendo la visione di un panorama tra prezzo e volume. L'indicatore può essere utilizzato come oscillatore e come istogramma. Come fantasia ha tutte le premesse delle tre leggi di R. Wyckoff se messe insieme al prezzo: Causa

L'indicatore di forza e debolezza per MT5 Forex fa parte del Toolkit (Wyckoff Academy Price and Volume) L'indicatore di forza e debolezza per MT5 Forex è stato sviluppato per identificare la forza e la debolezza del volume in modo accumulato. Consentendo la visione di un panorama tra prezzo e volume. L'indicatore può essere utilizzato come oscillatore e come istogramma. Come al solito ha tutte le premesse delle tre leggi di R. Wyckoff se messe insieme al prezzo: Causa ed effetto, sforzo x risult

Questo EA combina segnali dai canali di Keltner e altri indicatori, esegue compra e vendi contro l'andamento del time frame selezionato, grande assertività con selezione di parametri specifici per ogni asset. Idealmente, è necessario testare i parametri nel backtest per convalidare la strategia. Goditi il meglio che la tecnologia ha da offrirti. Se sei interessato ai miei preset individuali ti preghiamo di contattarci qui in chat o inviare una mail, vendas.mercadocapital@gmail.com.

This indicator is very useful for day traders or short term traders. (MT5 version) No need to calculate the number of pips manually, just look at the chart and you will see the Virtual Take Profit / Virtual Stop Loss target line and evaluate whether the entry point is feasible to reach the intended target or not.
Enter the intended Take Profit / Stop Loss pips for your trade. The indicator will display Virtual Take Profit / Virtual Stop Loss lines for you to easily see if the target i
FREE

User Grid MT5 is a multifunctional grid Expert Advisor designed to fully or partially automate various ideas related to grid trading (on a hedging account) . The Expert Advisor can trade on any timeframe, on any currency pair, on several currency pairs, on any number of signs. It does not interfere with manual trading, trading of other Expert Advisors, or the operation of any indicators. It allows you to adjust your settings on the fly, works only with your own positions and orders. It has a
This EA was developed for the Brazilian market in win active in all series of the year. A method of confluence of several indicators of moving averages, IFR and ATR is used. It uses the medium price technique to recover losses in a situation of reversal of movement, and can be enabled and parameterized. The goal is to gain 50 points at each entry, with only 1 contract the risk is minimized and the profit is gradual. Recognizes and avoids input at lateralization levels. It recognizes and advance

The EA uses a scalping strategy on a breakout, uses innovative advanced technologies using a Neural Network. To create the EA , we used the latest advanced algorithms to find the best moments to enter the market. The EA uses many smart filters to adapt to almost any economic situation. The EA sets a protective stop order, so the trader does not have to worry that the robot will allow significant drawdowns. The adviser is safe and does not require any settings from the user, just install it on th

The idea of a Value Chart indicator was presented in the very good book I read back in 2020 , " Dynamic Trading Indicators: Winning with Value Charts and Price Action Profile ", from the authors Mark Helweg and David Stendahl. The idea is simple and the result is pure genius: Present candlestick Price analysis in a detrended way!
HOW TO READ THIS INDICATOR
Look for Overbought and Oversold levels. Of course, you will need to test the settings a lot to find the "correct" one for your approach.
FREE

1. What is this
This is a trading strategy about the market forming a box and then breaking out. It can trade major currency pairs and gold: EURUSD, GBPUSD, AUDUSD, NZDUSD, USDJPY, USDCAD, USDCHF, XAUUSD. It is not a scalping model, nor does it use Martingale's money management model. This strategy is mainly for steady profits.
2. Related instructions The timeframe is PERIOD_M30.
It works with Hedge accounts. Its internal strategy logic has been set, and only fund management is opened fo

MACD strategies EA is a EA that can support multiple MACD strategies. Purchasing this EA can save you the time taken to automate your existing MACD strategy through coding a custom EA and it also helps you discover profitable MACD strategies as its fully compatible with the strategy tester and all settings are editable. The EA supports both scalping, short term and long term strategies. The various supported settings are explained below: NOTE: The default settings in the EA are s

Resistance and Support is an easy to use indicator to apply horizontal lines of resistance and support. There are two windows for adding levels. When you press the button, a line appears on the price chart. It is possible to move this line with the mouse, thereby changing the indicator readings. In the indicator menu there is a choice of possible alerts - no alert, alert on touching the level and an alert for closing the candle after the level.
FREE

Everyone knows how to analyze the market , which level to buy / sell this is an easy job , which leads to unusual horrible loses , very little few people knows WHEN then enter the market , time is Money , this is the key!!!
This version is a Proof of concept limited version of ZamanCYcles founded here: https://www.mql5.com/en/market/product/81883?source=Site +Market+Product+Page This works Only on 3 Minutes Time frame for 45 Candles Get rest of planets and more than 10 other algorithms to pre
FREE

John Bollinger created this indicator in 2010 as a way to read the original indicator (Bollinger Bands) in a more "technical" way, shown as an oscillator. The typical range of the Bollinger Bands %B is 0 - 0.5 - 1.0, where "0" represents the lower band, the "0.5" the middle band, and "1" the upper band. The line on the indicator represents the Closing prices. As simple as that.
SETTINGS
Bollinger Bands period of analysis Standard Deviation multiplier Shift Price type to be analyzed
If you
FREE

Andrew Pitch fork is one of the most interesting string trend & Channel & Fibo technical analysis , it's like ALL in ONE tool would be very enough for you.
FYI, This indicator will expire by end of July 2022.
Using 2 Andrew pitch Forks with 2 different time frames on same chart is really very hard working and might be impossible , but with this indicator is possible now , moreover , using this method as Candle Volume based analysis give strong trust for your trade.
I assume if you are hav
FREE
MetaTrader Market - i robot di trading e gli indicatori tecnici per trader sono disponibili nel tuo terminale di trading.
Il sistema di pagamento MQL5.community è disponibile per tutti gli utenti registrati sul sito MQL5.com che effettuano transazioni su MetaTrader Services. Puoi depositare e prelevare denaro usando WebMoney, PayPal o una carta di credito.
Ti stai perdendo delle opportunità di trading:
- App di trading gratuite
- Oltre 8.000 segnali per il copy trading
- Notizie economiche per esplorare i mercati finanziari
Registrazione
Accedi
Se non hai un account, registrati
Consenti l'uso dei cookie per accedere al sito MQL5.com.
Abilita le impostazioni necessarie nel browser, altrimenti non sarà possibile accedere.