Guarda i video tutorial del Market su YouTube
Come acquistare un Robot di Trading o un indicatore
Esegui il tuo EA
hosting virtuale
hosting virtuale
Prova un indicatore/robot di trading prima di acquistarlo
Vuoi guadagnare nel Market?
Come presentare un prodotto per venderlo con successo
Nuovi Expert Advisors e Indicatori per MetaTrader 5 - 70

The RFOC Mini Chart was created to project a macro view of the market, which the option to select the timeframe of interest other than the main chart, it is possible to include 2 indicators:
In the full version it is possible to include 2 indicators: 1 - Moving average channel On the mini chart, the moving average will be created based on the prices of the selected time frame for the RFOC Mini Chart. The moving average period must be selected in the indicator settings pannel. 2 - Boillinger Ba
FREE
This EA is designed to automate Larry Connor’s System TPS - ( Time Position & Scale ) first described in his book “High Probability ETF Trading ” https://www.amazon.com/High-Probability-ETF-Trading-Professional/dp/0615297412 The operation of TPS can be summarized as follows: 1. Trade an ETF or Cash Index 2. The Index trades above its 200-day moving average 3. Open a 10% long position, if the 2-period RSI is below 25 for two days in a row 4. Increase position size by 20

An easy indicator that simply shows the moment we connect to the market. We can easily see what has happened while we were gone because the line has two different colors that show the start time. It is only that, a visualization aid that allow us to mark the market behavior while it was night time in our country, or if we have stopped several hours. Input: Server start working date: Day of month Month Year Hour Minutes
FREE

Potential loss on all active and pending trades: if SL levels will be reached (or the current floating loss if the SL level is not set) My #1 Utility: 65+ features, including this indicator | Contact me for any questions | MT4 version In the input settings you can adjust: Calculateion method : account currency / pips / points / % of the balance Position on the chart: bottom left / bottom right / top left / top right corner
Font: color, size and style Optionally you can include

Fast Trade Detector (FTD) - Самый правдивый индикатор, который показывает истинное
настроение Большого Игрока.
На бирже есть Игрок, у которого есть всё для того, чтобы быть в первых рядах в книге торговых
приказов (биржевом стакане). Эти сделки как индикатор рыночного настроения сильного игрока.
Вы поймёте, что всё не совсем так, как представляли раньше. Вам откроются алгоритмы и стратегии
крупного участника рынка. Исполнение индикатора в виде гистограммы в подвале графика. Гистогра

Supply / demand zones: observable areas where price has approached many times in the past. My #1 Utility: 65+ features , including this indicator | Contact me for any questions | MT4 version The indicator shows where the price could potentially be reversed again. Usually, the more times the price has been rejected from the level, the more significant it is. In the input settings you can adjust: Enable or disbale Weak zones; Show or hide zone description; Font size; Set the basi
Absolute volatility for each day for the last 4 weeks My #1 Utility: includes 65+ functions, including this indicator | Contact me if you have any questions The indicator is displayed in a separate window, it can be moved to any place on the chart. In the input settings you can adjust: Interface theme : dark / white; Calculation method: price, pips, points, % change;
Panel size Font size

Monitor your favorite Symbols My #1 Utility: includes 65+ functions, including this tool | Contact me if you have any questions This tool opens in a separate window: it can be moved (drag anywhere), and minimized [v]. You can adjust the Watchlist on the panel: Click [edit list] to add / remove the Symbols from the Watchlist. Calculated value: it may either be the last [closed bar], or the current [floating bar]. Select the [timeframe] for calculation. There are 2 types of the value sorti

This indicator like small script only attach on any chart. It will export All symbol name and property to CSV file. Location at MQL5/File/Data/ Format CSV Pattern like ["Symbol","Category","Sector","Industry","Description"] Example : "USDX","","Indexes","Undefined"","US Dollar Index" "Coffee","","Commodities","Commodities - Agricultural"","Coffee Cash Contract" "Airbnb_Inc_(ABNB.O)","","Communication Services","Internet Content & Information"","Airbnb Inc" "Akamai_Technologies_(AKAM.O)","","Tech
FREE

Good Day,
"Horse Trader" is an Expet Advisor and Trding Robot which is based on Technical Analysis Indicator. This Algorithm is developed with extensive research to give best results over a period of time. It is based of low loss high return principle that helps to cut losses when trade goes wrong and during profits it keeps running a trade so that maximum profits can be taken out through the same. there are two kind of "Horse Trader" algorithms one focuses only on buy side trades with smal

Strategy Name: Horse Trader Robot HT01 Description: Horse Trader Robot HT01 is a fully automated robot. This uses a price action strategy, advanced money management. It is most effective in trend reversal. Maintained excellent risk- reward. Tested in real accounts with profits and guarantee of profit in future. Suitable for both beginners and experienced traders. It will put trade at market price once signal generated. Once trade is activated stoploss is placed as per strategy and take

Tired of complex order placement and manual calculations? Trade Dashboard is your solution. With its user-friendly interface, placing orders becomes effortless, by a single click, you can open trades, set stop loss and take profit levels, manage trade lot size, and calculate risk to reward ratios, allowing you to only focus on your strategy. Say goodbye to manual calculations and streamline your trading experience with Trade Dashboard. Download Demo Version right now. You can find Details of
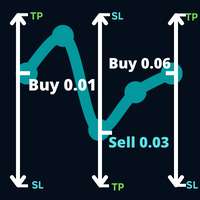
Apri una direzione sul trade che il mercato intende seguire e un trade che si è verificato sul tuo trade trade a seguito di un trade che era in sospeso sul tuo trade trade un ordine commerciale che era in sospeso sul tuo trade trade.
Esempio: un'operazione di acquisto con lotto di 0.01 al prezzo di 0.03 punti, acquisto con lotto di 0.01 al prezzo di 0.01.0930, quindi verrà deciso un ordine di stop di vendita di 0.03. viene effettuato un nuovo ordine di acquisto stop con un lotto di 0,06 a
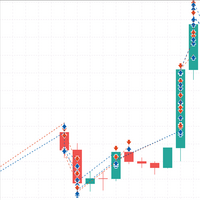
MT4 Version : https://www.mql5.com/en/market/product/87060 Matrix Hacker est réservé aux comptes couverts et utilise la marche aléatoire, le passé n'a pas d'importance. L'EA se fixe pour garder une assise stable sur le marché et couvrir à la fois les demandes et les offres. Achète et vend des offres et des demandes avec des quantités et des volumes variables selon le commerçant. Ce n'est pas recommandé pour un débutant car cela nécessite toujours de connaître l'optimisation et de ne pas sure
Grid Trading is a fully automated trading system that doesn't require any special skills from you. Just fire up this EA and rest. You don't need to set up anything, EA will do everything for you. EA is adapted to work on big deposit over $5000 for good work.
Timeframe: 1 Min
Currency pairs: EURUSD PROFITABILITY AND RISK The expected estimated profitability according to the backtest data is about 200% - 400% per year. The expected maximum drawdown is about 90% or more . Attention!!! This
FREE

Discount on all my products until 01.05. Gold Veritas è un Forex Expert Advisor completamente automatico per le ore tranquille. Monitoraggio del lavoro del consulente: https://www.mql5.com/en/users/bayburinmarat/seller Impostazione GMT corretta: https://www.mql5.com/en/blogs/post/743531 Tutti i parametri necessari per l'ottimizzazione più comprensibile e semplice sono disponibili in sole impostazioni 6. Puoi adattare il consulente alle tue preferenze: regola i livelli di rischio o personal
5 EMA Scalping Strategy Multi Symbol Scanner
This EA utility will scan all symbols which are selected in marketwatch and alert when such condition is formed in chart when Candle low is above EMA 5 for Sell alert and Candle high is lower from EMA5 so you can be ready before selling or buying for scalping purpose on 5min chart For more details watch attached video Logic : When a candle closes above 5 EMA in 5 mins chart, Wait for its low to break and Sell when low is broken by wick, Your SL sh

Robot di trading multivaluta per un lavoro confortevole sul Forex. Ha un minimo di parametri personalizzabili ed è quindi adatto sia a principianti che a trader esperti. Basta installare un robot di trading su una coppia di valute, ad esempio su "EURUSD" e guardare i risultati, non sono necessarie ulteriori manipolazioni. Non esigente riguardo al server e al broker VPS. Un bot affidabile che non necessita di un'ottimizzazione costante, una volta installato, configurato e dimenticato. *write me

XFlow shows an expanding price channel that helps determine the trend and the moments of its reversal. It is also used when accompanying transactions to set take profit/stop loss and averages. It has practically no parameters and is very easy to use - just specify an important moment in the history for you and the indicator will calculate the price channel. This is a demo version limited to CHF currency pairs. Designed to familiarize you with the interactive use of XFlow DISPLAYED LINES ROTATE
FREE

Session Killzone Indicator
Indicator that helps you to identify the killzone times of both London and NewYork sessions which usually is the most times for high volatility and taking liquidity from the market. Killzone times are configurable through indicator parameters. The indicator adjusts the range of the killzones based on the daily trading range.
FREE
The Indicator assists in decision making along with the user's market reading. By drawing the trend, this indicator becomes very useful on days of high volatility in the market, that is, it offers strategic insights on days of economic data, news or pronouncements. On flat market days it becomes usual to identify possible market reversals. Follow Youtube to understand the most suitable scenarios for its use.
FREE

The Average Daily Range (ADR) is an indicator that shows how far a currency pair can move in a day.
Automatically displays the upper and lower ADR levels.
Automatically calculates the percentage and distance of ADR achieved by the currency pair for the day.
Changes the color and thickness of the ADR line when the price reaches it.
The payment is made in 14 days. It is displayed on timeframes from M1 to M30.
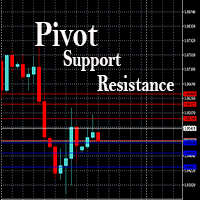
This EA is designed to calculate and draw Pivot Point, Support and Resistance for your selected time frame on the chart.
Works on all currency pair and on any time frames available on MT5.
To make sure the EA works, you need to select the pivot time frame as well as the candle shift that you want to calculate the pivot.
0 = Current candle on chart
1 = Previous 1 candle on the chart

Do you know what is The Blue Ocean Strategy ?
It is when an entrepreneur goes on a brand new market with no concurrence because nobody knows about it. This way, the entrepreneur is in a situation of monopoly and can enjoy this situation as long as nobody comes into the market. And you know what ? This situation is reproducible in bot trading thanks to the Blue Ocean Strategy EA MT5.
I’m a prop firm trader and I use it myself to make all my trades. After many years of use, a friend told m
Algo Bot is an expert advisor that is designed and optimized for GBPUSD. It is extremely easy to use, just open the GBPUSD pair, load the bot and activate Algo Trading. You can leave the default values. This bot does not use any technical indicator, its algorithm is based on price action, placing BuyLimit and SellLimit orders in optimal zones for GBPUSD.
The parameters of the EA are: Magic number: Number to identify the positions of this EA. Points to place the next order: Points at which the

KT Stochastic Alerts is a personal implementation of the Stochastic oscillator that provide signals and alerts based on six custom events: Bullish Crossover: When Stochastic main line cross above the signal line. Bearish Crossover: When Stochastic main line cross below the signal line. When Stochastic enter in an overbought zone. When Stochastic exit from an overbought zone. When Stochastic enter in an oversold zone. When Stochastic exit from an oversold zone.
Features
A perfect choice for

OnBoard stats is a panel that show in a single view a lot of usefull information about working orders and trading account. It has 4 different sub-panels (from left to right): Symbols order statistics : it can be found symbols for which there are orders (market or pendings). Symbol with pendings are colored with "Pendings color". Clicking on a specific symbol row, chart will be changed to that symbol. Current symbol statistics : informations about the "current" symbol, the one which is opened in
FREE

Full Automated Trading panel . it works on any trading instruments: Forex, Stocks, Futures, Indices, CFD, Bonds, Cryptocurrencies; interface minimization function; flexibility of use;
Join my channel and check video of it ===> https://t.me/Ash_TheTrader/4986
Features :
Auto SL and TP Auto Close partial Auto Trailing Session Time Alert Time of trading Alert Profit and Percentage and etc.
FREE

Данный индикатор показывает объем каждого бара (видимый диапазон) в пунктах. Гибкие настройки отображения значений. Возможна настройка параметров показа. Индикатор создавался для личного пользования, анализа графиков. Параметры: Color - цвет текстовых меток; Position - позиция метки: 0 - снизу, 1 - сверху; FontSize - размер шрифта; Angle - угол наклона текста; GapPoints - отступ по вертикальной оси.
FREE
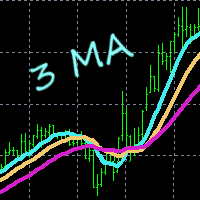
This indicator gives you a modified version of three Moving Averages. Great for scalping. Does not feature any alerts, and is best used manually after confirming multi line displays. Settings: Period1 Period2 Period3 Period4 How to use: Simply attach to any chart with default settings. Buy when the 4 lines converge below the price. Sell when the 4 lines converge above the price. Take note of the slope of Period4. See example pictures below. Best results when looking at three or more time frames

Seven copies left at $99 USD. Next price is 149 USD . set file Smooth Lift is an indicator-based trading system that includes 7 indicators, including trend indicators, volume indicators and indicators of possible price movement strength. They are used to confirm the analysis of the main Smooth Lift trading system. The trading is performed on 24/5. The strategy was developed taking into account the movement of the currency pair USDCHF and the best trading performance is on it.
Recommendations:
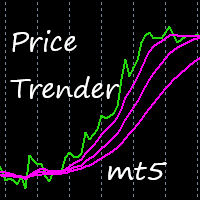
This indicator uses a special algorithm to plot the 4 lines for trading. Great for scalping. Features alerts. Settings for trend filters. How to use: Simply attach to any chart with default settings. Buy when the three pink lines converge below the green line. Sell when the three pink lines converge above the green line. Best results when looking at three or more time frames, and the three blue lines have just converged below or above the green line.
Use as you see fit for your strategy. Best r
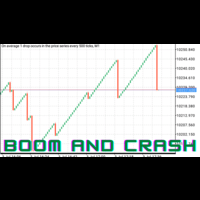
The BoomAndCrashEA , based on vector machine learning, is an advanced trading tool that uses the latest advances in computing technology to analyze the forex market and predict future price movements. The Expert Advisor will use vector machine learning to learn huge amounts of historical data and quickly and efficiently detect patterns in the market. It will use a sophisticated and complex proprietary algorithm which uses advanced mathematical calculations to solve complex problems and optimize
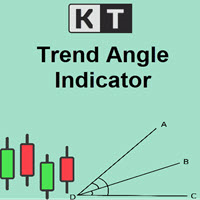
The KT Trend Angle helps to identify ranging and trending markets. The idea is to only enter a trade following the market trend if the slope is steep enough.
An angle is the ratio of the number of bars to the number of points: The bars mean the time offered by standard (M1, M5, etc.) and non-standard time frames. Points represent the unit of price measurement with an accuracy of 4 or 5 decimal places.
Input Parameters Period: An integer value to define the intensity of angled trendlines. A
A very good indicator for experienced and professional traders . A practical approach to trading. Easy to understand. A helping tool for traders looking for price movements .
Signals: Signal Number 1: When yellow line which is a signal line crossing the zero line towards downward direction is a selling opportunity. Signal Number 2:
When yellow line which is a signal line crossing the zero line towards upward direction is a buying opportunity.

2 copies left at 49 USD. Next price is 99 USD . set file
- This is a very aggressive trading strategy, based on a modified MACD indicator. It is used to analyze the anomalous zones of the market + author's methodology to restore the critical movement.
The strategy was developed taking into account the movement of the currency pair USDCHF and the best rates of trade just on it.
Recommendations:
- H1 USDCHF - Leverage of 1:500 or higher (ideally 1:1000 or 1:2000) - Minimum deposit 100 uni

KT Forex Blau Balance combines elements of momentum and volatility. It helps you identify entry and exit points.
Blau Balance consists of two moving averages (a slow-moving average and a fast-moving average) intersecting key transition points in market price. The indicator turns green or red when one is above or below the other, signaling to buy or sell trade signals.
It can be used in currency pairs and other markets that your MT4 or MT5 platform supports. Both short-term and long-term tra

The KT De Munyuk is a trend-based indicator that uses Parabolic SAR to identify the market direction. The indicator shows the PSAR in the form of green/red dots using a separate window. Buy Signal: When a green dot appears after a series of at least three red dots. Buy Exit: When a red dot appears on the current or next higher time frame. Sell Signal: When a red dot appears after a series of at least three green dots. Sell Exit: When a green dot appears on the current or next higher

In MetaTrader, plotting multiple horizontal lines and then tracking their respective price levels can be a hassle. This indicator automatically plots multiple horizontal lines at equal intervals for setting price alerts, plotting support and resistance levels, and other manual purposes. This indicator is suitable for Forex traders who are new and looking for chances to make quick profits from buying and selling. Horizontal lines can help traders find possible areas to start trading when the

KT XMaster Formula is a buy & sell signal indicator that works magically on most of the timeframes and currency pairs when used correctly.
The indicator uses calculations based on moving averages, RSI, and MACD. It is usually appropriate for scalping and trend trading - whether you are a novice or an experienced trader, the signals generated by this indicator are simple to understand and implement.
Overview The indicator comprises green and red dots arranged in wavy lines. These dots corre

KT Forex Trend Rider uses a trend following algorithm developed specifically for the Forex market to provide reliable buy & sell signals across the major currency pairs. It works best on major FX pairs and all time-frames.
Features
It comes with a Multi-Timeframe scanner that can search for upcoming signals across all the time-frames. It comes with four preset profiles to facilitate trading for scalpers, tick-trend, swing, and trend traders. It marks the potential reversal points in the mark
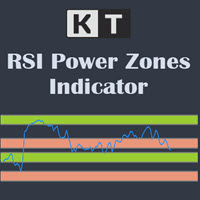
The KT RSI Power Zones divides and shows the movement of RSI into four different power zones to identify the potential support and resistance zones using the RSI.
Bull Support The bull support ranges from 40 to 50. The price is expected to reverse to the upside from this zone.
Bull Resistance The bull resistance ranges from 80 to 90. The price is expected to reverse to the downsize from this zone.
Bear Support The bear support ranges from 20 to 30. The price is expected to reverse to the

KT Price Border creates a three-band price envelope that identifies potential swing high and low areas in the market. These levels can also be used as dynamic market support and resistance. The mid-band can also be used to identify the trend direction. As a result, it also functions as a trend-following indicator. In addition, its ease of use and more straightforward conveyance of trade signals significantly benefit new traders.
Features
It works well on most of the Forex currency pairs. It

The BSI stands for Bar Strength Index. It evaluates price data using a unique calculation. It displays readings in a separate window. Many financial investors mistake this indicator for the Relative Strength Index (RSI), which is incorrect because the BSI can provide an advantage through its calculation method that the RSI indicator does not. The Bar Strength Index (BSI) is derived from the Internal Bar Strength (IBS), which has been successfully applied to many financial assets such as commodit

The KT Tether Line is a trend-following tool consisting of three indicators that work together to generate trading signals. It can correctly identify market trends while signaling trade entries. It was first introduced by Bryan Strain in the Stock & Commodities magazine in 2000 in "How to get with the trend and out at the end."
The Concept
When a market trend is confirmed, the most challenging part is determining the timing of the entries. This indicator alerts you to potential trend reversal

Stack Manager is a MT5 utility that is built to help traders: manage existing stacked trades (multiple trades opened on the same symbol) copy SL / TP levels to newly opened trades update SL / TP levels for all stacked trades, if one SL or TP level is modified calculate and show global SL / TP in currency and points (for all open trades in a stack) SL / TP autocomplete from phone (if left on a VPS, traders can place orders on a phone and SL / TP levels will be copied from the existing trades)
I
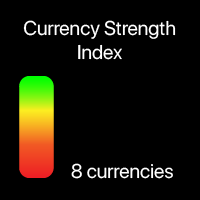
Current strength of the 8 major currencies My #1 Utility: includes 65+ functions, including this indicator | Contact me if you have any questions The indicator is displayed in a separate window, it can be moved to any place on the chart. In the input settings you can adjust: Interface theme : dark / white; Prefix and Suffix, if the currency pairs on your broker have it:
(e.g. if Symbol is "EURUSD .pro ", please set " .pro " as a Suffix); Panel size Font size
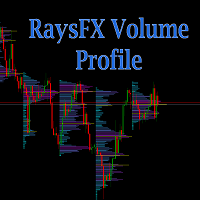
Calculation method The calculation method is summing the number of deals performed at a certain price. Alternatively, the volumes at a certain price can be summed if the real volume type is set in the parameters. The trade data is interpolated based on the most accurate terminal data available (М1 timeframe data). Each bar is divided into several trades based on the estimated price movement inside the bar. This is a distinguishing feature of the product setting it apart from other ones that hav

Overview This expert advisor is based on statistic model created using historical data. Our model lead to prepare parameters to drive Martingale strategy. It plays on USDCAD pair. To work proper with full strategy EA should be able to open total positions of 3.62 lots (sum of all possible open positions at the same time) and some margin for safety. For example it can be approximately at least 1200GBP with 500:1 leverage on account. It must be able to play 0.01 lots positions. Screenshots presen

Harpoon :It is a fully functional automated system that uses a tested strategy to exit statistically significant price levels and adapts to different conditions. This system is adjusted taking into account the delay in the execution of orders at different stages of the transaction. Expert Advisor uses price action to determine levels, which is an undeniable advantage compared to constantly lagging indicators. Signal : https://www.mql5.com/en/signals/1251860
Considering that this expert mus

Ichimoku Aiko MTF is a collection of technical indicators that show support and resistance levels, as well as momentum and trend direction. It is a multi-timeframe indicator so you don't need to change the chart timeframe when you want to see the ichimoku clouds on a higher timeframe. eg. The chart timeframe is M15 and you want to see on the M15 timeframe chart the H1 ichimoku indicators (the ichimoku in Metatrader can't do that) that's why you need to use Ichimoku Aiko MTF.

L'analizzatore di volatilità è un indicatore di momentum, che sfrutta la tendenza del prezzo a scoppiare fortemente dopo essersi consolidato in un range di trading ristretto. L'indicatore utilizza anche un oscillatore del momentum per mostrare la direzione prevista della mossa quando scatta la compressione. Questo istogramma oscilla attorno alla linea dello zero, l'aumento dello slancio al di sopra della linea dello zero indica un'opportunità di acquistare long, mentre lo slancio che scende al

The EA for manual trading to manage open positions.The built-in trailing stop has five modes and seven instruments. There is a virtual stop loss and a virtual take profit, which can be freely moved around the chart. With the help of the built-in trading simulator, you can check how the EA works in the strategy tester. Guide to UTrailingMinMT5 can be found in the "Comments" section. In the MT5 strategy tester, manual movement of virtual SL and TP lines according to the schedule does not work! Ben

About the indicator: DALA Forecast is a universal tool for predicting the dynamics of time series of any nature. For prediction, modified methods of nonlinear dynamics analysis are used, on the basis of which a predictive model is built using machine learning methods. To get the trial version of the indicator, you can contact me in private messages.
How to use the indicator: Apply the indicator to your chosen financial instrument or indicator with the settings you need. The prediction will b
FREE

The indicator works with the objects "Trend Line", "Rectangle", "Text" and allows you to create and copy them from one chart to another.
It is a more convenient alternative to automatic copiers, because it allows you to choose more flexibly what and where should be copied.
Keyboard shortcuts:
'1,2,3,4,5,6' - creating thin horizontal lines (the color is set in the settings), the same with SHIFT - thick line ' ~' - creating a line with a random color ))) '7,8,9' - creating shaded rectangles

Theoretical Foundation The Keltner Channels are channels ploted using volatility deviations above and bellow a moving average. The indicator is an excellent tool to help the trader build trend and mean-reversion strategies. Parameters The Orion Dynamic Keltner allows the user to select the Volatility Calculation Type, being ATR or Average Range (not considering price gaps). Also, the user can select the Calculation Period, Number of Deviations, Moving Average Mode and the Moving Average Ca

The movement exhaustion is a color rule that helps indicate when the movement will revert its direction. The darker the color, the greater the probability to revert. The indicator is based on the price statistic. Works on every timeframe, every instrument. Five color options: 0. Natural movement. (Gray) 1 - 4. Movement exhaustion (Yellow to maroon) The trader can use it as reversal or exhaustion signal. In a trend following trade it can be used as an exhaustion signal, indicating the movement ca

Here’s the problem: the default zigzag indicator given in MT5 trading platform does not really capture the most of the highs and lows on chart do draw zigzags. On chart below, notice that some of ther high, low of price have been missed to draw zigzags by this default zigzag indicator (picture 1). It is not so apparent until you compare default zigzag indicator to this SwingZZ indicator. Have a look on picture 2 and 3. The swing zigzag indicator is best because it captures most of the swing high

Theoretical Foundation Similar to the well-known Average True Range (ATR), the Average Range indicator is a volatility measure that is calculated using only the range of the bars (high – low), not considering the Gaps, as with the ATR. The Average Range can be very useful for day traders as it allows one to get the measure of the volatility of the last N bars. Parameters You can select the calculation period of the indicator.

The utility for manual trading to manage open positions.The built-in trailing stop has three modes and seven instruments: by pips, by bar extremes, by fractals, by volumes, by MA, by Parabolic SAR and by ATR. With the help of the built-in trading simulator, you can check how the EA works in the strategy tester. Guide to UTrailingMiniMT5 can be found in the "Comments" section. Benefits 3 trailing stop modes: normal, total and mobile stop loss; 7 options: by points, by bar extremes, by fractals, b

Robot Trading Gold is a fully automated trading system that doesn't require any special skills from you. Just fire up this EA and rest. You don't need to set up anything, EA will do everything for you. EA is adapted to work on small deposit over $100 for good work.
Timeframe: 15 Min
Currency pairs: XAUUSD PROFITABILITY AND RISK The expected estimated profitability according to the backtest data is about 300% - 600% per year. The expected maximum drawdown is about 90% or more . Attention!
FREE

Optimized from 2004 to 2022. Optimize further after this date, use monthly or yearly. Experts need optimizing as markets develop new ranges. New Age Bot trades XAU/USD on 5 minute charts. Entry - Bollinger bands and trend trading reversals is used for entries. Stops - Trailing stops are used with ATR. Money - lots Bollinger band period - 20 MA period - 100 Deviation - 2.0 Symbol for build - XAU/USD Time frame for build - 5 minute charts Risk Disclaimer Trading foreign exchange on margin carri
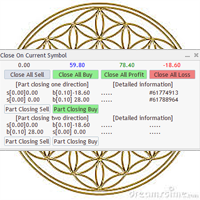
Utility / EA to simplify the exit from the drawdown. Allows you to gradually exit the drawdown correctly, reducing the volume of losing trades. At the same time, profitable trades opened on the same symbol cover losing trades in whole or in part. The volume of partial closing of a losing trade is calculated automatically. Trades opened both in one direction and in the opposite direction are supported. Position Management Closing positions only for purchase, only for sale, only profitable, only

Normal Parabolic SAR with label of long or short state. Tells also "Parabolic long" and "short". Can be used in multitimeframe layouts together with Swiss HolyGrail indicator or in different timeframes. So, if all the indicators show "long" or "short" you can be sure that the risk of a wrong direction is small. The standard values for Parabolic SAR are 0.02 for step and 0.2 for maximum. You may experiment with changing the maximum to get smother curves. Note that changes in parabolic SAR are la
FREE
Индикатор отображает изменение баланса В правом нижнем углу окна.
Отображаются следующие периоды Сегодня Вчера 3 дня Неделя 10 дней Месяц 3 месяца Полгода Год Все время Есть возможность выставить расчетное время. Удобно пользоваться для расчетов прибыли/убытков с определенного часа.
Будет полезен например ночным скальперам. Данные совпадают с расчетами отчета в терминалее.
FREE

reguired set file Live Siqnal - is a trading system based on the correlation of several classical indicators with certain parameters to achieve the necessary goals of market entry and exit control. The minimum number of parameters greatly simplifies the work with the Expert Advisor. The strategy is based on a classic overbought/oversold system with the possible influence of market strength on the price movement in a certain direction. Recommendations for trading: - TF H1GBPUSD - leverage 1:500

Optimize for time frame and asset before back test and use, use last year or monthly for parameters. XAU/USD 1 HR recommended. Parabolic works on any asset or time frame. This EA uses parabolic sar as the signal. Percentage of margin is used for entries. So for low risk it would be 1% of margin and for medium risk it would be 5-10% and high risk would be above these amounts. Also taking into account the smaller time frame or larger time frame + asset for risk management assessment.
Risk

L'Expert Advisor proteggerà il tuo conto da perdite impreviste monitorando costantemente il patrimonio netto e seguendo le regole come da input nei parametri. Quando le regole vengono violate, l'EA chiuderà tutte le operazioni. Puoi impostare l'EA in modo che chiuda tutte le negoziazioni a una certa percentuale o perdita di denaro, o per chiudere a una certa percentuale o profitto in denaro. Questa utility è molto utile per le Prop Trading Challenges per mantenere basso il draw down e per

=== Next price is 299$ === Segnale di conto reale - https://www.mql5.com/en/signals/1702554 Versione per esperti MT4 - https://www.mql5.com/en/market/product/86453 Lasso di tempo: M1 Coppie di valute consigliate: EURUSD, GBPUSD, USDCHF, EURGBP, USDCAD, AUDCAD, CHFJPY, EURCHF, USDJPY.
Tsap è l'ultimo sviluppo del team Varko Group Inc. Un Expert Advisor di trading multivaluta la cui strategia si basa su una bassa volatilità notturna. L'EA non utilizza strategie

INDICATORE MT5.
Questo indicatore rileva e zone di domanda e offerta su qualsiasi grafico, qualsiasi periodo di tempo e qualsiasi broker. È perfetto per l'analisi tecnica.
Per impostazione predefinita, le linee rosse suggeriscono forti zone di vendita mentre le linee verdi indicano forti zone di acquisto. Una volta tracciata una linea (verde o rossa), c'è il 99% di possibilità che i prezzi tornino in quella zona per chiudere la linea.
INGRESSI:
(bool) Four_candle = false : un'opzion
Il MetaTrader Market è il posto migliore per vendere robot di trading e indicatori tecnici.
Basta solo sviluppare un'applicazione per la piattaforma MetaTrader con un design accattivante e una buona descrizione. Ti spiegheremo come pubblicare il tuo prodotto sul Market per metterlo a disposizione di milioni di utenti MetaTrader.
Ti stai perdendo delle opportunità di trading:
- App di trading gratuite
- Oltre 8.000 segnali per il copy trading
- Notizie economiche per esplorare i mercati finanziari
Registrazione
Accedi
Se non hai un account, registrati
Consenti l'uso dei cookie per accedere al sito MQL5.com.
Abilita le impostazioni necessarie nel browser, altrimenti non sarà possibile accedere.