Guarda i video tutorial del Market su YouTube
Come acquistare un Robot di Trading o un indicatore
Esegui il tuo EA
hosting virtuale
hosting virtuale
Prova un indicatore/robot di trading prima di acquistarlo
Vuoi guadagnare nel Market?
Come presentare un prodotto per venderlo con successo
Nuovi Expert Advisors e Indicatori per MetaTrader 5 - 118

Turn Over is a direction indicator for determining the trend.
The Turn Over indicator visually “unloads” the price chart and saves analysis time: there is no signal - there is no deal, if a return signal appears, then the current deal should be closed.
The indicator implements a strategy for trend trading, filtering and all the necessary functions built into one tool! The principle of the indicator is that when placed on a chart, it automatically determines the current state of the market,

This Expert Advisor is based on ForexMiracle System (MA,BB,MACD,ADX,STO). Follow the trend...no Martingale.. . need technical analysis skill Input Parameters : - Magics = 1234; - Lots = 0.01; - maxStopLevel = 700; - autoTPbyATR = true; - TP = 100; - autoSLbyBollinger = true; - SL = 50; - trailingStop = 0; - CutByEngulf = true; - Friday_Rest = true; - Indicator_Setting = "| ^_^ | ^3^ | ^v^ |"; - MAmega_Setting = "----------------------------"; - MA_Setting = "----------------------------"; - B

The Netsrac Correlation Trade Indicator (NCTI) was created to trade correlations between different assets. NCTI offers five different strategies to do this. Five different correlation trading strategies with two or three assets Fast access your assets with one click via asset buttons Your profit/loss at a glance Configurable alerts via screen or mobile You can use the indicator with every timeframe. Higher timeframes give fewer but better signals. If you have some questions or suggestions - plea
FREE
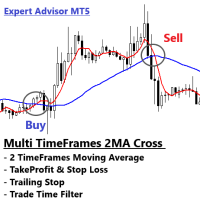
Multi Timeframes of 2 Moving Averages Cross Timeframes 1 = Executor Position (MA1 Cross MA2 from bottom = buy, MA1 Cross MA2 from Upper = sell) Timeframes 2 = Trend Detector (MA1 > MA2 = Uptrend, MA1 < MA2 = Downtrend)
How it works If MA1 > MA2 in Timeframes 2, then MA1 Cross MA2 from bottom in Timeframes 1, output = Buy If MA1 < MA2 in Timeframes 2, then MA1 Cross MA2 from Upper in Timeframes 1, output = Sell
Expert Advisor Features - Fixed Lot - Stop Loss and TakeProfit - Trailing Stop -

The Netsrac Correlation Trade Indicator (NCTI) was created to trade correlations between different assets. NCTI offers five different strategies to do this. Five different correlation trading strategies with two or three assets Fast access your assets with one click via asset buttons Your profit/loss at a glance Configurable alerts via screen or mobile You can use the indicator with every timeframe. Higher timeframes give fewer but better signals. If you have some questions or suggestions - pl

Robot de scalpings curtos em simbolos de alta volatilidade. Amplamente testado no Mini índice no tempo M1. Resultados consistentes e expressivos em curto período de tempo. Configurações recomendadas para o mini índice já estão nos parâmetros de entrada dos sistema. Não recomendada a utilização em tempos gráficos maiores. Mais informações dos resultados do sistema no tester, encontram-se nas imagens.

Quieres ser rentable y que un indicador haga los análisis por ti.. este es la indicado tener mas seguridad en tus operaciones si respetas los parámetros este indicador fue diseñada y modificado por mas de 6 meses, escogiendo y modificando la para tener un mejor resultado y entradas mas precisas. que te ayudara a asegurar tu entrada y poder sacarle muchas ganancias. los parametros: Entrada cuando La linea roja o verde cruce hacia arriba Puede entrar apenas comencé a cruzar Compra o venta Observa
***Please Give Some Feedback and Reviews*** This is an indicator which shows the direction and the strength of the selected Symbol based on the two outputs, Signal and Value. The Signal indicates the directions as Buy equals 2(Blue) and Sell equals 1(Red). The Value output indicates the strength of the signal between -100 to 100. This indicator is both trend and fast preliminary indicator by choosing appropriate parameters. Indicator uses the Tick Volume as the hitting catalyst, which by choosi

MMHelper - инструмент для удобной работы с ордерами. Позволяет рассчитать и выставить ордер, в зависимости от выбранного риска. Интерфейс продуман для максимального удобства. Нет лишних элементов на графике.
В параметрах возможно указать: порог безубытка (по прохождении какого количества пунктов выставить безубыток); размер безубытка в пунктах; закрывать ли половину позиции при достижении уровня безубытка; размер максимального риска по всем позициям в процентах.

This indicator signals significant price movements compared to the average over a defined period, making it easy to spot potential trading opportunities. It takes into account not only price movements but also the spread value of each symbol, providing a more accurate picture. You can use this indicator for multiple symbols, up to 8 pairs, as specified in the input parameters. With its flexible settings, traders can easily customize it to suit their individual preferences and trading styles. It'

Un indicatore che dipende dalla liquidità e dalla media mobile > che ti danno il 98% di decisione corretta di acquisto e vendita. e il momento di chiudere il commercio. PREZZO aumenterà di volta in volta > e quando verrà lanciato il primo EA dipenderà da questo indicatore sarà più di 2k. 1-quando aprire posizioni di acquisto o vendita (dipende dall'incrocio di due linee X e il calcolo dei punti dipende dal Frame selezionato) (la croce deve essere al di fuori dell'area colorata) la candela deve t
VR MultiPrice Analysis is an indicator that determines the strength of a currency in a currency pair. Let's take the EUR / USD pair as an example. How can we determine which currency is currently weak and which is strong? The easiest and most reliable way is to compare the EUR against other currencies, excluding the USD. The variants of power distribution: The EUR is rising against other currencies - this is a sign that the currency has become more attractive to traders and investors, or good ne

The Market Momentum indicator is based on the Volume Zone Oscillator (VZO), presented by Waleed Aly Khalil in the 2009 edition of the International Federation of Technical Analysts journal, and presents a fresh view of this market valuable data that is oftenly misunderstood and neglected: VOLUME. With this new approach of "seeing" Volume data, traders can infer more properly market behavior and increase their odds in a winning trade.
"The VZO is a leading volume oscillator; its basic usefulnes
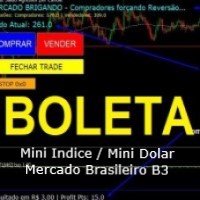
BoletaLira is a fundamental tool focused on beginning and advanced users so that they can enter operations with the main input signals such as:
- Market Trend: High or Low, always taking into account the moving average pre-defined in the setup.
- Correlation between 2 assets: In the case of Brazilian B3 we can use the BoletaLira for Mini-Index but using the Dollar signs so that we can have greater security, for those who do not generally know the Index x Dollar assets try to go in the oppos

Reversible indicator.
You need to understand that any indicator is just a visual waveform. Currency pairs never rise or fall in a straight line. Their rises and falls are alternated by pullbacks and turns.
The Reversible indicator contains an entire trading system, processes information from several technical instruments and the appearance of its signals is the final calculation result. The indicator itself evaluates how strong a signal appears in the market and when to change direction, si

Rua Close All Orders An EA used to preserve profits. EA will close all orders when reaching profit expectations or loss limits in USD or a percentage of the balance. Custom parameters BackTest EA + True: there is a command when running in Backtest mode. + False: Not entered, used for real time Closebyprofit: + true: use payment in USD + false: do not use closed in USD profit win: stop rate (USD) profit loss: stop loss (USD) Closebypercent: + true: use close to percent of bal
FREE
Minimalist and fully customizable info panel. It works on any chart and timeframe, with 2 - 4 digits brokers and with 3 - 5 digits ones. It can show: Current Spread in pips (1 decimal digit if you are on a 3 - 5 digits broker) ATR (Average True Range) in pips Current Server Time Current GMT Time Important Account Info: Current Leverage and Stop-out Level (%) Time left for the current bar. Very useful on 4 h charts All info labels have a tooltip with the same data Available customizations : En
FREE
BluePrint TimeFrame: M5 or above . BluePrint is an Expert Advisor based on Price Action and Martingale.
Configurations: +---------------------------------- BLUEPRINT | EA Settings ----------------------------------+ Magic Number: ID that should be changed if you want to install Expert Advisor on different graphics, without interfering with each other and behaving like a single Expert Advisor. Max Spread By Tick Size: The maximum Spread difference that you want to trade. Lots Mode: Yo
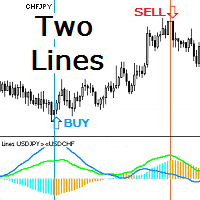
Индикатор показывает две линии динамики движения двух инструментов. Если один из коррелирующих инструментов убегает, другой будет его догонять. Этот принцип даёт точки входа в сделку по их кроссу или для синхронной покупки и продажи в парном трейдинге. Гистограмма индикатора показывает значение дистанции между линиями инструментов. При уменьшении и увеличении дистанции гистограмма принимает разные цвета. Треугольный значок показывает текущее состояние линий: расхождение ( Divergence ) или схо

An indicator to fetch the market shocks from the economic events directly to the chart. It indicates the surprise factor (actual published data minus the expected value) exactly on the right candlestick! The bigger the value of the indicator, the higher price gap will be. The indicator's value and sign gives a great opportunity to forecast the amount and direction of the price gap. Do not miss any opportunity by setting an Expert Advisor to place buy or sell orders based on this indicator's valu

Indicatore di tendenza, soluzione unica rivoluzionaria per il trading di tendenze e il filtraggio con tutte le importanti funzionalità di tendenza integrate in un unico strumento! È un indicatore multi-timeframe e multi-valuta al 100% non ridipingibile che può essere utilizzato su tutti i simboli/strumenti: forex, materie prime, criptovalute, indici e azioni. Trend Screener è un indicatore di tendenza che segue un indicatore efficiente che fornisce segnali di tendenza a freccia con punti nel gra

Sistema VR non è solo un indicatore, è un sistema di trading completo ed equilibrato per il trading sui mercati finanziari. Il sistema si basa su regole di trading classiche e su una combinazione di indicatori media mobile e canale Donchian . Il Sistema VR tiene conto delle regole per entrare nel mercato, mantenere una posizione nel mercato e le regole per uscire da una posizione. Regole di trading semplici, rischi minimi e istruzioni chiare rendono il sistema VR una strategia di trading attraen

For those who struggle with overbloated Volume Profile/Market Profile indicators, here is a solution that contains only the Point of Control (POC) information. Super-fast and reliable, the Mini POC indicator presents this vital information visually within your chart. Totally customizable in splittable timeframes, type of Volume, calculation method, and how many days back you need.
SETTINGS Timeframe to split the POCs within the day. Volume type to use: Ticks or Real Volume. Calculation method
FREE

The adviser uses a strategy based on trading in the daily interval of the chart using the M5, M15, M30 timeframe. Advisers calculates the signal using technical indicators and only on the daily time intervals. The EA uses an intelligent algorithm for partial closing of an order in profit, thereby minimizing the lot size and in case of a price reversal, the loss will be small. Each position is strictly protected by stop loss. A multi-currency adviser trades in 26 currency pairs. Use multicurrency

Recovery Bad Order MT5 (System to recovery lost trader whit recovery algorithm).
This system used algorithm in the ea for initial recovery algorithm, this system close one part of loses trader, whit algorithm recovery. (the lot recovery is a factor o lot used in the entry recommended used 0,1 for lot and 0,01 for recovery lot). https://youtu.be/FlpOhpiy7Pc Recovery Bad Order MT5 is an Expert Advisor for recovering losses of positions that were opened in the wrong direction (that were opened
The expert is designed for single scalping at the daily opening of MICEX trades ( It starts working a few seconds after 10=00 ). It is advisable that the expert should work at 1 hour timeframe. The expert considers integer number of lots specified by the user, verification is minimal, martingale is not provided. The expert at the beginning of work (market opening + selected delay in seconds)) opens 2 pending orders of users volume specified by the parameter of an offsets, thet are relative to c
ECHO INDICATOR V2.2 Update
A top-quality indicator works with trend and pattern. The tool is a good assistant for the traders use various levels in trading.
When price approaches a level, the indicator produces a sound alert and (or) notifies in a pop-up message, or via push notifications. A great decision making tool for opening orders. Can be used any timeframe and can be customized
Easy to trade It implements alerts of all kinds It implements a multi-timeframe
Trade with Trend + s
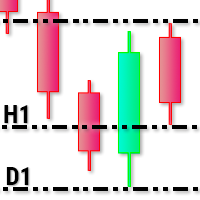
This utility tool draws timeframes top/bottom horizontal named lines on the chart, which highlight important regions and can assist in decision making for trading. Inputs: Timeframes Top/Bottom Lines: H1 (1 hour), H4 (4 hours), D1 (Daily), W1 (Weekly), MN1 (Monthly): You can choose to enable or disable timeframes top/bottom named lines. Lines Color: You can choose your favorite from the available colors or type in a custom RGB color (values from 0 to 255, e.g.: 100, 128, 255). Lines Style: You c

For Meta Trader 5. We have all experienced a situation where the market wipes out our stoploss before it turning in the direction we had anticipated. This experience is more frequent when you use a trailing stoploss. If only there was a way to place and trail the stoploss just the perfect amount of pips away. Well, there is... The Average True Range (ATR) is a one of the most popular technical analysis indicator, introduced by J.Welles Wilder, that measures Market Volatility for a given numbe

The Synchronized Cross indicator allows you to link cross hairs from multiple chart windows. This means that as you move the cross hair in one chart, all other cross hairs will move together by automatically staying on the same time. If, for example you are moving your mouse cursor in a M5 timeframe (see screenshots), the crosshair will show as a line in the higher timeframes, and as an area in the lower timeframes. Thus making it easier to correlate timeframes. The input parameters are self exp
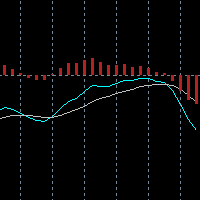
The built-in MACD does not properly display all the different aspects of a real MACD. These are: The difference between 2 moving averages A moving average of (1) A histogram of the difference between (1) and (2) With this indicator you can also tweak it as much as you want: Fast Period (default: 12) Slow Period (default: 26) Signal Period (default: 9) Fast MA type (default: exponential) Slow MA type (default: exponential) Signal MA type (default: exponential) Fast MA applied on (default: close)

One of the most popular methods of Technical Analysis is the MACD , Moving Average Convergence Divergence, indicator. The MACD uses three exponentially smoothed averages to identify a trend reversal or a continuation of a trend. The indicator, which was developed by Gerald Appel in 1979 , reduces to two averages. The first, called the MACD1 indicator, is the difference between two exponential averages , usually a 26-day and a 12-day average.
La Media Mobile EA ΜΤ4 è un Expert Advisor completamente automatizzato che porta il trading della media mobile a un livello completamente nuovo. La Media Mobile EA MT4 può aprire un'operazione di acquisto quando MA si alza (colore blu MA) o una vendita quando MA scende (colore rosso MA) o può aprire una nuova operazione nella stessa direzione su ogni nuova candela, purché la pendenza la direzione della media mobile rimane invariata. Una serie di impostazioni uniche rendono questo EA estr

Vol 2 DPOC volume vol 2 DOC-dynamic horizontal volume indicator for any time periods
Main settings of the indicator: Volume Source -selecting data for volumes (tick or real) DPOCOn -enabling / disabling the indicator DPOCFrom -calculation start date DPOCTo -settlement end date The indicator allows you to manually select areas on the chart to analyze changes in the maximum volume over time.
You can do this by using vertical lines and moving them along the chart. Or by setting specific dates

The Inside Bar pattern is a very well known candlestick formation used widely by traders all over the world and in any marketplace. This approach is very simple and adds a little confirmation candle, so it adds a third past candlestick to the count to confirm the direction of the move (upward or downward). Obviously, there is no power on this candlestick formation if the trader has no context on what it is happening on the market he/she is operating, so this is not magic, this "radar" is only a
FREE
Unique trend trading algorithm with advanced filtering and many features which should become a part of your trading arsenal. This indicator can give you also trading advisors (with take profit target), success rate scanner and much more. TrendMagiX PRO comes with built-in multi-pair and multi-timeframe scanner which is fully adjustable. User can select own symbols and time-frames to monitor. + ALL the features of standard TrendMagiX indicator
Important information For additional detailed infor
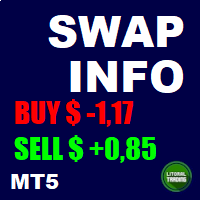
This is a script based tool that informs the swap from all the currency pairs (gold and silver too). It is possible to highlight pairs with a specific currency and whether the swap is positive or negative. In addition it is possible to complement the name of the symbols depending on the broker. The informations are showed in the Experts tab of the Toolbox (Ctrl+T). If you have any doubt or suggestion, please, contact us. Enjoy!
FREE
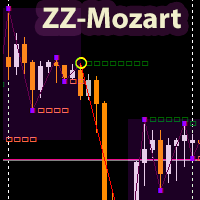
The ZigZagMozart indicator is based on the calculation of the advanced ZigZag. Displays trend break points (white squares), resulting points (yellow circles), flat zones (purple dots). The only indicator parameter: “ pivot in points ” - the minimum shoulder between the peaks of the indicator. The indicator uses market analysis based on the strategy of the famous modern trader Mozart. https://www.youtube.com/watch?v=GcXvUmvr0mY.
ZigZagMozart - works on any currency pairs. If the parameter “piv

Currency strength meter gives you a quick visual guide to which currencies are currently strong, and which ones are weak. The meter measures the strength of all forex cross pairs and applies calculations on them to determine the overall strength for each individual currency.We calculate based the strength of currency based on the trend of 28 pairs.
LIMITED TIME OFFER : Trend CSM Indicator is available for only 50 $. ( Original price 125$ )
By accessing to our MQL5 Blog, you can find all our

BeST_Hull MAs Directional Strategy is a Metatrader Indicator based on the corresponding Hull Moving Average.It timely locates the most likely points for Entering the Market as well as the most suitable Exit points and can be used either as a standalone Trading System or as an add-on to any Trading System for finding/confirming the most appropriate Entry or Exit points. This indicator does use only the directional slope and its turning points of Hull MAs to locate the Entry/Exit points while it

** LIMITED version** This EA utility helps Price Action traders calculate the risk as Big Money profesional traders do: in points or percentages. Allows to also set a desired Profit:Risk ratio and optionally enter a second and third orders simultaneously with different ratios and risk percentages. Great for BTMM, ICT, and other methodologies.
Very simple to use, just "point and shoot"!!!
Full version available here .
FREE

GO IT - it is a Secure Automated Software for trade Forex market and indices.
ONLY RECO M ENDED FOR GBPUSD AND EURUSD Can used this EA whit 100$ in your account
The architecture is a Fully Automatic Autonomous Robot Expert capable of independently analyzing the market and making trading decisions
GO IT It is an advanced trading system. This is a fully automatic Expert Advisor. It is a 100% automatic system, the system controls both the inputs and

This EA utility helps Price Action traders calculate the risk as Big Money profesional traders do: as percentages of available funds. Allows to visually set a desired Profit:Risk ratio, where you want your stop-loss and take-profit levels. Optionally, enable a second and third orders to be placed simultaneously with different ratios and risk percentages. Great for BTMM, ICT, and other methodologies.
Very simple to use, just "point and shoot"!!! FREE limited version here .

A useful dashboard that shows the RSI values for multiple symbols and Time-frames. It can be easily hidden/displayed with a simple click on the X top left of the dashboard. You can input upper and lower RSI values and the colours can be set to show when above/below these values. The default values are 70 and 30. You can choose whether the dashboard is displayed on the right or left of the chart. If you want to have 2 dashboards on the same chart you must input a different name for each. The sca
FREE

Users of PVRSA / PVA certainly already know the Dragon indicator and its use.
The Dragon works as dynamic support and resistance and can be used for scalper or trend follower.
In addition to the Dragon we have the WGT (fast) and EMA (slow) averages that can show immediate movement and also trend movement.
Stay tuned for the Dragon's inclination!
The indicator can be used on any asset/currency pair and can be customized according to the trader's interest.
See also my volume analysi

Several techniques use volume as an important point in the trade. Whether to indicate strength, exhaustion, pullback weakness, among others.
In chief I quote Richard Wyckoff's theory, which said about the importance of looking price and volume.
However, there are several possibilities to filter what is volume that should be noticed.
PVRSA/PVA users use an indicator with specific colors, which assist in identifying the volume and type of movement that the price has made.
Will the high

トレンド順張り型EA
こちらは仮想通貨向け自動売買プログラムとなっております。 シグナルも公開中
通貨ペア: 全ての通貨ペアに使用できますが、トレンド性の強い仮想通貨がおすすめです。 ロット数: 自動計算 パラメータ ・リスク:証拠金に対するロット数の割合です(0.01~3が推奨値です) ・マジックナンバー:EAを識別するためにご利用ください。 ポジション数: 最大1つとなっておりますのでリスクは最小限となっております。 時間足 :内部的に1H足を使用してますのでどの時間足でもエントリーは同じになります。 注文条件 ・一定期間の高値、安値を監視することでトレンドに対して順張りを行います。 ・トレンドを検知した時点で順張りを行い、トレンドが反転するまで追い続けます。 ・トレンドが反転したら決済&反対方向へのエントリーを行います。 その他 ・もちろん自己判断で途中で決済していただくことも可能です。決済後は再度トレンドが検知した際に順張りを行います。

Expert Advisor for use in all Market. For more details visit: Telegram group: https://t.me/SlakingFXEA Parameters Set Name Magic Number Allow Buy Allow Sell PipStep (points) Max Martingale Orders (0 unlimited) Max Loss $ day (0 don´t use) Mas Loss % day (0 don´t use) Max Profit $ day (0 don´t use) Mas Profit % day (0 don´t use)
K Period D Period Slowing Overbought Oversold Type of smoothing Calculation method
Lots Auto Lot Initial Balance for autolot calculate Martingale (1 don't use) Take P
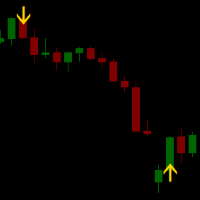
Signal RSI printa no gráfico os melhores momentos de entrada segundo o indicador RSI.
No gráfico aparecerá uma seta indicando o momento e a direção de entrada para a operação. O encerramento da operação se dá ao atingir o lucro esperado ou o stop. Se estiveres com uma operação aberta e aparecer outra seta de sentido inverso, inverta a mão e aproveite! Amplamente testado em gráficos de mini índice e mini dólar, bem como ações e FIIs.
Gráficos recomendados: 5, 10, 15 min.

SupeRobot is a fully automated trend robot working on the long run based mainly on the stochastic signal improved to work best with the EURUSD pair. After the backtest, it gave promising results from 2019 until today. It's recommended to have at least 300 $ on your trading account before using this robot to trade. In order to get the best results : Set "MaxPositions" up to 10. it's set by default to 1. (it sets the number of the maximum opened positions at the same time) Set leverage to 1:500. M

SI Connect è un'utility che stabilisce la connessione ai nostri server per utilizzare FX Volume o i sistemi di trading SIEA.
Istruzioni tecniche per preparare il vostro terminale all'uso di SI Connect Consentire le richieste web e inserire https://stein.investments nell'elenco degli URL consentiti in Opzioni terminale -> Sottocategoria Expert Advisors . Hai bisogno di una sola istanza EA in esecuzione per ogni terminale, ma deve funzionare costantemente in background per prendere gli ultimi da
FREE
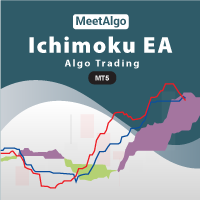
CAP Ichimoku EA MT5 trades using the Ichimoku Kinko Hyo Indicator. It offers many customizable Ichimoku trading scenarios and flexible position management settings, plus many useful features like customizable trading sessions, a martingale and inverse martingale mode. [ Installation Guide | Update Guide | Submit Your Problem | All Products ]
Functions Easy to use and customizable Ichimoku setting. Customizable indicator settings Built-in money management Grid trading when trade in Los
FREE

This indicator displays the wave structure of the market in the form several wave levels nested in each other. For each of these levels an automatic preliminary (draft) marking of waves in Elliott's style (123..., ABC... etc.) is created. This markup is completely automatic and absolutely univocal. The indicator is especially useful for beginner wave analysts, because among all the possible versions for wave marking, it allows you to immediately take the most adequate version as a ba

The Mono Waves indicator is designed to display the wave behavior of the market on a chart. Its appearance is presented on slide 1. This indicator uses the PPPC (Point-Percent Price Channel) indicator, which can be downloaded for free from the Market . When the market moves up, the upper border of the price channel is built on High candlestick prices (for more details, see the description of the PPPC indicator at the link given above). The higher the High prices rise
FREE

The advantage of the Price Surfing indicator is the search algorithm for the extremes of the price of the instrument. Most indicator signals are located at local maximums and minimums of the price . For the convenience of the trader, the potential profit of each signal is displayed on the chart. The indicator does not repainting, the signal appears after the bar is closed. MT4 version https://www.mql5.com/en/market/product/46054 Parameters SendAlert - enable alert of a new signal SendEMail

The TRIXs Indicator is the combination of the TRIX (Triple Exponential Moving Average) indicator with the addition of a SMA (Simple Moving Average) signal. It provides signs of trend continuity and the start of a new trend.
The entry and exit points of operations occur when the indicator curves cross.
It performs better when combined with other indicators.
FREE

Introduced expert system Stable Ex MT5 works with the EURUSD currency pair and only with it. This system implemented the principle of five orders - that is, a maximum of five orders can be placed in one direction, after which the total position of the series must be closed by stops, either real or virtual. The trading system is designed to work separately with a series of buy orders and separately with a series of sell orders. which makes the trading system versatile enough. The expert passes a

One of the Best Volume Indicators, with the addition of a Moving Average for weighting volume over time average.
If the "Current Candle" Volume is X% greater than the Moving Average value, we will have a sign of increasing volume.
It can be a sign of Beginning, Continuity, Reversal or Exhaustion of the Movement.
Fully configurable and all options open, you can color and set ALL values as you see fit.
The 'Volume Break' shows volume bars in the same color as the candlestick, in addition
CAP Rebate Trading EA MT5 is an automatic trading robot, a high-frequency grid trading system. EA performs a great number of trades allowing it to make profit not only from Forex market but also from receiving rebates (returning part of a spread). Since the security margin for a locking position is about 25-50% (depending on the broker), CAP Rebate Trading EA works in two directions simultaneously in case the appropriate signals are present. [ Installation Guide | Update Guide | Submit Y

The Point-Percent Price Channel (PPPC or PP Price Channel) indicator is designed to display on the chart a channel whose width is specified both as a percentage of the current price and in points. Its appearance is presented on slide 1. When the market moves up, the upper border of the channel is built at the price of High candles. In this case, the lower boundary follows the upper one at a strictly specified distance. When the price touches the lower border of the channe
FREE

The TRIXe Indicator is the combination of the TRIX indicator (Triple Exponential Moving Average) with the addition of an EMA (Exponential Moving Average) signal. It provides signs of trend continuity and the start of a new trend.
The entry and exit points of operations occur when the indicator curves cross.
It performs better when combined with other indicators.
FREE

Combining the best of Price Action , Directional Movement , and Divergence / Convergence analysis, the Candle Color Trend is the easy and reliable way to identify the direction of the trend. The indicator automatically paints the candles according to the premise that the upward trend is defined by prices that form a series of ascending tops and bottoms. On the other hand, the downward trend is defined by prices that form a series of descending tops and bottoms.
Color Trend is certainly one
FREE

Shows the full name of the symbol on the chart.
Especially relevant for Stocks, CFDs, Indices and Futures.
Also, when you press "right"(cifre 6) on the NumPad, an "Alert" is issued, from which you can copy the name in the "Experts" column
and use, for example, to search for additional information about the company.
In the settings you can select the color, placement and font size.
FREE

Bearish/Bullish divergent bar . One of the signals of the "Trade Chaos" system of Bill Williams. (First wiseman)
When bar moving away from the "Alligator" indicator and there is divergence on the Awesome Oscillator indicator, it shows a potential point of movement change.
It is based on the opening/closing of the bar, the position relative to the previous ones, the Alligator and AO.
When trading, the entrance is at the breakthrough of the bar(short trade - low of bar, long trade high of bar)

The Price Control indicator determines a short-term and long-term trend. The analysis is based on the selected timeframe. The indicator shows the points of opening deals for sale or purchase, and also indicates the direction of the trend at:
Short term Long term
The indicator not only signals an immediate purchase or sale. It indicates a short-term and long-term trend. The indicator allows you to examine in more detail the real and historical market trends!

Squat bar.
One of the signals of the "Trade Chaos" system of Bill Williams.
It is calculated based on the difference in price changes and tick volume.
Strengthens the signal of the "Bearish/Bullish Divergent Bar (First Wiseman)" if it coincides with it or is nearby.
Tested in comparison with the original program "Investor's Dream".
For more effective development of the system, read and see the materials of Bill Williams.
In the settings you can choose the color of bar.

Description: Wave5 is an adviser that trades on the Eliot wave theory and Fibonacci levels. Currencies : EURUSD Timeframe: M15
Detailed description: The Wave5 Expert Advisor is trading on the EURUSD pair. A combination of several indicators is used to analyze the wave pattern. The decision to enter the transaction is made when the waves form up or down. Most effectively, the expert trades on the M15 period on the EURUSD pair. There is a minimal risk with a sufficiently high profit.
Risk man

Benefits: A new and innovative way of looking across multiple timeframes and multiple indicators on any chart. Provides instant multi-timeframe analysis of any market. i.e. forex currency pairs, cryptocurrency pairs, commodities, etc. It offers precise indications across multiple timeframes of volatility as measured by RSI, ADX and STOCH within one chart. Helps you determine high probability trading setups. See example strategy in comments. Can see bullish/bearish volatility building across mult
Learning to trade on indicators can be a tricky process. Volatility Index indicator makes it easy by reducing visible indicators and providing signal alerts Entry and Exiting the market made possible through signal change Works well with high time frame to reduce market noise simplicity in trading guarantees success and minimal losses Our system creates confidence in trading in case of any difficulties or questions please send message
Sai perché MetaTrader Market è il posto migliore per vendere strategie di trading e indicatori tecnici? Non c'è bisogno di pubblicità o di protezione del software, nessun problema di pagamento. Tutto ciò è fornito da MetaTrader Market.
Ti stai perdendo delle opportunità di trading:
- App di trading gratuite
- Oltre 8.000 segnali per il copy trading
- Notizie economiche per esplorare i mercati finanziari
Registrazione
Accedi
Se non hai un account, registrati
Consenti l'uso dei cookie per accedere al sito MQL5.com.
Abilita le impostazioni necessarie nel browser, altrimenti non sarà possibile accedere.