Guarda i video tutorial del Market su YouTube
Come acquistare un Robot di Trading o un indicatore
Esegui il tuo EA
hosting virtuale
hosting virtuale
Prova un indicatore/robot di trading prima di acquistarlo
Vuoi guadagnare nel Market?
Come presentare un prodotto per venderlo con successo
Indicatori tecnici per MetaTrader 5 - 98
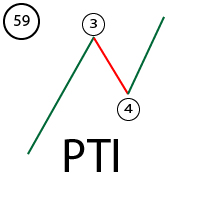
PTI is an index developed by Tom Joseph, which compares the points of Purchase/Third Wave Sales with a Buying Momentum/Sales of The Fourth Wave. This comparison will then be transferred to an algorithm that calculates the VALUE of the PTI INDEX. You can learn more about this index by reading his book Simplified Wave Analysis.
This indicator is an example of my understanding of this index.
This index should be used as follows: 1) You need to click on the "Start Calculation" chart 2) Make the
L' High Low Tracker è un indicatore essenziale per qualsiasi trader che apprezzi la precisione e la chiarezza nell'identificazione dei livelli di prezzo chiave. Progettato per i trader che utilizzano strategie istituzionali come ICT (Inner Circle Trader) , BTMM (Bank Trading Market Maker) e SMC (Smart Money Concepts) , questo strumento semplifica l'analisi multi-timeframe tracciando massimi e minimi significativi direttamente sul grafico corrente. Che tu stia facendo scalping

The Elephant Candle is an indicator for MT5. It draws arrows when strong bullish or bearish candles appear. Strong candles frequently initiate a new trend. The arrows can be used in expert advisors. This indicator can improve already existing trading strategies. The indicator is very fast and doesn't repaint.
Inputs Period Candle Multiplier Candle Niceness [%] Arrow Size Enable Alert Enable Push Notification Enable Email

Pro Period Separators For MetaTrader 5 The built-in period separators feature doesn’t allow users to specify the time period, so you can use this indicator to create advanced period separators, you can add daily, weekly, monthly, yearly separators on any time frame. Default Inputs DAILY SEPARATOR SETTINGS show daily separators = Yes hour of the separators = 04 minute of the separators = 00 color of the separators = Silver width of the separators = 1 style of the separators = STYLE_DOT
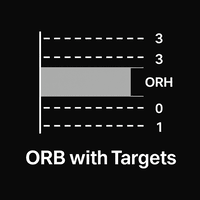
Unlock the power of the Opening Range Breakout (ORB) strategy with this highly visual, customizable MT5 indicator! Designed for intraday and session-based traders, this tool automatically plots: ️ Opening Range High & Low
️ Multi-Level Target Lines (Above & Below)
️ Clean Range Highlight (Grey Fill Box)
️ Session Timing Fully Customizable
️ Color Customization for Every Level Why You’ll Love It: Perfect for London/NY Open Breakouts ️ Adjustable number of target levels (1 to 10+)
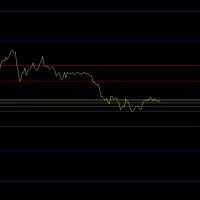
Camarilla Pivot Points Indicator A professional-grade indicator that displays Camarilla pivot points directly on your chart. These specialize d pivot points help identify potential support and resistance levels based on previous price action. Key Features Calculates multiple pivot levels (R6 to S6) with customizable colors Option to display previous day's pivot points Adjust able line width for better visibility Top and Bottom Channel lines (TC/BC) for range analysis Real-t

The Auric Pulse Indicator is a powerful MetaTrader 5 (MT5) tool designed to identify trends (uptrend, downtrend, and consolidation) in financial markets. It is particularly effective for trading Gold (XAUUSD) due to its sensitivity adjustments and multi-timeframe capabilities. Indicator Overview The indicator provides: Three trend states (color-coded): Green = Uptrend (strong bullish momentum) Red = Downtrend (strong bearish momentum) Yellow = Consolidation (sideways market) Mul

Indicador "Precision Entry Timer" - O Relógio do Timing Perfeito Este indicador revoluciona sua estratégia de trading ao identificar o momento exato para entrar em uma operação , combinando análise técnica e temporização de mercado. Ele utiliza um algoritmo avançado que cruza dados de: Volume Real (fluxo de ordens institucionais) Padrões de Candles (sequências de alta/procura com confirmação) Convergência de Médias (EMAs rápidas e lentas em alinhamento) Fuso Horário de Liquidez (períod

A utility indicator which displays account balance, equity and P&L of the current account on Chart.
Indicator parameters: Balance_Color : Change the color of the balance text Equity_Color : Change the color of the equity text Text_Size : Adjust the font size (8-20) Corner : Select which chart corner to display the text (0=top-left, 1=top-right, 2=bottom-left, 3=bottom-right) X_Offset/Y_Offset : Adjust the position from the selected corner Show_Background : Toggle the background rectangle Backg
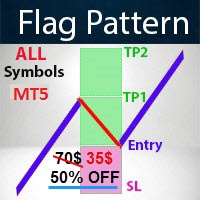
- Real price is 70$ - 50% Discount (It is 35$ now) Contact me for instruction, any questions! Related Product: Gold Trade Expert MT5 , Professor EA - Non-repaint - Lifetime update free I just sell my products in Elif Kaya Profile , any other websites are stolen old versions, So no any new updates or support.
Introduction Flag patterns are an important tool for technical traders in the stock market. When interpreting a flag pattern, it is important to wait for the pattern to pick a directi

An indicator displaying the levels of the previous candle, any time frame, opening, closing, minimum, maximum. If the candle closes above the opening, the opening and closing lines are displayed in green, implying that the trend is upward. If the closing is below the opening, the lines are painted red, signaling that the trend is downward. The quotes for these levels are displayed in the right corner.
English:
Anchored Linear Regression Channel (ALRC)
Description:
The Anchored Linear Regression Channel (ALRC) is an advanced technical analysis tool that enhances the traditional linear regression channel by allowing it to be anchored to a confirmed pivot point. This provides a more accurate and reliable reading of price behavior in relation to key structural points on the chart.
Key Features:
Anchoring to Confirmed Pivots: Manually select a significant pivot to fix the channel, ensuring t

I greatly appreciate your interest in my product and this document will serve as an explanation and guide to my indicator. (DmRO indicator) This is a visual indicator that spots potential incoming trends/continuations. Like any other indicator/strategy, nothing plays out 100 percent all the time. But this tool offers high probability outcomes and is something that is useful to have no matter what your strategy is. The levels are really specific to a time and condition that proved to be pretty c

L'indicatore Multi Timeframe Candles è un potente strumento di visualizzazione progettato per aiutare i trader ad allineare l'analisi dei timeframe inferiori con la struttura dei timeframe superiori. Tracciando le candele di un timeframe superiore selezionato (H1, H4, D1, ecc.) direttamente sul grafico corrente, questo indicatore offre una prospettiva più chiara dell'andamento generale del mercato senza dover cambiare grafico.
Chi ha bisogno di questo indicatore? Questo strumento è ideale
Interactive Volume Profile Indicator !! Interactive Volume Profile is a powerful MT5 indicator that brings advanced volume profiling capabilities to your chart, similar to what professional traders use on TradingView. This custom-designed tool allows you to analyze price levels based on traded volume, helping you identify key support and resistance areas, potential breakout points, and optimal entry/exit levels. Key Features: Fully Interactive : Select any chart range with two simple clicks to

This indicator creates a dashboard-style visual display that shows volume and volatility data across multiple:
Trading symbols (likely different currency pairs or instruments) Timeframes (different chart periods like M5, M15, H1, etc.)
The dashboard is organized in a table format where:
Symbols are listed in rows
Timeframes are displayed in columns
Each cell contains volume and volatility data for a specific symbol/timeframe combination
Main Advantages Multi-time frame Analysis: Allows you to

Information indicator for intraday traders. It includes the information field that reflects profit / loss in current positions, total profit / loss per day, maximum and minimum lot, swap for the purchase and sale. The second block displays the RSI indicator diagram to three times of frames: day, hour, and 15 minutes, with indicator values. This indicator will help to see the trader is overwhelmed or resold the financial instrument, whether it is in a correctional movement or in a strong trend.
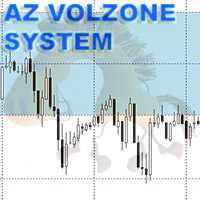
This system is a market inefficiency that many have not yet discovered. Why am I ready to share my development? Because I just need the glory of a person who found it. And even more, I see the live results of two of my friends who have mastered working with my indicator. The sale will be closed as soon as 100 people have mastered it. Many of you have been looking for a simple and effective trading system. You have found it! My indicator and the information used to work with it are the result of
Smart Trend Screener is a tool designed for traders seeking a real edge in the market. This program analyzes money flow to detect significant capital movements, allowing you to anticipate potential trend changes with high accuracy. Based on an advanced technical approach, the system interprets money accumulation and distribution in the market to identify key zones where major participants might be taking positions. It is ideal for both trend-following strategies and as an additional confirmation
Simple Dispersion Zones is a powerful yet easy-to-use indicator that identifies key trading zones by analyzing price dispersion over the last N candles. It automatically detects areas of price consolidation and highlights them on the chart using a transparent red triangle, providing a clear visual representation of recent market structure. This tool is perfect for: Drawing trend channels Identifying sideways market zones Supporting breakout and mean-reversion strategies With its clean and non-in
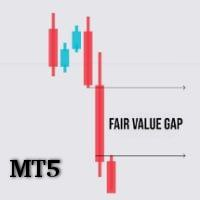
FVG Analyzer – The Ultimate Tool for Precise Fair Value Gap (FVG) Detection FVG Analyzer is a powerful and fully customizable indicator built for serious traders who leverage Fair Value Gaps (FVG) in their strategies. With smart detection and clean visuals, this tool allows you to quickly identify market inefficiencies—areas where price is likely to return before continuing in its trend. Key Features: Automatic Detection of Fair Value Gaps (bullish and bearish) based on candlestick patte
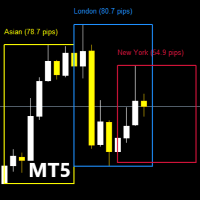
Before diving into the features of this indicator, please remember to rate this product, leave a comment to share your experience, and subscribe to my page to stay informed about the latest updates and new tools. Your support is invaluable and helps me constantly improve my creations! Description: TradingSessionPipsVisualizer - The Professional Tool for Mastering Trading Sessions Visualize Forex sessions at a glance and optimize your trading timing! The TradingSessionPipsVisualizer is a pr

Este es un indicador hecho para indices Crash, en el broker Deriv, o indices Paint en el broker Weltrade. Su funcion es buscar velas de tendencia trend, y es recomendado verlo en temporalidad de 5 minutos o mas. Se que con las velas trend, corres el riesgo que un Spike te sorprenda, sin embargo la idea es ganar pocos pips para no arriesgar mucho. Recuerda que los Spike no respetan Stop Lost pero con una buena gestión de riesgo puede ser rentable. La idea es ganar pocos pips por entradas y este i
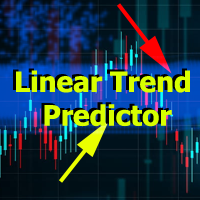
Linear Trend Predictor : indicatore di tendenza che combina punti di ingresso e linee di supporto direzionale. Funziona secondo il principio di rottura del canale dei prezzi alto/basso.
L'algoritmo dell'indicatore filtra il rumore di mercato, tiene conto della volatilità e delle dinamiche di mercato.
Capacità dell'indicatore
Utilizzando metodi di smoothing, mostra l'andamento del mercato e i punti di ingresso per l'apertura di ordini di ACQUISTO o VENDITA. Adatto per determinare i movimenti d

Arrow Trend indicators Trading with the trend is often one of the most basic pieces of advice given by experienced traders. In addition, experienced traders will often advise traders to prioritize the long-term trend, as prices usually follow the direction of the long-term trend. Arrow trend indicators are tools that traders can use to determine the direction of a trend toward a long-term trend. What is an arrow trend indicator? An arrow trend indicator is a trend-following technical indicator
Market Flow Analysis is a structure-based indicator that goes beyond traditional tools to help you spot real entry opportunities with ease. It highlights the Gold Zone — a gold-filled rectangle showing you the best possible area for entries , based on market structure, not lagging signals. Whether you're scalping or swing trading, this indicator gives you the true market trend , valid order blocks , and clear reaction zones , all in one smart visual layout. Why Market Flow Analysis? Go
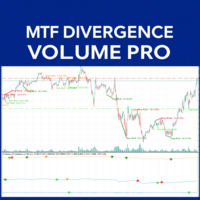
Divergence MTF Volume Pro: Your Ultimate Edge in the Market
Have you ever felt that the market takes you by surprise? Would you like a tool that anticipates possible turns and provides clearer signals for entering or exiting trades? Introducing Divergence MTF Volume Pro! Imagine seeing when price and volume (the force behind movements) start to contradict each other. This, known as divergence, is one of the most powerful signals indicating a potential trend reversal or strong continuation. Our

Candle Volume Strength è un indicatore di analisi del volume avanzato che fornisce informazioni sulla battaglia in corso tra acquirenti e venditori. Calcola e visualizza i cambiamenti di volume in tempo reale, aiutando i trader a confermare breakout, trend, ritracciamenti e inversioni con maggiore accuratezza.
Caratteristiche principali: Conferma basata sul volume: l'indicatore monitora le variazioni del volume dei tick e avvisa quando il potere di mercato si sposta tra acquirenti e venditor

Dynamic Levels Marker is a smart MT5 indicator that automatically detects and plots three support and three resistance levels using a tiered historical analysis. Levels are visually distinct, labeled, and adapt as price evolves.
Key Features:
Dynamic multi-level support/resistance zones
Tiered logic based on recent price action
Customizable alerts (popup, sound, push notifications)
Clean visual lines with auto-positioned labels
Lightweight and easy to use on any timeframe
Whether you’re
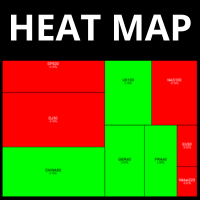
Dynamic Heatmap for MetaTrader 5 — Instantly Spot Market Opportunities Revolutionize the way you see the markets with the most complete and intelligent Heatmap for MetaTrader 5. Designed for traders who demand speed and clarity in decision-making, our Heatmap creates a powerful visual representation of market performance in real time. Key Benefits Instant Read of Market Strength Instantly see which assets are leading or lagging. Dynamic color coding for quick identification: green for ri
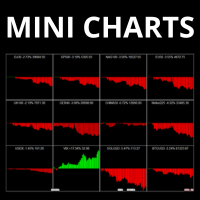
Your market overview, now crystal clear. With our Mini Charts Indicator for MetaTrader 5 , you’ll have the power of multiple charts inside a single, ultra-clean workspace. No more switching between assets or opening dozens of charts. Our Mini Charts give you instant visual snapshots of multiple markets — all in real time. Each mini chart displays the price action of the selected asset, showing whether it’s trending up or down, giving you immediate market sentiment at a glance. Whether you’re mon
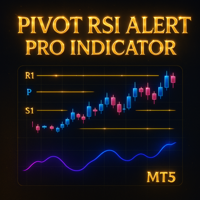
Detailed Description: The Pivot RSI Alert Pro Indicator is a powerful all-in-one indicator that combines five pivot point methods (Classic, Fibonacci, Woodie, Camarilla, DeMark) with a customizable RSI filter. It automatically plots daily pivot levels and midpoints, highlights key reversal zones and sends alerts when price approaches these levels, especially under RSI overbought/oversold conditions. Ideal for intraday and swing traders who rely on dynamic support/resistance and momentum confirm

Simple Candle Timer
Overview: The Simple Candle Timer is a simple, yet powerful, tool for traders who want to stay informed about the time remaining until the next candle appears on their chart. Whether you are trading on minute charts or higher timeframes, this indicator ensures you never miss a new candle formation.
Features: Real-Time Countdown Timer: Displays the time left until the current candle closes and a new one starts. The timer updates smoothly every 100 milliseconds for precision

Volume Flow Analyzer The Indicator helps you decode market activity by visualizing real-time volume strength. Whether you're a fast-paced scalper or a patient swing trader , this tool gives you a clearer view of when volume truly supports the price action.
Instructions: Indicator alerts when there is expected increase in volatility by analyzing volumes to allow a trader to prepare. It indicates "High Expected Volatility in such cases", It should be used along with your buy and sell parameters

GoldX PRO is a good trend indicator. The indicator's unique algorithm analyzes the asset price movement, taking into account technical and mathematical analysis factors, determines the most profitable entry points and issues a signal to open a BUY or SELL order. Special offer - https://www.mql5.com/en/users/bossik2810
Advantages of the indicator: The indicator produces signals with high accuracy. The confirmed indicator signal does not disappear and is not redrawn - after the signal is confirm
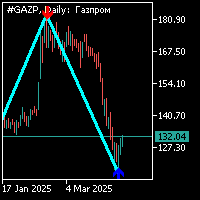
L'indicatore zig-zag è standard con un periodo di 34 con un segnale aggiuntivo a forma di freccia. Il segnale aggiuntivo viene calcolato separatamente dall'indicatore zig-zag.Il lavoro su questo indicatore è il seguente: 1. quando si forma un segmento dell'indicatore zig-zag e la comparsa di un segnale aggiuntivo sotto forma di una freccia, è necessario aprire la posizione verso la direzione della freccia; 2. quando si forma un altro braccio dell'indicatore zig-zag nella direzione opposta del s
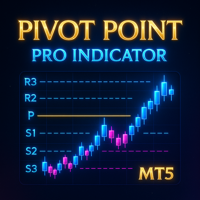
Detailed Description: The Pivot Point Pro Indicator is a powerful all-in-one fully customizable indicator that takes care of five pivot point methods (Classic, Fibonacci, Woodie, Camarilla, DeMark). It automatically plots pivot levels and midpoints, highlights key reversal zones and sends alerts when price approaches these levels. Unlike the free Pivot Point Classic version, this Pro indicator allows users to customize more settings, analyze current and historical pivot points and use al

# Weekly & Daily Stochastic Signal Indicator User Guide
## Overview This indicator combines the Stochastic oscillator on weekly and daily timeframes to generate strong trading signals. It aims to create more reliable signals by tracking momentum changes across different timeframes.
## Parameters - **ShortPeriod (14)**: Daily Stochastic period - **ShortPeriodSMA (3)**: Daily Stochastic SMA period - **LongPeriod (70)**: Weekly Stochastic period - **LongPeriodSMA (3)**: Weekly Stochastic SMA per

This scanner is based on the Bill Williams Awesome Oscillator (AO) indicator and is designed for faster analysis of financial instruments. The chart shows five vertical columns, which includes a financial instrument that meets certain criteria. The first column shows financial instruments with a strong trend, namely when the AO indicator is above the zero line on three time frames. If there is a strong downward trend in the market, then such instruments will fall into the fifth column. The seco
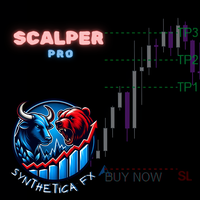
The SyntheticaFX Scalper Pro Indicator is a versatile and user-friendly tool designed to assist traders in identifying high-accuracy entry points across multiple timeframes and all currency pairs. This indicator provides clear visual signals on the chart, along with recommended Stop Loss (SL) and Take Profit (TP) levels, making it easier for traders to plan their trades with confidence. With its built-in dashboard, the SyntheticaFX Scalper Pro Indicator offers real-time trade statistics, helpin

The Swing High Low and Fibonacci Retracement Indicator is a powerful technical analysis tool designed to identify key price levels and potential reversal zones in the market. It automatically detects recent swing highs and swing lows on the chart and overlays Fibonacci retracement levels based on these points. This indicator helps traders: Visualize market structure by highlighting recent swing points. Identify support and resistance zones using Fibonacci ratios (e.g., 38.2%, 50%, 61.8%). Adapt
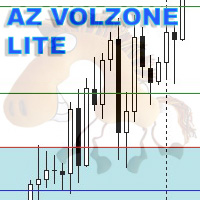
Information: I have developed two versions of the indicator: AZ_Azazavr and AZ_volzone_SYSTEM. The only difference between the AZ_Azazavr version and the AZ_volzone_SYSTEM version is the presence of automatic calculation in the AZ_volzone_SYSTEM version of the indicator and the presence of calculation of a slightly larger number of levels. Otherwise, you are purchasing not just an indicator, but a ready-made trading system.
Friends, many have been looking for a simple and effective system for

The Quasimodo Pattern Indicator is no more difficult than the Head and Shoulders. Still, only a few traders know about it, and some even confuse one with the other. However, this is not a reason to avoid this tool in your forex trading strategy. Features: Automatic Detection: The indicator automatically scans for valid QM patterns across any timeframe, reducing the need for manual chart analysis. Visual Highlights: Clear and customizable on-chart drawing of shoulders, heads, and breakout zones
“Questo strumento di trading segreto è stato bandito dalle società di consulenza (non vogliono che lo sappiate!)”.
Scoprite l'ultimo vantaggio di trading - senza EA! (Realizzato per i trader, da un trader. Non un robot - solo pura potenza di trading!)
Avete difficoltà con i falsi breakout, le inversioni improvvise o la manipolazione del mercato? Questo potente strumento di trading vi fornisce segnali precisi al laser anche quando i mercati si muovono velocemente, aiutandovi a individuare e

Unlock the potential of automated trading on Gold (XAUUSD) and Euro/USD (EURUSD) with the Gold Euro Edge indicator . This indicator is expertly designed to capitalize on market movements in these key pairs, aiming for consistent performance by displaying buy or sell arrows on chart, audible alerts on laptop and notifications to phone. Experience efficiency and potentially enhance your trading strategy with this specialized solution.

مؤشر Smart Trend Candles هو أداة فعّالة في منصة MetaTrader 4، تجمع بين عناصر تحليل فني متعددة لتحديد اتجاهات السوق وقياس قوة المشترين والبائعين. يوفر هذا المؤشر متعدد الاستخدامات إشارات مرئية واضحة تُحسّن قرارات التداول الخاصة بك. الميزات الرئيسية 1. تحديد الاتجاه يستخدم شموع Heikin-Ashi المعدلة (اختياري) لتصفية ضوضاء السوق يتضمن متوسطًا متحركًا (فترة قابلة للتكوين) لتأكيد الاتجاه تنفيذ مؤشر القوة النسبية لقياس الزخم 2. قياس القوة تشير الشموع المرمزة بالألوان إلى شدة ضغط الشراء/البيع تحليل الحج
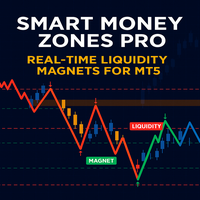
Se desideri provare a conoscere meglio il funzionamento dell'indicatore SM Zones Pro, ti consigliamo di scaricare e provare prima l'indicatore gratuito SM Zones, adattato per funzionare con un singolo strumento EURUSD in diversi timeframe. Puoi scaricare SM Zones da questo mercato. SM Zones Pro, a differenza di SM Zones, può analizzare fino a 10 strumenti diversi contemporaneamente.
Sviluppato secondo i principi delle strategie di gestione intelligente del denaro, l'indicatore SM Zones Pro è u

This indicator is converted from Pinescript to MQL5 and consisting of buffers for the range lines as well, its not only object.
The Range Detector indicator aims to detect and highlight intervals where prices are ranging. The extremities of the ranges are highlighted in real-time, with breakouts being indicated by the color changes of the extremities.
USAGE Ranging prices are defined by a period of stationarity, that is where prices move within a specific range.
Detecting ranging marke

Do you find it difficult to track and manage your open positions across multiple different symbols in MetaTrader 5? Do you need a quick and comprehensive overview of your current market exposure and the performance of each symbol individually? The "Dynamic Exposure Table" indicator is your ideal tool! This indicator displays a clear and detailed table in a separate window below the chart, summarizing all your open positions and intelligently grouping them by symbol, giving you a complete view of
Fractal Model Indicator for Metatrader , meticulously crafted around the renowned Fractal Model by TTrades. This powerful tool empowers traders to navigate price action with precision, leveraging multi-timeframe analysis to anticipate momentum shifts, swing formations, and trend continuations. Designed for MetaTrader , the Fractal Model Indicator combines advanced algorithmic insights with customizable features, making it an essential addition for traders seeking to capitalize on expansive mar
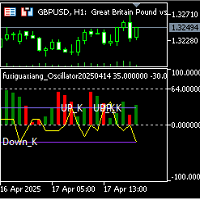
Fuxi Hexagram Oscillation Signal Alert Indicator — An Innovative Trading Tool Combining I Ching Philosophy with Modern Quantitative Analysis 1. Product Overview The Fuxi Hexagram Oscillation Signal Alert Indicator is a cutting-edge technical analysis tool that integrates ancient Chinese I Ching (Book of Changes) philosophy with modern financial market data analysis. By converting K-line (candlestick) chart behavior into dynamic hexagram structures, the indicator provides traders with real-time t

Zone to Zone Indicator for MT5 Unleash the full potential of your trading strategy with the "Zone to Zone" indicator for MetaTrader 5. This advanced tool provides unparalleled precision and versatility, making it an essential addition to any trader's toolkit. Key Features: MT5 Compatibility : Seamlessly integrates with the MetaTrader 5 platform for a smooth and efficient trading experience. Accurate Historical Resistance/Support Zones : Effortlessly draw and identify key resistance and support

The Accumulation and Distribution indicator is a volume-based indicator that was essentially designed to measure underlying supply and demand. This is accomplished by trying to determine whether traders are actually accumulating (buying) or distributing (selling). This is accomplished by plotting a cumulative total of the money flow volume for each period. This indicator can reveal divergences between volume flow and actual price to primarily affirm a current trend or to anticipate a future reve

Identifica facilmente la vera forza del mercato — anche se sei un principiante.
Il Momentum Shadow Indicator (MSI) è perfetto sia per i principianti che per i professionisti.
Ti mostra se il mercato ha davvero forza — così saprai quando comprare o vendere con fiducia. Niente confusione. Niente supposizioni.
Solo linee semplici che ti dicono cosa è reale e cosa no. Facilissimo da usare — per tutti i livelli
Segnali chiari di acquisto e vendita
Funziona meglio su timeframe di 20 minuti in su
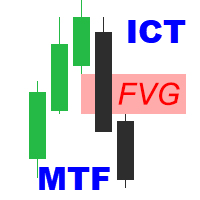
ICT Fair Value Gaps MTF Indicator Unlock the power of Fair Value Gaps (FVGs) across multiple timeframes using the ICT Fair Value Gaps Multi - Timeframe Indicator —a precision tool built for traders who follow the Smart Money Concept (SMC) . Key Features : Multi-Timeframe FVG Detection : Automatically identifies Fair Value Gaps from higher timeframes (M15, H1, H4, etc.) and plots them on your active chart for immediate insight. Dynamic Visualization : FVG zones are color-coded by timeframe an

The TrendKiller Oscillator is a custom MetaTrader 5 (MT5) indicator designed to help traders analyze price deviations from a moving average, displayed in a separate window. It calculates the difference between a chosen price (e.g., close) and a moving average (default: 14-period SMA), producing a detrended value that oscillates around a zero line. Dynamic maximum and minimum levels, computed over a user-defined period (default: 50 bars), provide context for identifying overbought/oversold condi

This is the test product. Please, DO NOT BUY IT! This is the test product. Please, DO NOT BUY IT! This is the test product. Please, DO NOT BUY IT! This is the test product. Please, DO NOT BUY IT! This is the test product. Please, DO NOT BUY IT! This is the test product. Please, DO NOT BUY IT! This is the test product. Please, DO NOT BUY IT! This is the test product. Please, DO NOT BUY IT!
MetaTrader Market - i robot di trading e gli indicatori tecnici per trader sono disponibili nel tuo terminale di trading.
Il sistema di pagamento MQL5.community è disponibile per tutti gli utenti registrati sul sito MQL5.com che effettuano transazioni su MetaTrader Services. Puoi depositare e prelevare denaro usando WebMoney, PayPal o una carta di credito.
Ti stai perdendo delle opportunità di trading:
- App di trading gratuite
- Oltre 8.000 segnali per il copy trading
- Notizie economiche per esplorare i mercati finanziari
Registrazione
Accedi
Se non hai un account, registrati
Consenti l'uso dei cookie per accedere al sito MQL5.com.
Abilita le impostazioni necessarie nel browser, altrimenti non sarà possibile accedere.